

On Feb. 14, the THETA price broke out from a descending resistance line and reached a high of 1,807 satoshis. It has been decreasing ever since.
THETA (THETA) Price Highlights
- THETA broke out from a descending resistance line.
- A golden cross has transpired.
- The price is following an ascending support line.
- The weekly RSI is bullish.
- There is support at 1,300 satoshis.
Will the price continue moving upward, or will it break down instead? Keep reading below if you are interested in finding out.$THETA hitting the TP for a nice 16% trade. Wouldn't be surprised to see it run more though. pic.twitter.com/AMFeO9AACS
— IncomeSharks (@IncomeSharks) February 25, 2020
Previous Breakout
Since the tweet, the price has already decreased significantly, most likely due to the recent BTC price decrease. This decrease served to validate the descending resistance line from which the price broke out on Feb. 14. In addition, this movement also served to validate the 50-day moving average (MA), which has previously made a bullish cross with the 200-day one (golden cross). Finally, the RSI has bounced at 50, making this a very suitable place for the beginning of a reversal.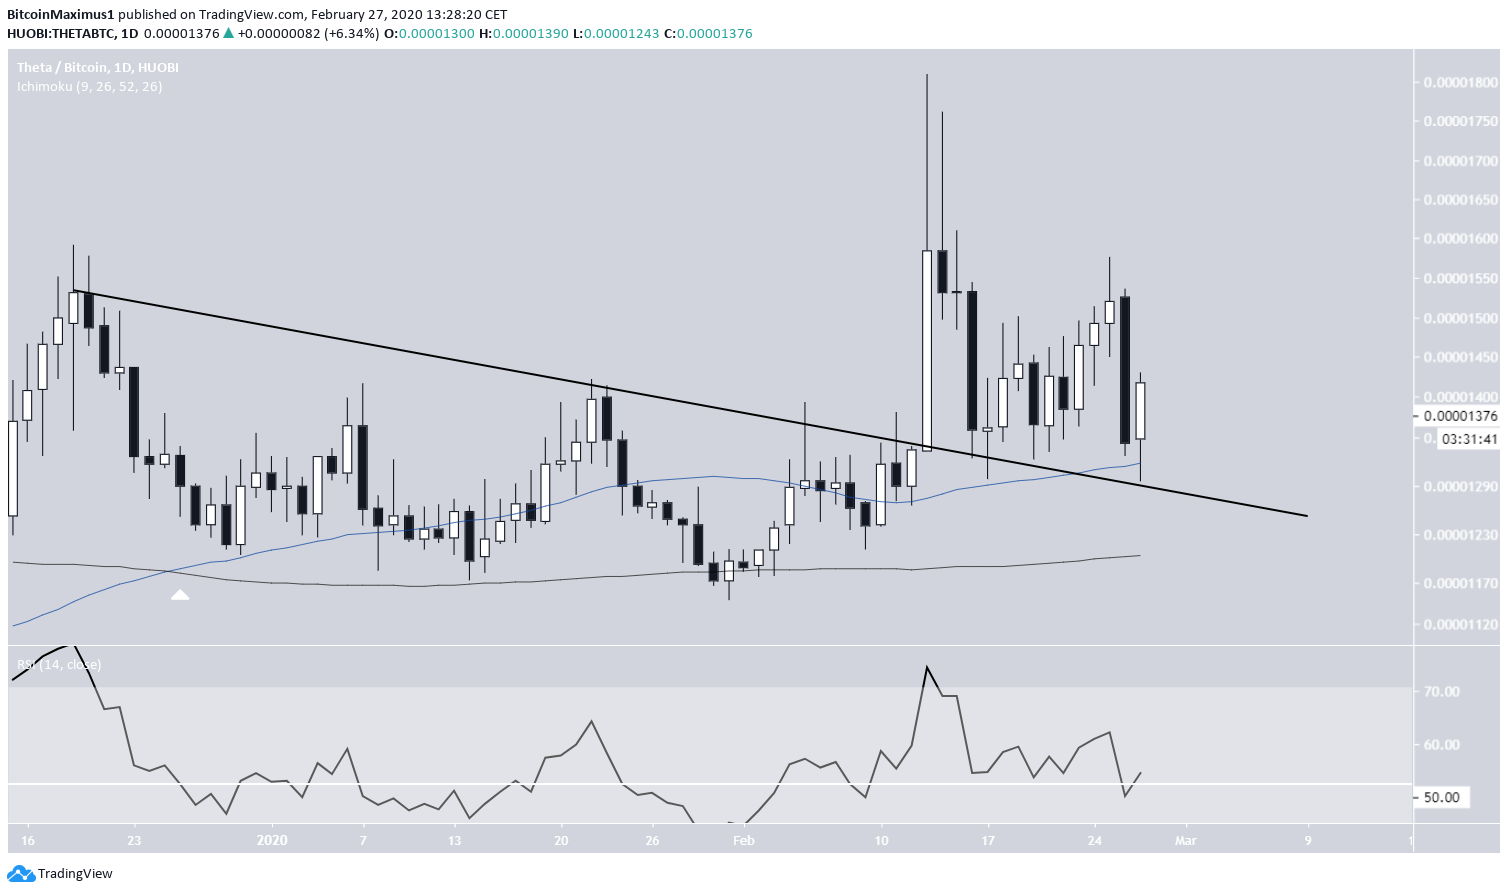
Symmetrical Triangle
Since Jan. 30, the THETA price has been following an ascending support line and possibly trading inside a symmetrical triangle. Since the resistance line has not been validated sufficiently, we cannot yet confirm it. The price is also trading inside a support area at 1,300 satoshis. The symmetrical triangle is a neutral pattern, and there is no divergence present. Therefore, a look at the longer-term chart is required in order to determine the direction of the breakout. The pattern is projected to end on March 10.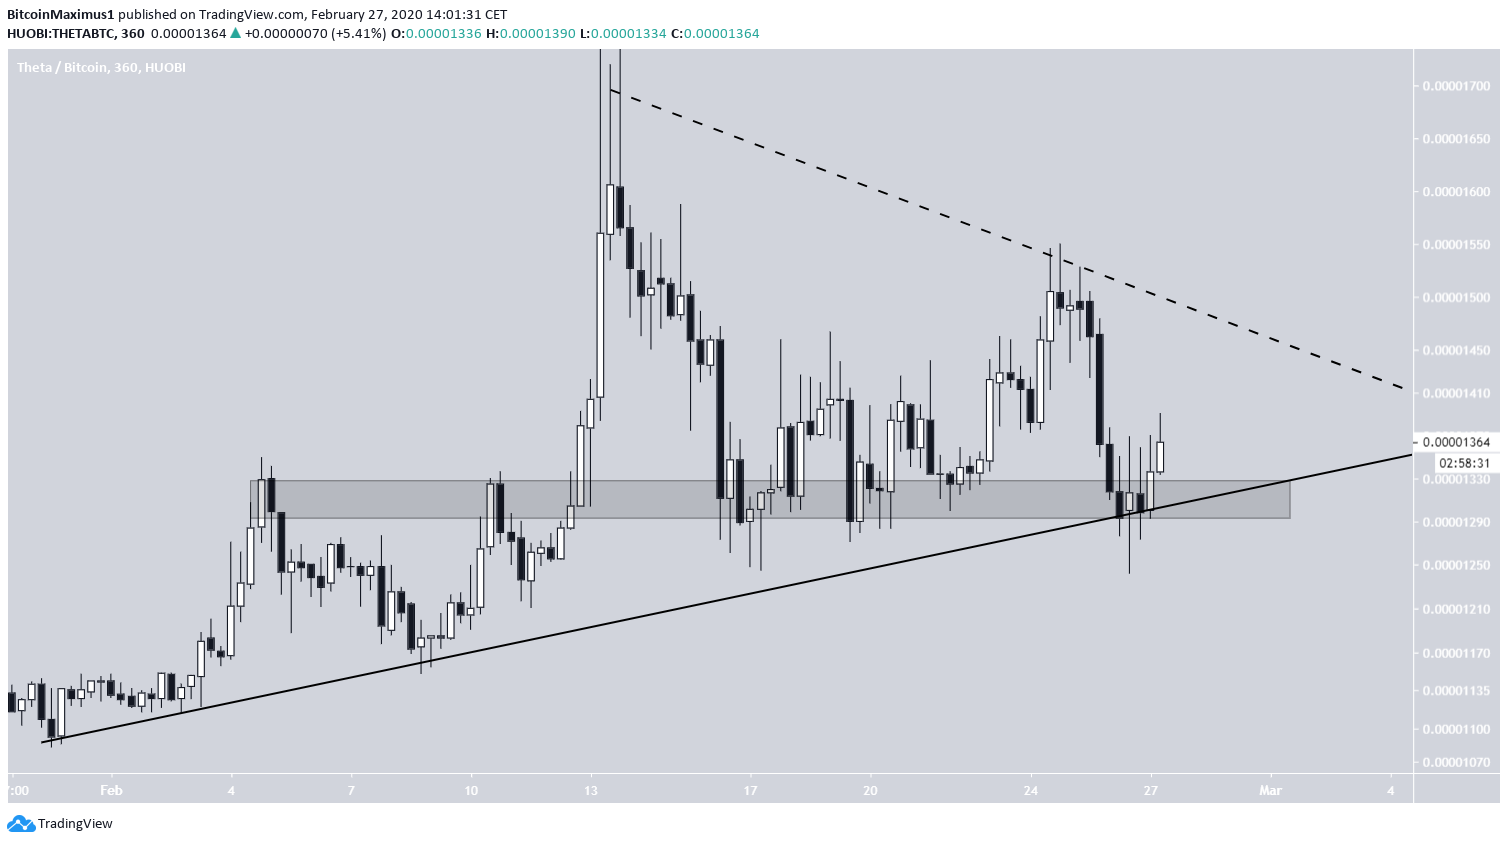
Long-Term Movement
The long-term outlook is bullish. The rally that began in December 2019 was preceded by a very significant bullish divergence in the RSI, which has now moved above 50, suggesting that the price is in a bullish trend. Furthermore, it is possible that the price is trading inside a longer-term ascending triangle, making a breakout more likely. The closest resistance area is found at 1,800 satoshis while the next one is at 2,550 satoshis.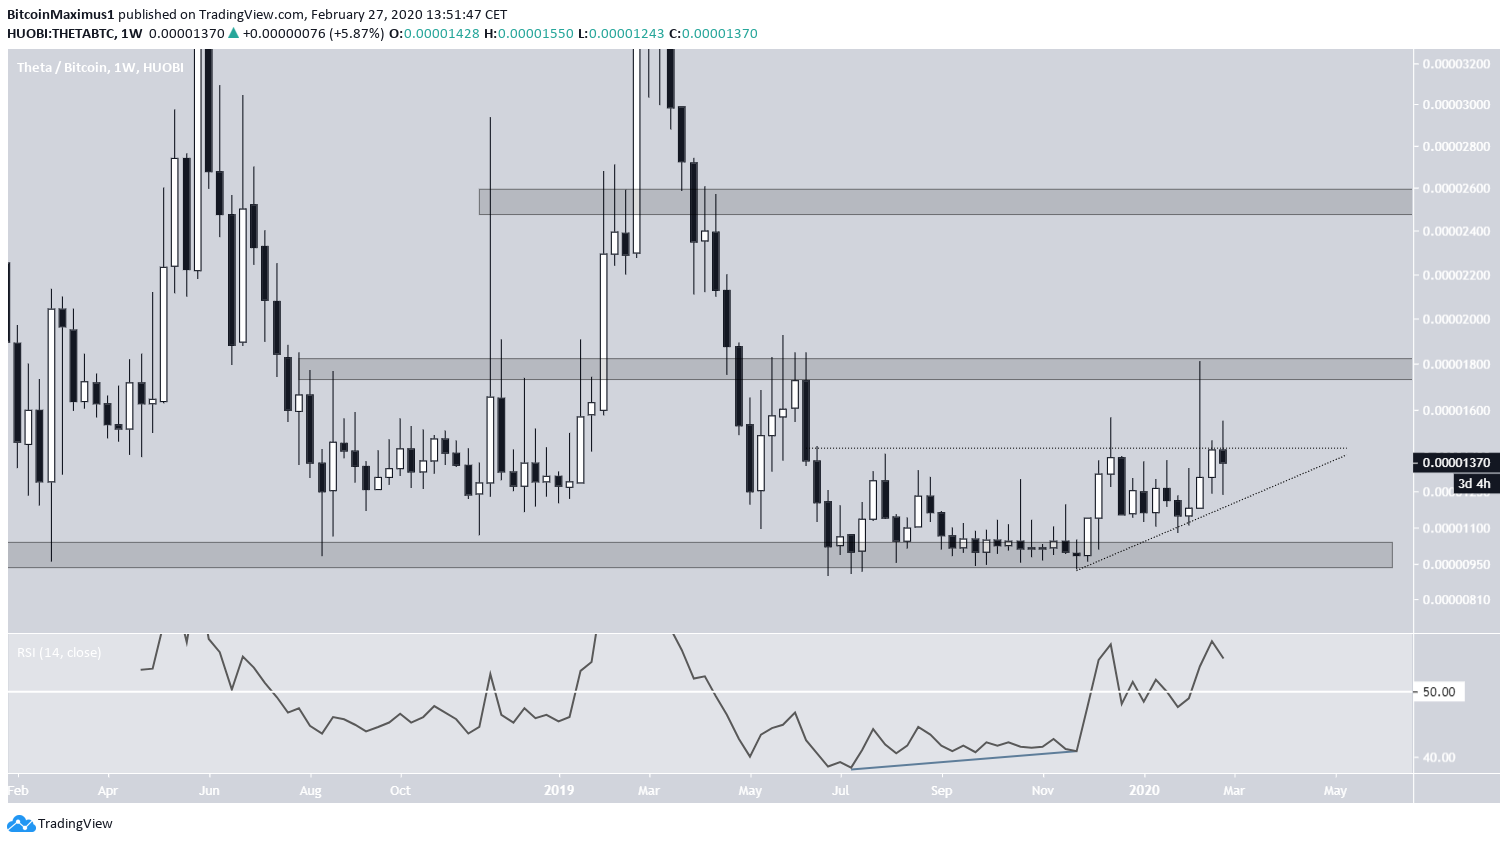 To conclude, the THETA price decreased significantly on Feb. 26, causing it to validate a crucial support level. We believe the price will eventually break out from the current pattern and move toward 1,800 satoshis.
Top crypto projects in the US | April 2024
Trusted
Disclaimer
In line with the Trust Project guidelines, this price analysis article is for informational purposes only and should not be considered financial or investment advice. BeInCrypto is committed to accurate, unbiased reporting, but market conditions are subject to change without notice. Always conduct your own research and consult with a professional before making any financial decisions. Please note that our Terms and Conditions, Privacy Policy, and Disclaimers have been updated.

Valdrin Tahiri
Valdrin discovered cryptocurrencies while he was getting his MSc in Financial Markets from the Barcelona School of Economics. Shortly after graduating, he began writing for several different cryptocurrency related websites as a freelancer before eventually taking on the role of BeInCrypto's Senior Analyst.
(I do not have a discord and will not contact you first there. Beware of scammers)
READ FULL BIO
Sponsored
Sponsored