

The DigiByte (DGB) price has been moving upwards since Dec. 21 but has failed to clear a crucial resistance level.
Despite the rejection, DigiByte is trading above a long-term support area and the trend is considered bullish as long as it continues doing so.
DigiByte Daily Rejection
DigiByte has been increasing since reaching a low of $0.0171 on Dec. 21. The increase was initially swift, but DGB failed to sustain the rally above the 0.618 Fib retracement level resistance at $0.03 and was sharply rejected.
However, DGB found support at the previous resistance level of $0.0235. It created a long lower wick and validated the level as support.
Despite the bounce, technical indicators in the daily time-frame are leaning bearish. The MACD has generated successive lower momentum bars and the RSI is close to falling below 50. If a bearish cross in the Stochastic oscillator were to occur, it would likely confirm the bearish trend
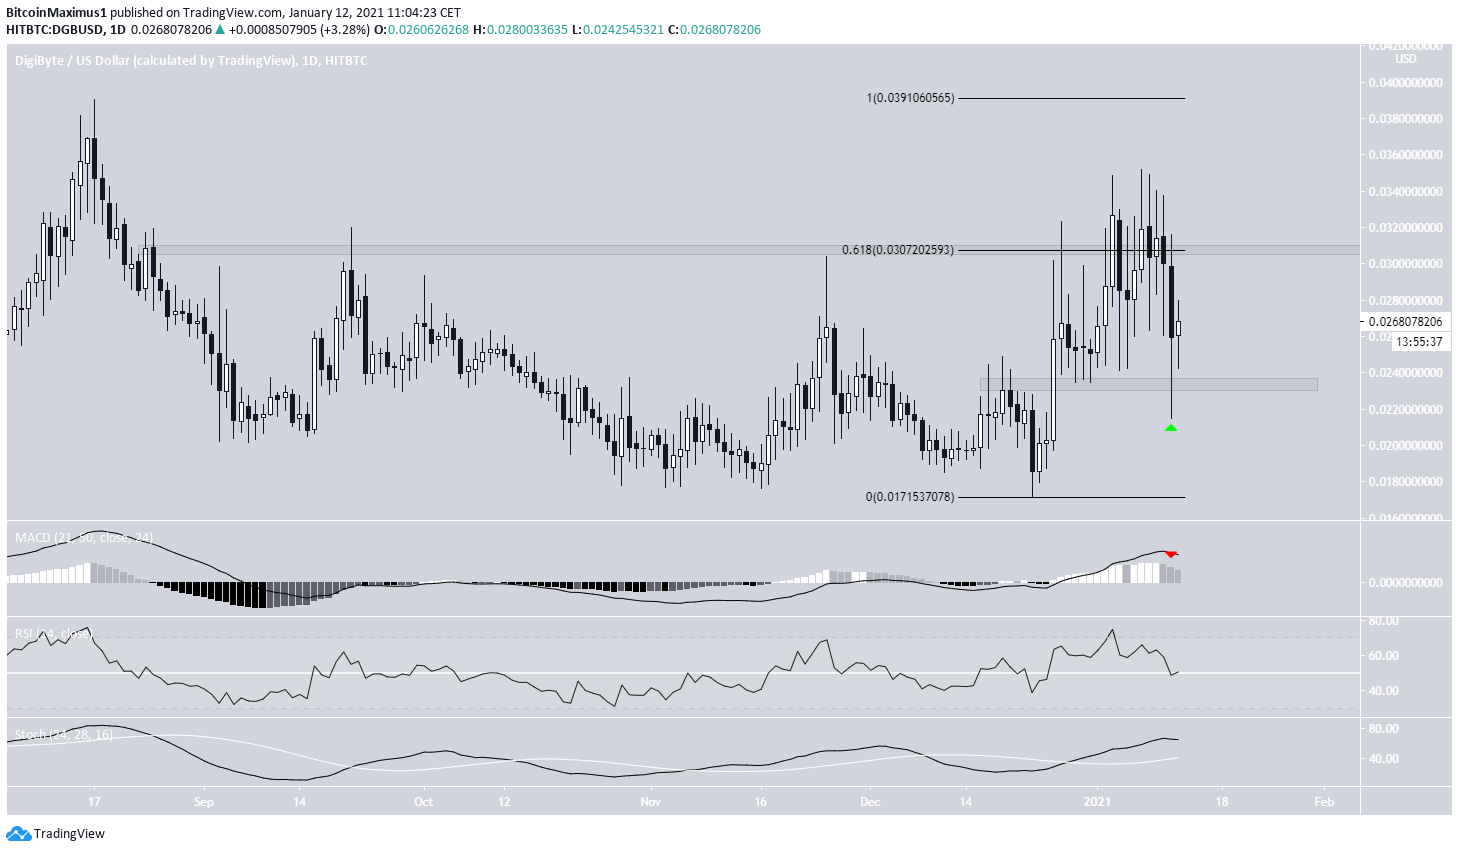
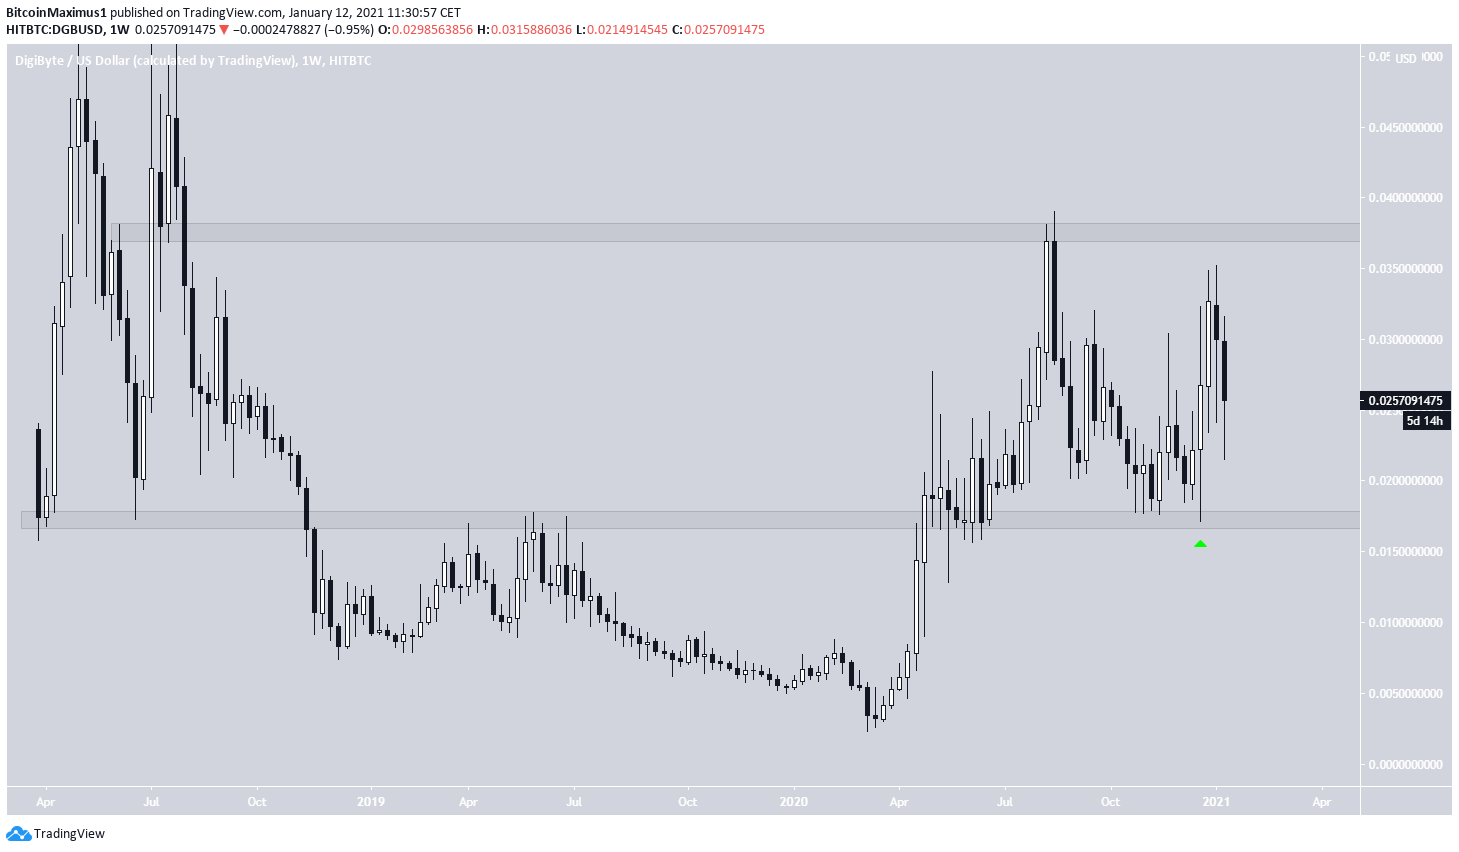
Nevertheless, the long-term breakout level is found at $0.0175 and DGB has been trading above it since initially breaking out in April.
As long as it is trading above this level, the long-term trend is considered bullish and DGB is expected to make another attempt at moving above the August highs of $0.038.
Future Movement
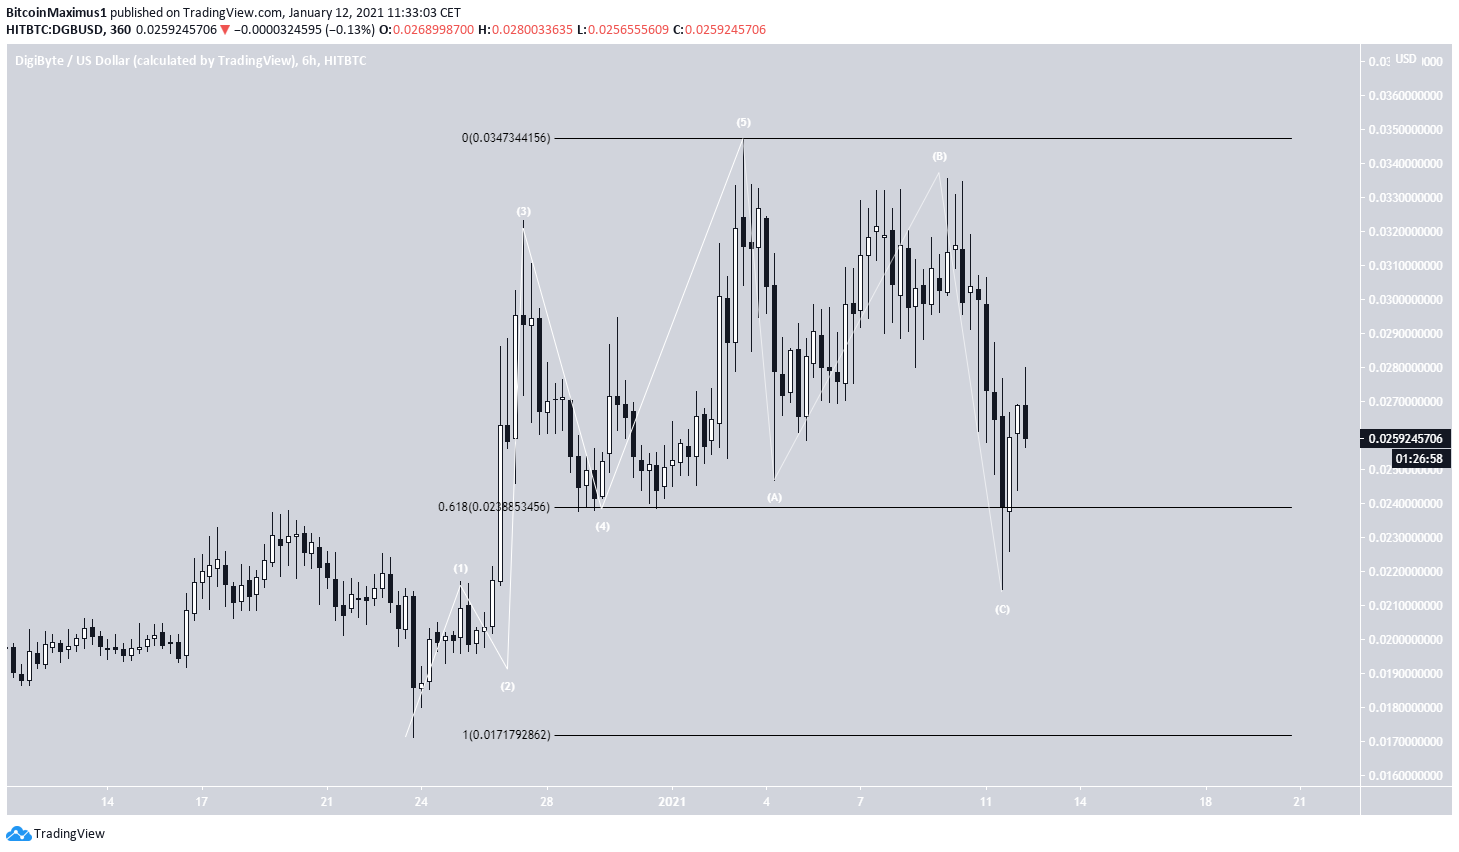
The movement since the Dec. 21 low closely resembles a completed bullish impulse and an ensuing A-B-C corrective structure. Furthermore, the low was made right at the 0.618 Fib retracement level of the upward movement, making it likely that the correction was completed at this level.
In any case, the bullish impulse remains valid as long as DGB is trading above the $0.0171 low, which is also the previously outlined long-term resistance level.
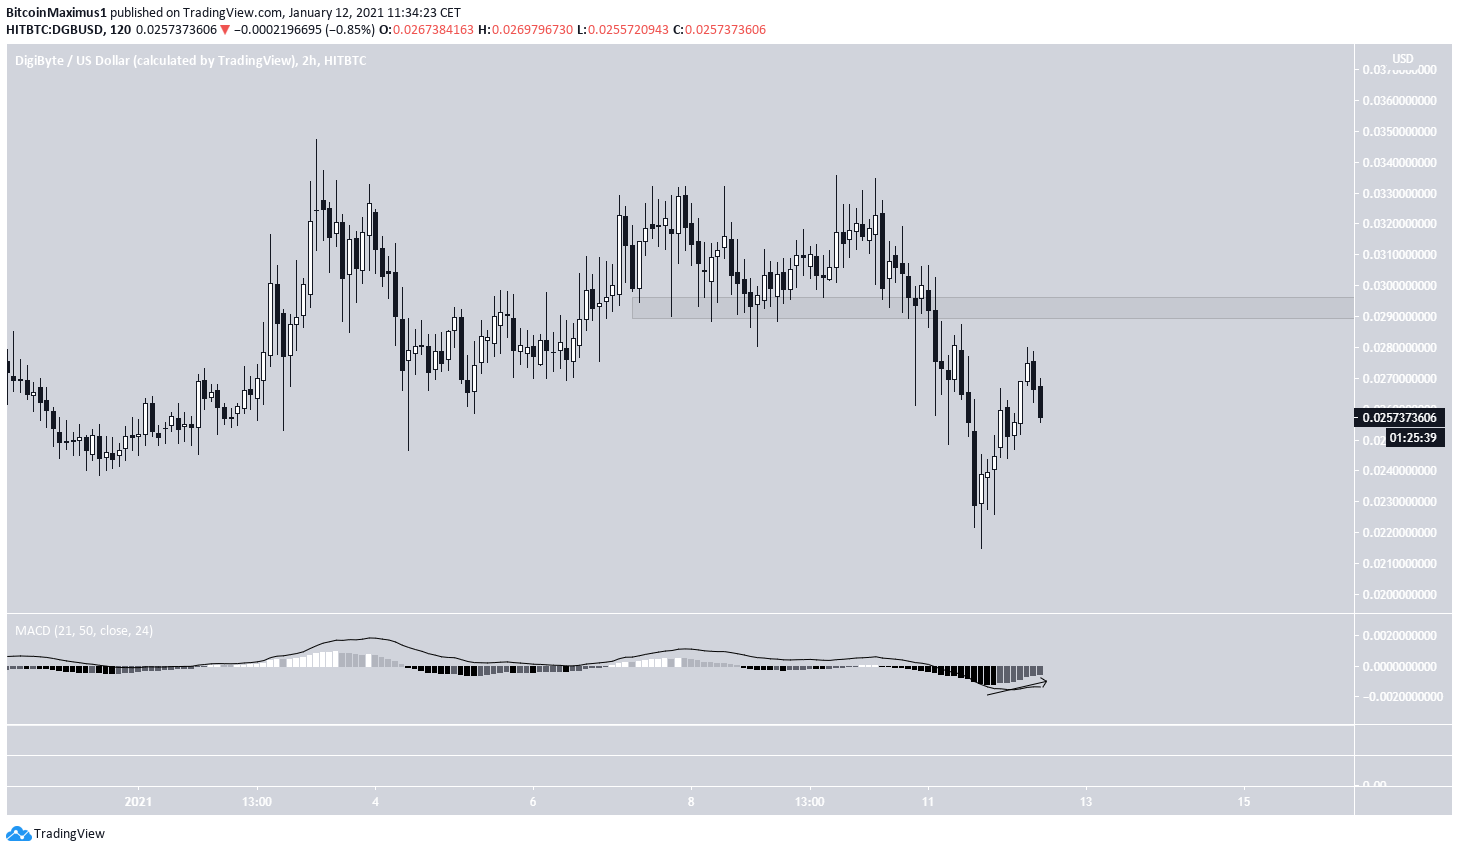
The two-hour chart shows an increasing momentum in the MACD, which is considered a bullish sign.
If DGB creates a higher low and a bullish structure, it would suggest that it is heading higher. Reclaiming the previous breakdown level at $0.029 would help to confirm this possibility and suggest that DGB is heading to the long-term resistance level at $0.038.
DGB/BTC
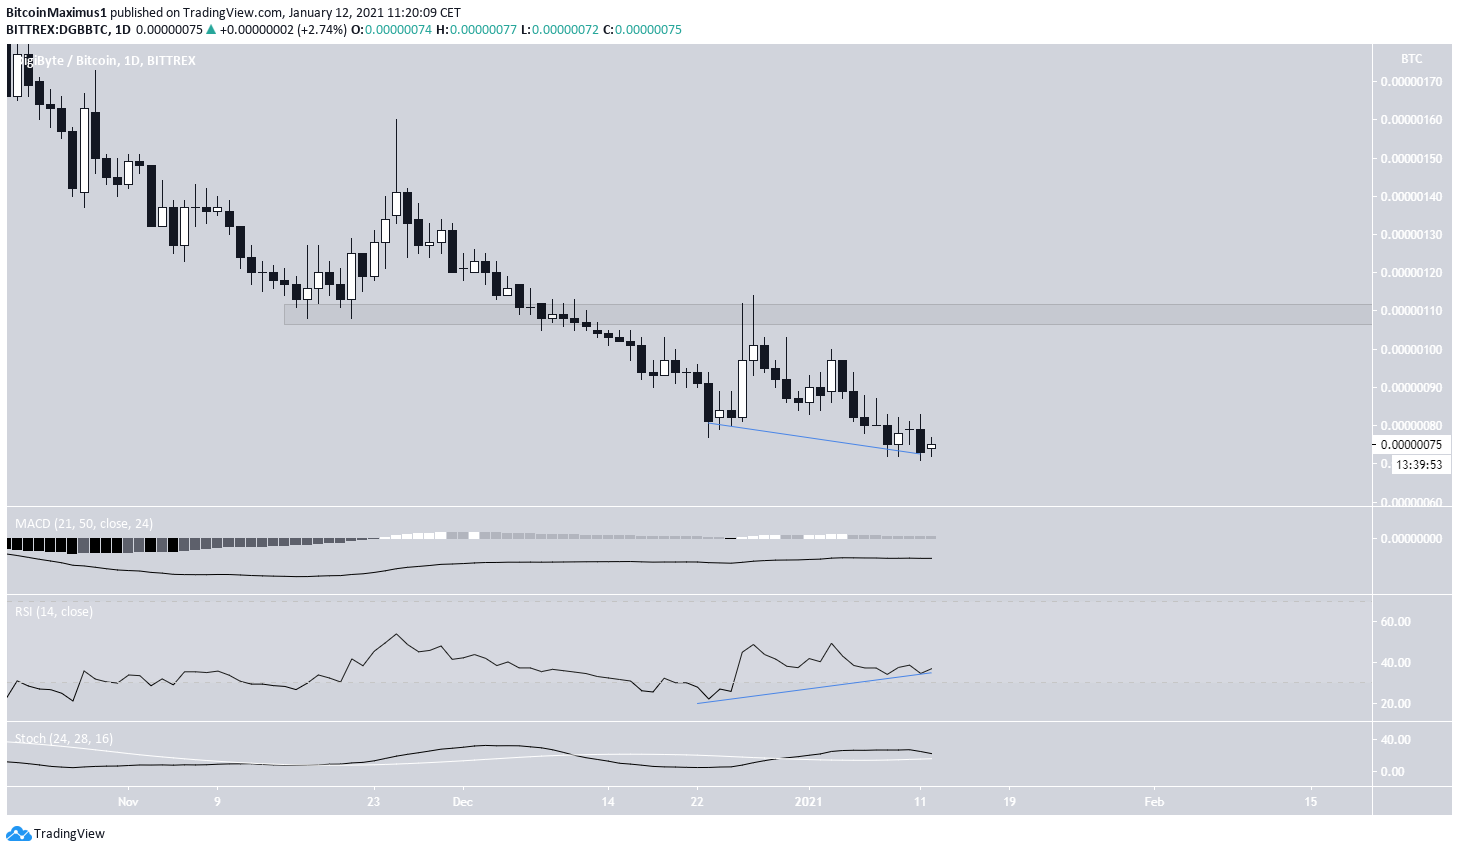
Cryptocurrency trader @JJcycles outlined a DGB/BTC chart, stating that it’s expected to begin moving upwards soon.

There is indeed a very significant bullish divergence developing in the daily RSI. However, the price action for DGB/BTC does not yet show any bullish movement.
The previous support level is found at 110 satoshis, and until DGB reclaims it, the trend cannot be considered bullish.
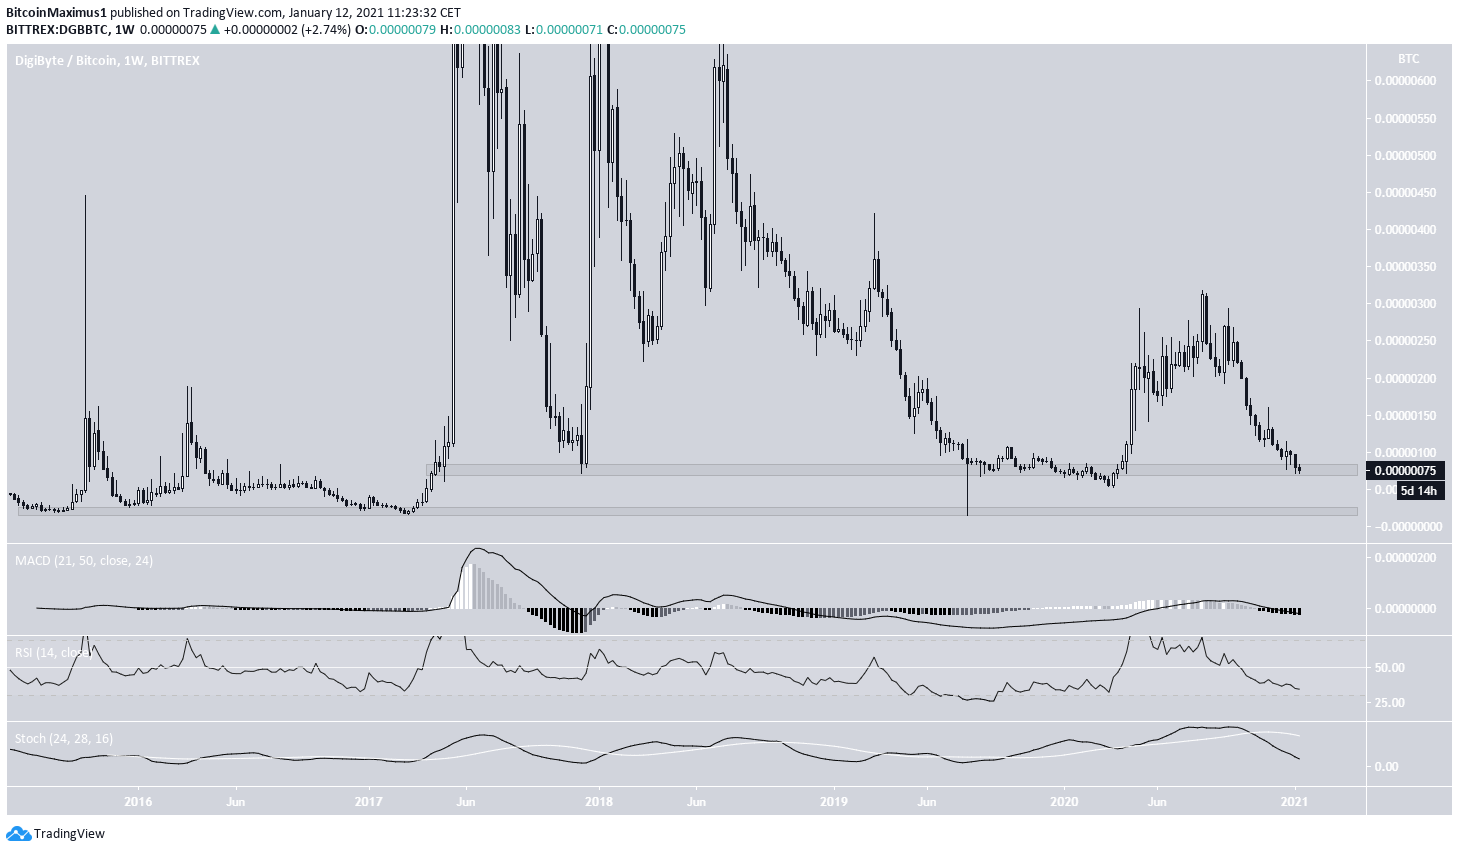
The weekly chart also shows that DGB is trading at a very long-term support level at 75 satoshis. Nevertheless, there are no bullish reversal signs yet.
If DGB were to break down from this support level, the next closest support would be found at 20 satoshis.
Conclusion
The trend for DigiByte is considered bullish as long as it’s trading above $0.0171.
While the DGB/BTC pair is trading at a very strong long-term support level, there are no definite bullish reversal signs yet.
For BeInCrypto’s latest Bitcoin (BTC) analysis, click here!
Disclaimer: Cryptocurrency trading carries a high level of risk and may not be suitable for all investors. The views expressed in this article do not reflect those of BeInCrypto.
Trusted
Disclaimer
In line with the Trust Project guidelines, this price analysis article is for informational purposes only and should not be considered financial or investment advice. BeInCrypto is committed to accurate, unbiased reporting, but market conditions are subject to change without notice. Always conduct your own research and consult with a professional before making any financial decisions. Please note that our Terms and Conditions, Privacy Policy, and Disclaimers have been updated.
