AXS has bounced at the $51 horizontal support area.
Technical indicators are giving oversold readings.
AXS has completed a five wave downward movement.
promo
Axie Infinity (AXS) has bounced at an important horizontal support level and could potentially initiate an upward movement towards $91.
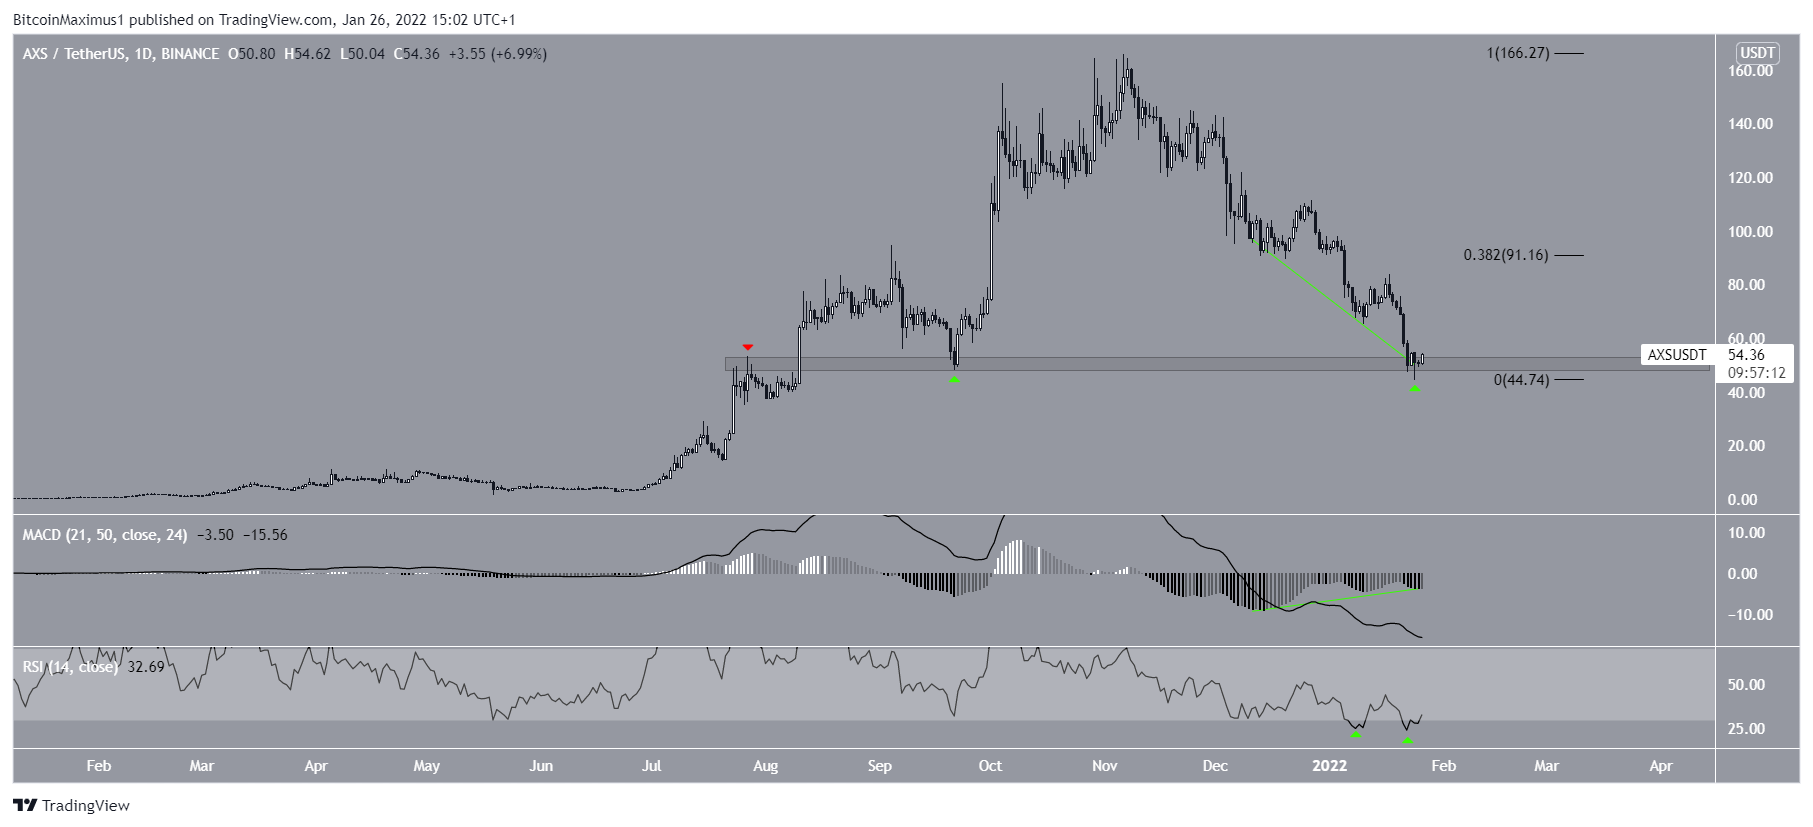
AXS has been falling since Nov 6, when it reached an all-time high price of $166. So far, it has decreased by 67%. This led to a low of $4.42 on Jan 24.
The low served to validate the $51 horizontal area as support. Previously, the area had acted as resistance in July (red icon) before turning to support in Sept (green icon).
If the bounce continues, the closest resistance area would be at $91. This is the 0.382 Fib retracement resistance level.
Chart By TradingView
Cryptocurrency trader @Murfski_ noted the importance of this area, suggesting that a bounce could transpire once it is reached.
Source: Twitter
Oversold readings
Technical indicators for AXS in the daily time-frame do not yet confirm the possibility of a bullish reversal. However, they are showing that the rally is extremely oversold. This is especially visible in the RSI, which is a momentum indicator.
On Jan 22, the RSI reached a new all-time low of 24. It also created a double bottom relative to the value on Jan 8. Values below 30 are considered oversold.
In addition to this, there is a growing bullish divergence in the histogram of the MACD. While this is not as strong a bullish sign as divergence in the MACD itself, it still supports the possibility of a significant bounce.
Chart By TradingView
Short-term AXS movement
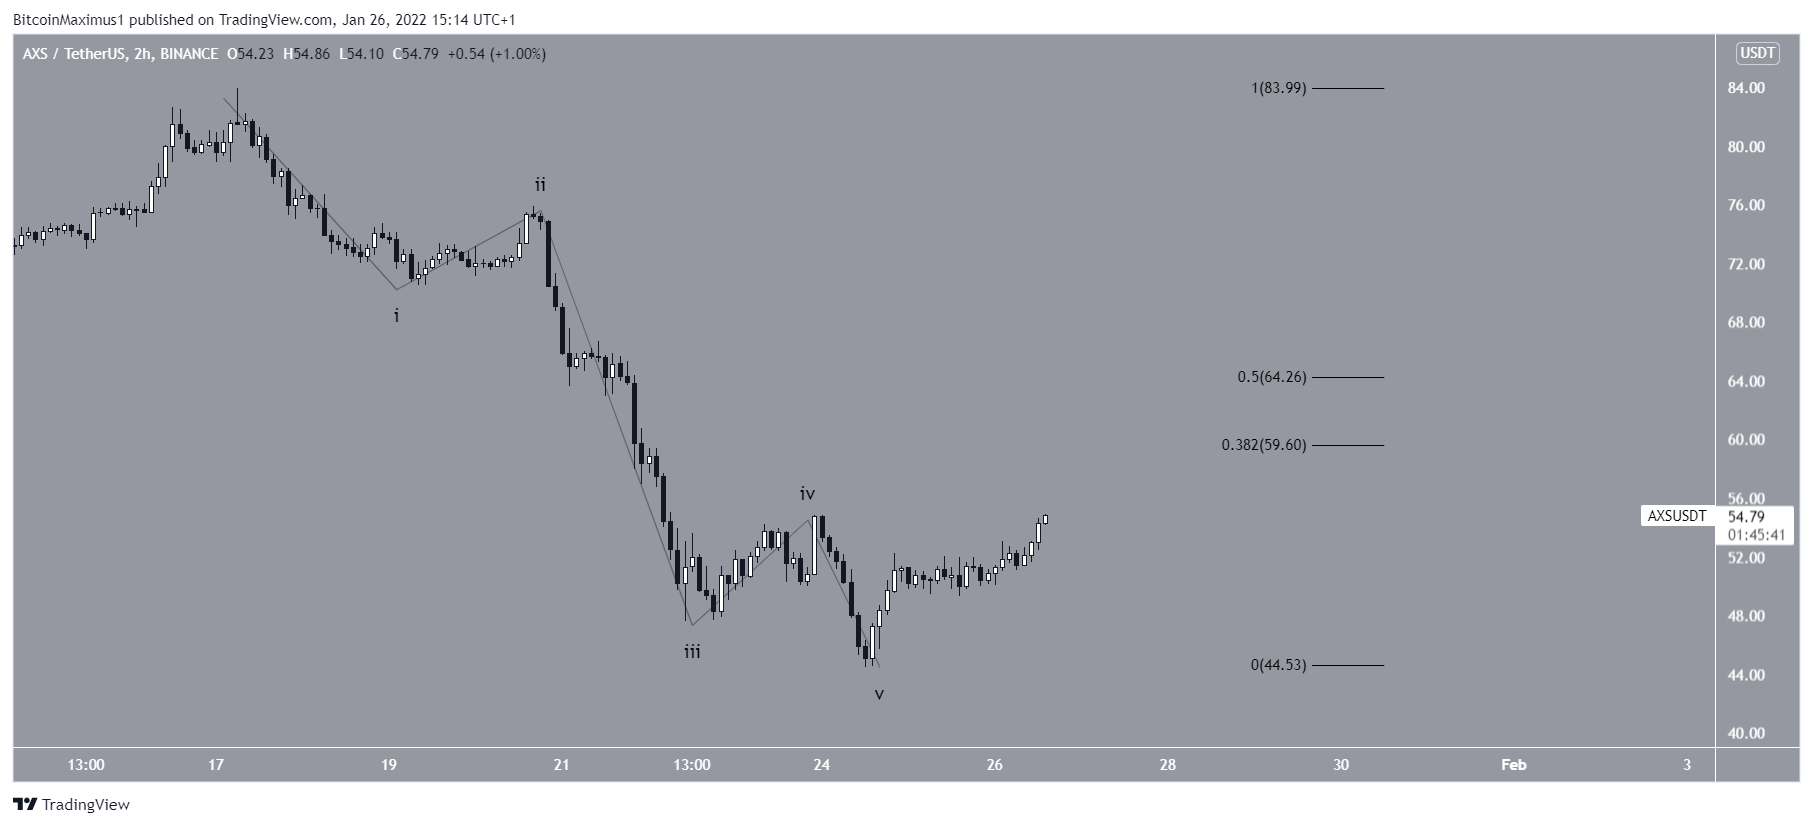
The two-hour chart shows that AXS has completed a five wave downward movement that began on Jan 17. Therefore, a considerable bounce is expected.
The closest resistance levels are between $59.6 and $64.2. They are created by the 0.382 – 0.5 Fib retracement resistance region. The latter is also a horizontal resistance area, further increasing its significance.
Chart By TradingViewFor BeInCrypto’s latest Bitcoin (BTC) analysis, click here!
In adherence to the Trust Project guidelines, BeInCrypto is committed to unbiased, transparent reporting. This news article aims to provide accurate, timely information. However, readers are advised to verify facts independently and consult with a professional before making any decisions based on this content. Please note that our Terms and Conditions, Privacy Policy, and Disclaimers have been updated.
Valdrin discovered cryptocurrencies while he was getting his MSc in Financial Markets from the Barcelona School of Economics. Shortly after graduating, he began writing for several different cryptocurrency related websites as a freelancer before eventually taking on the role of BeInCrypto's Senior Analyst.
(I do not have a discord and will not contact you first there. Beware of scammers)