
Curve DAO Token (CRV) has been rejected by both a diagonal and horizontal resistance level. The trend cannot be considered bullish until the price breaks out.
CRV has been falling since reaching an all-time high price of $6.80 in Jan. The downward movement led to a low of $0.53 in June.
The price has been increasing since, reaching a high of $1.33 in July. However, it was rejected by the $1.30 horizontal resistance area (red icon). This is a crucial resistance area since it had previously acted as support since May 2021. So, its reclaim is mandatory in order for the trend to be considered bullish.
Conversely, if the rejection continues, the closest support would be at $0.50.
The weekly RSI is increasing but is still below 50, failing to confirm the direction of the trend.
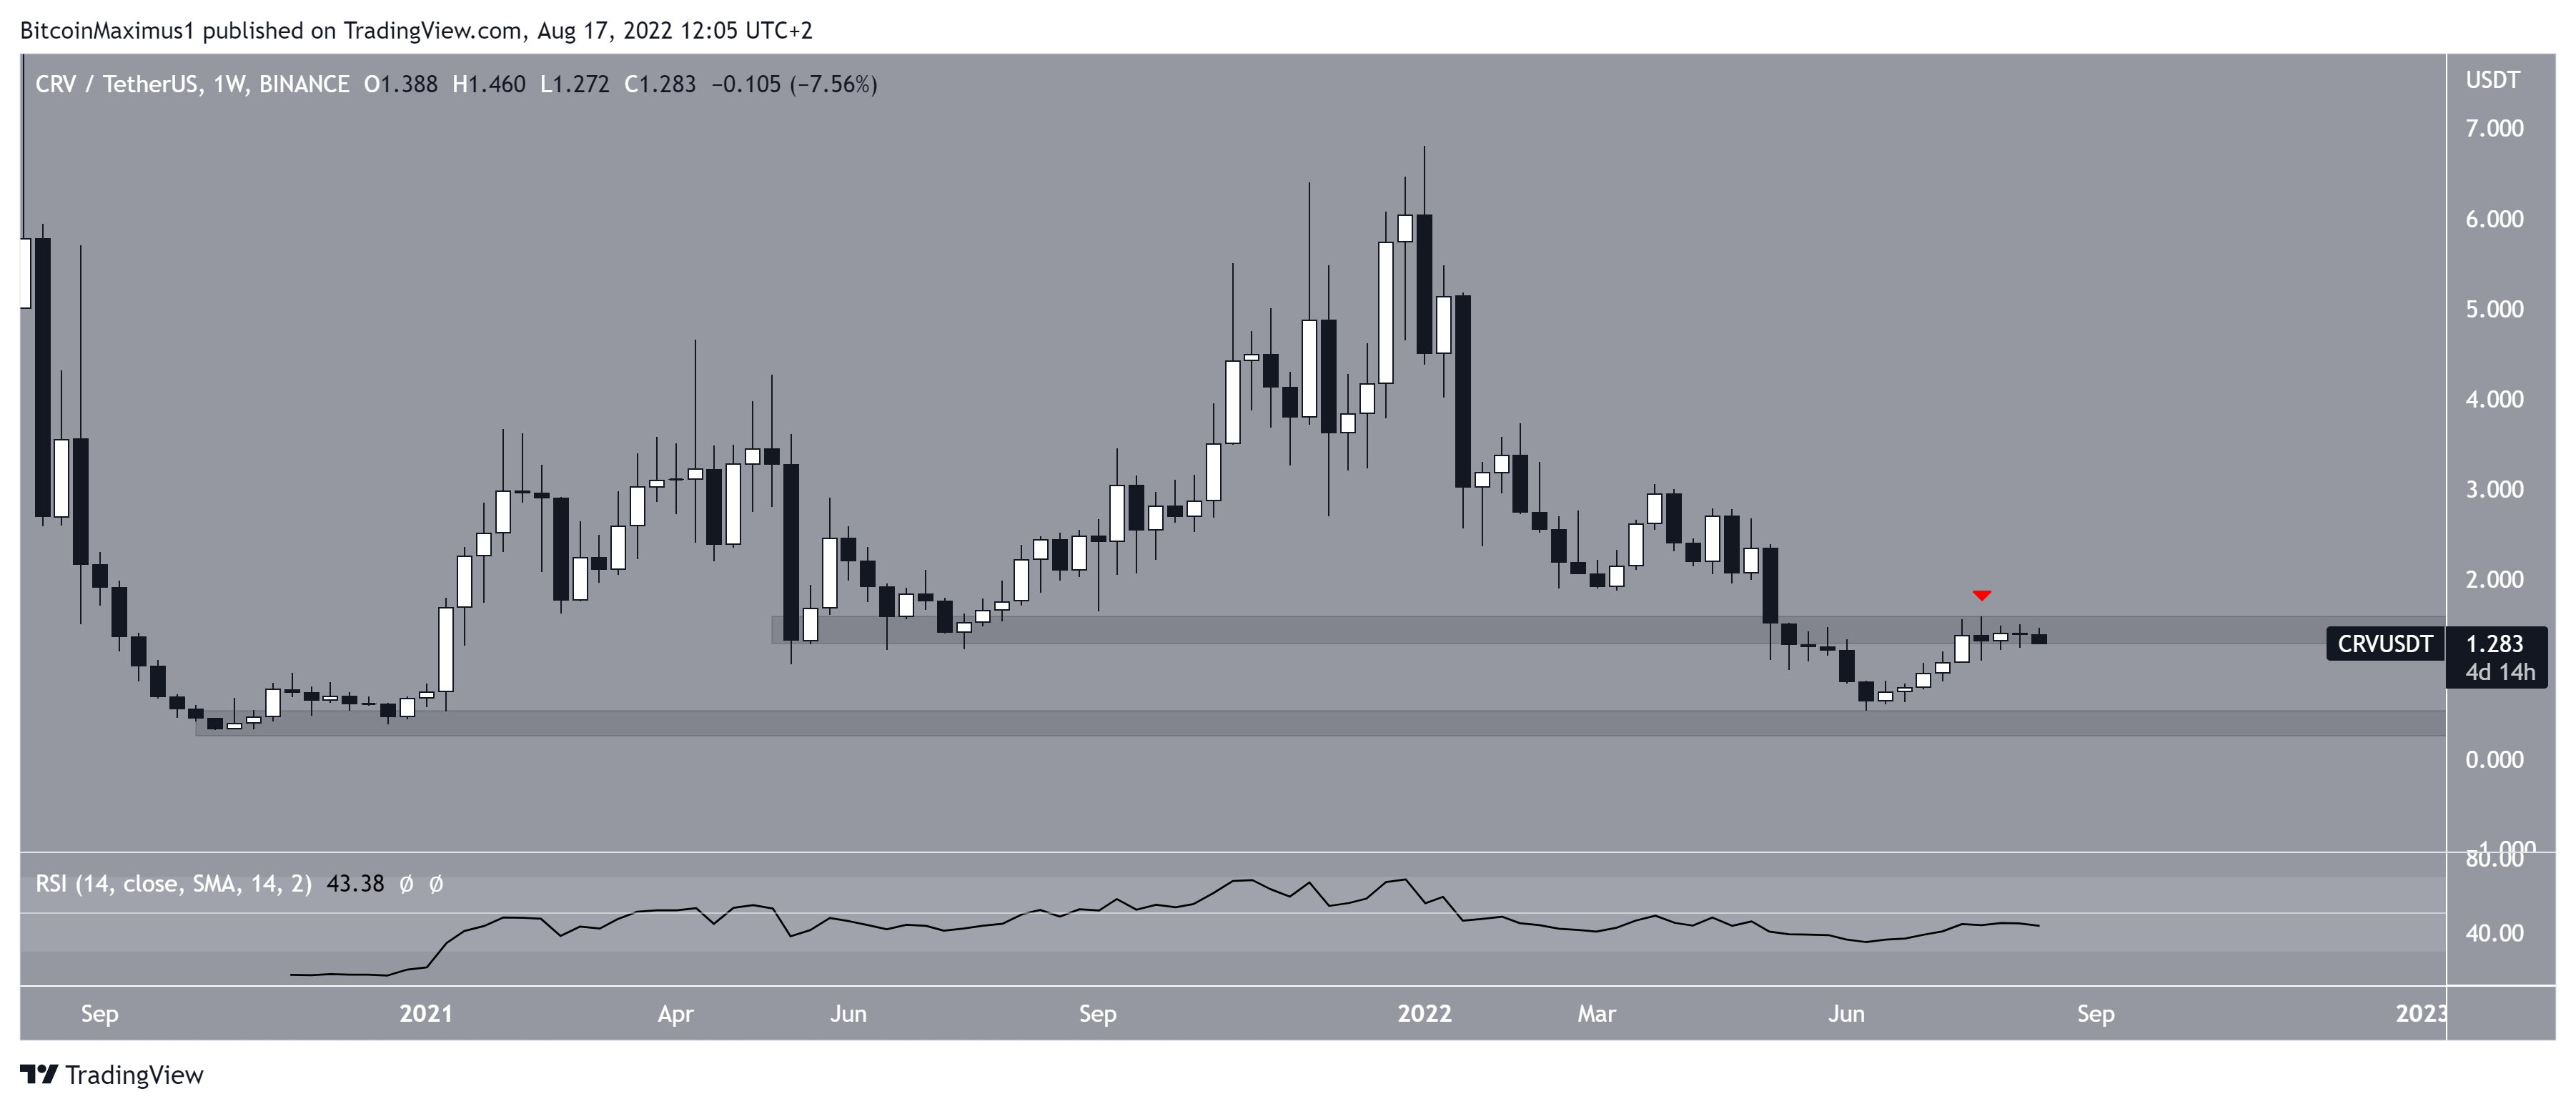
Current CRV resistance
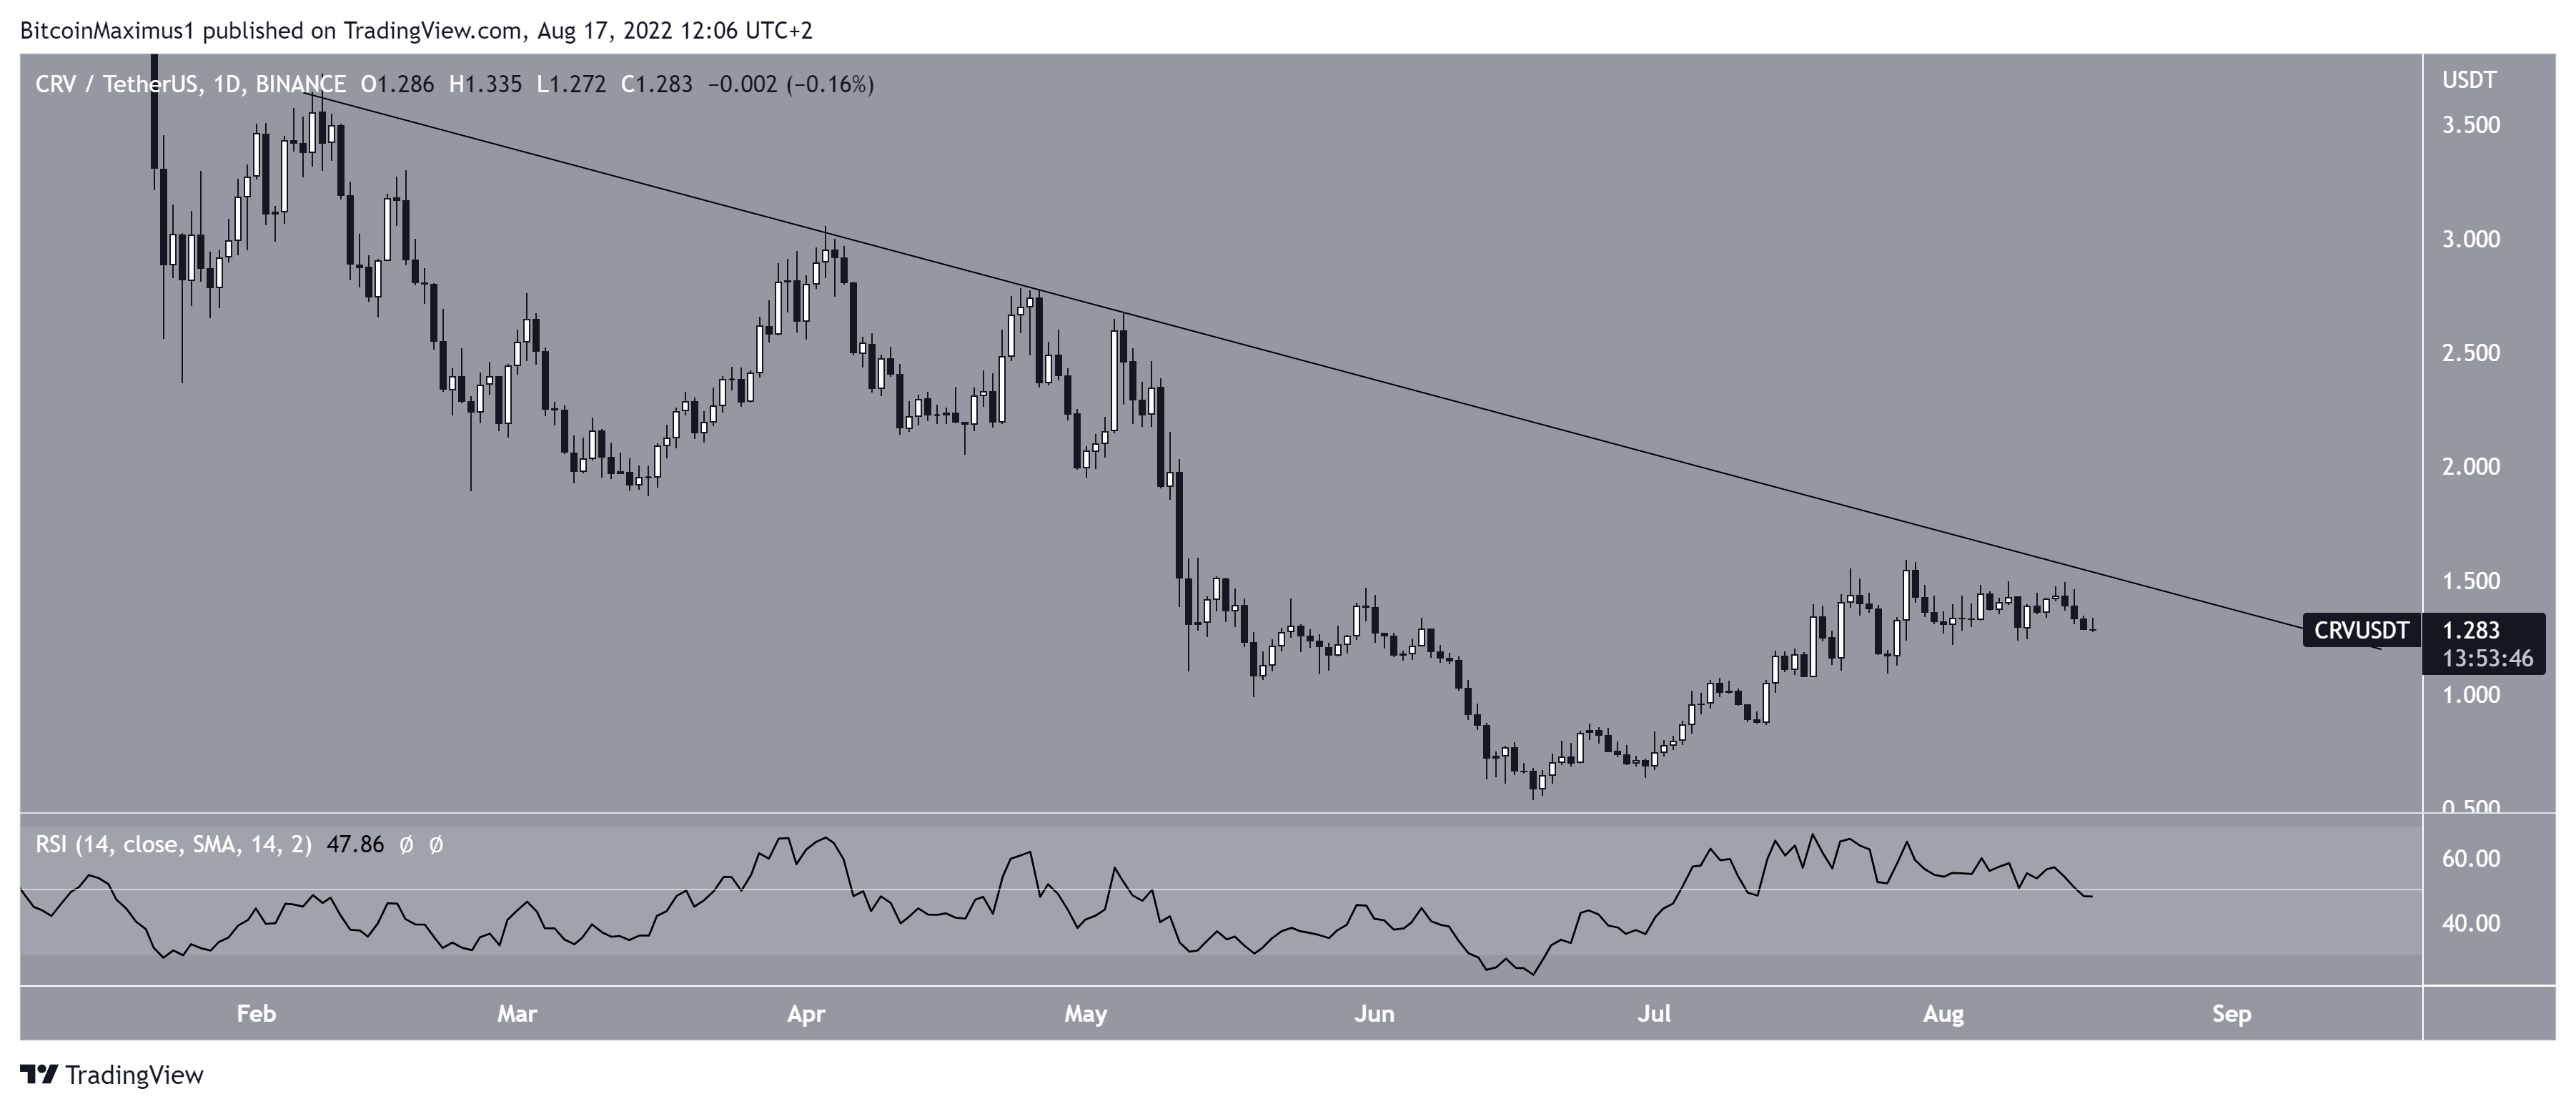
The daily chart shows that the price is still following a descending resistance line, which has been in place since Feb. The ongoing increase has failed to cause a breakout above it.
Moreover, the daily RSI is freely moving above and below 50. So, similarly to the weekly time frame, it fails to determine the direction of the trend.
Therefore, the weekly and daily time frames are not sufficient to determine if CRV will break out or be rejected instead.
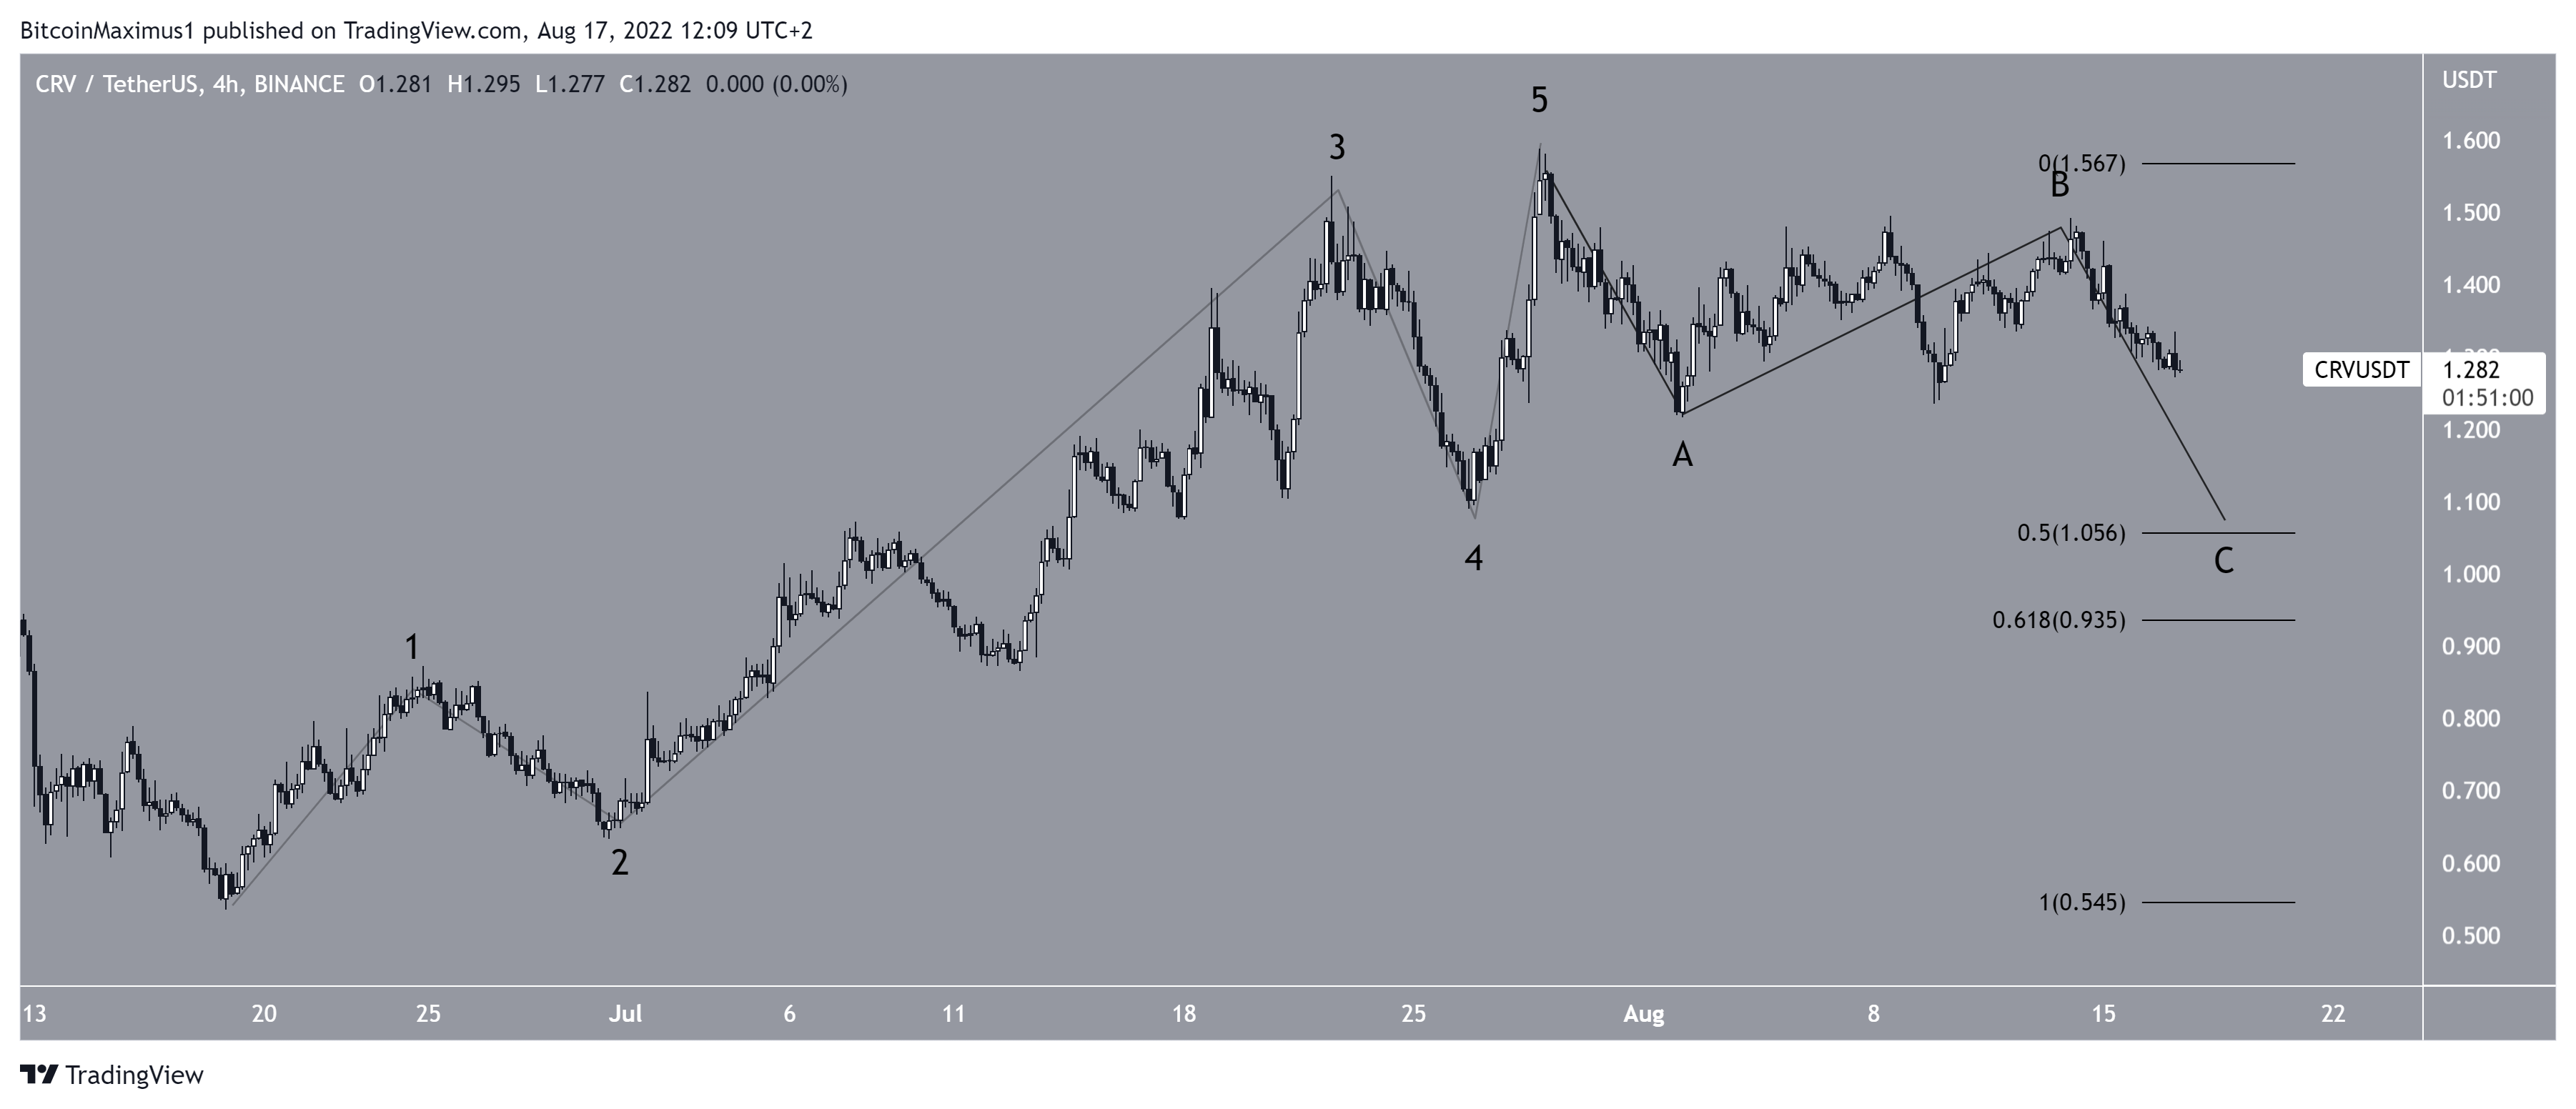
Wave count analysis
Cryptocurrency trader @Thetradinghubb tweeted a chart of CRV, stating that the price has completed a short-term flat corrective structure.
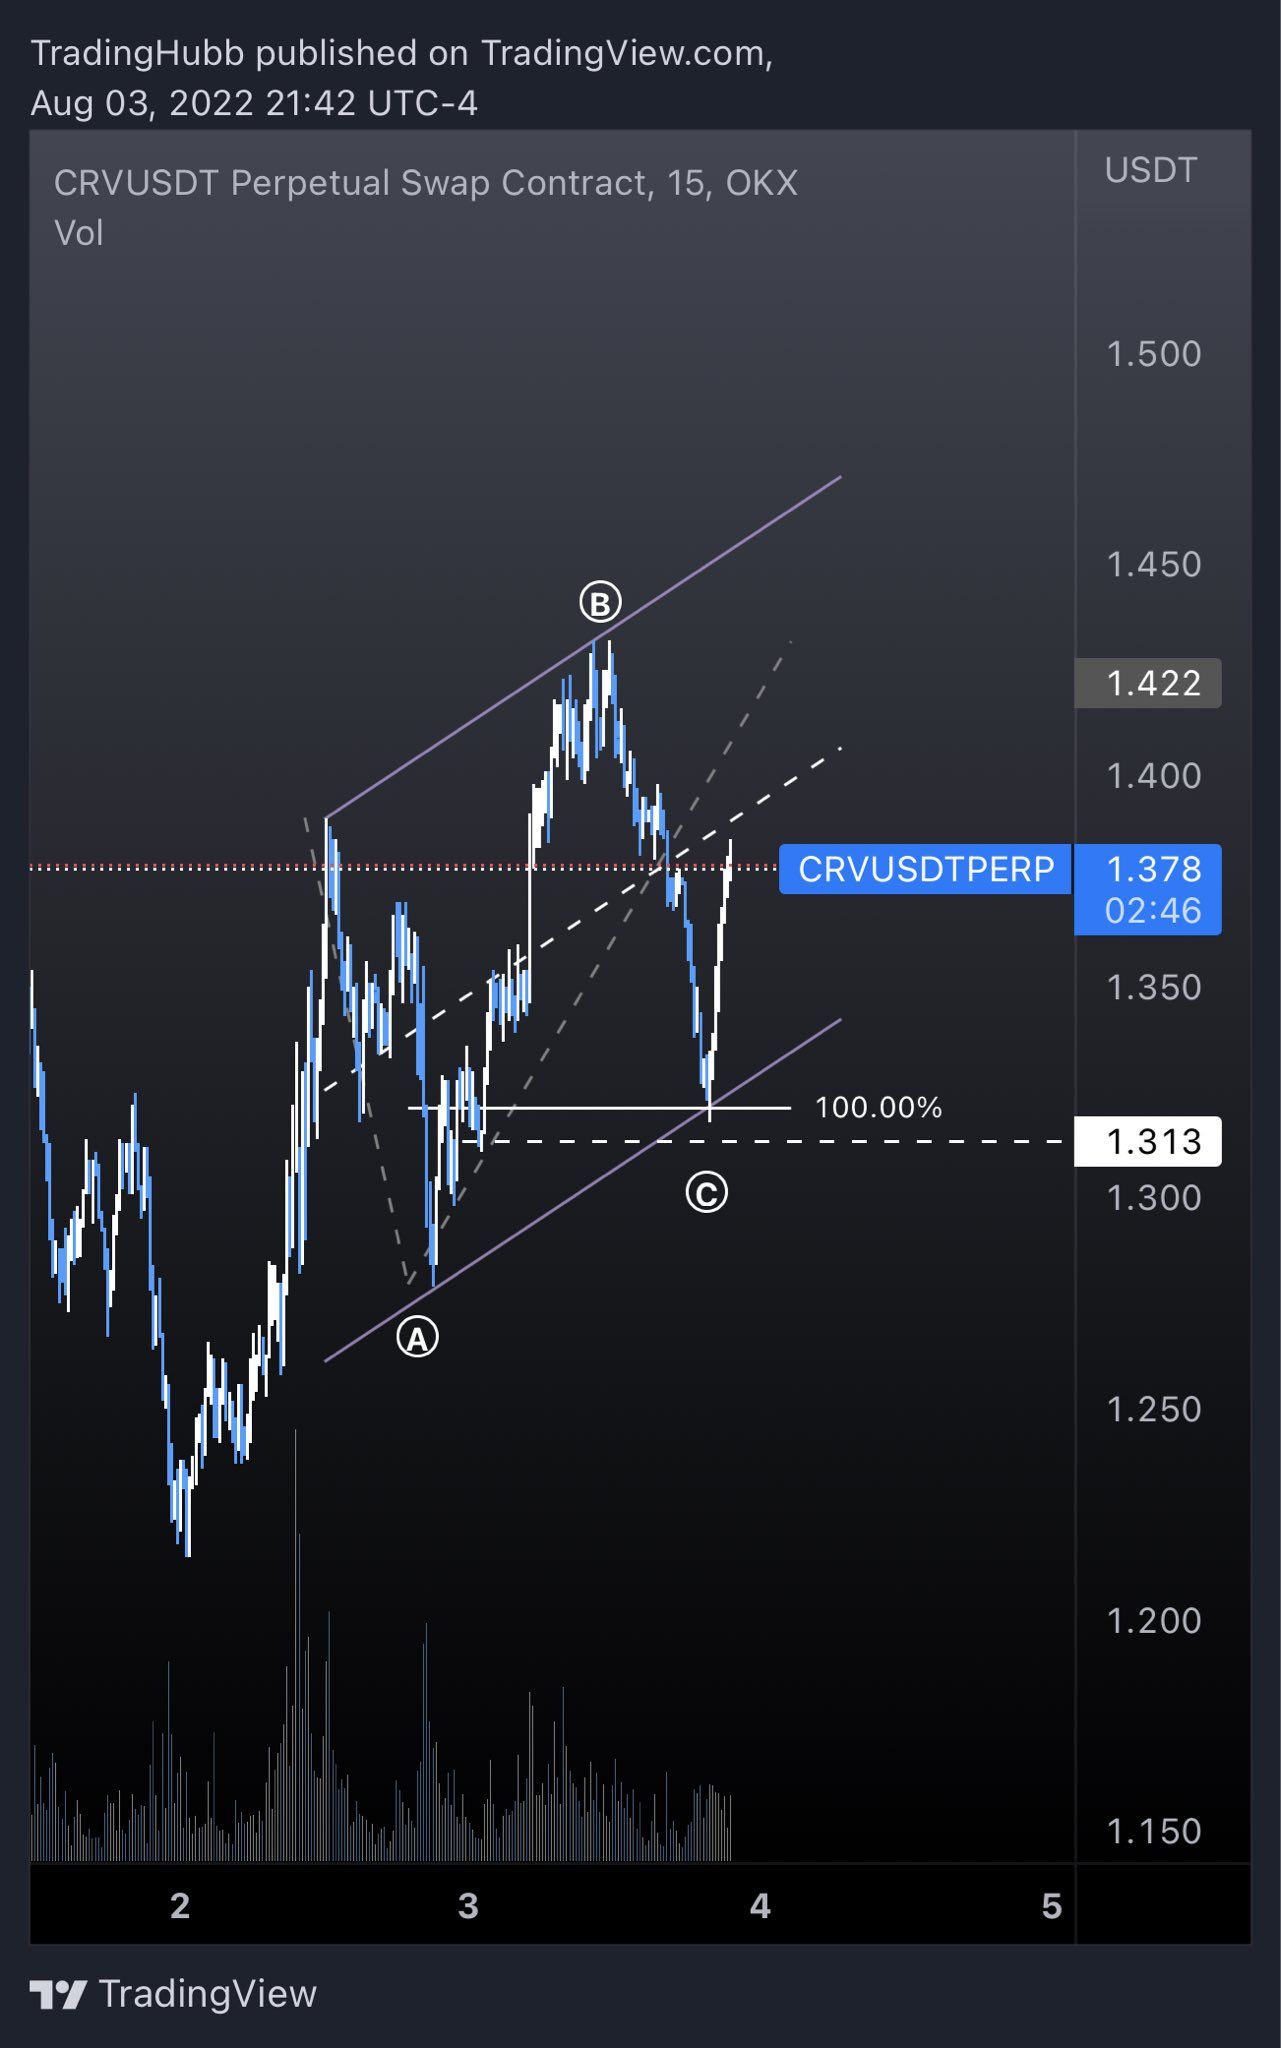
However, it seems that CRV is still mired in an A-B-C corrective structure (black), currently being in the C wave. The most likely target for the bottom of the movement would be at $1.05, created by the 0.5 Fib retracement resistance level. Moreover, this would give waves A:C a 1:1 ratio.
So, the combination of the weekly, daily and six-hour time frames indicates that the most likely scenario is a short-term drop followed by an upward movement that eventually causes a breakout above the $1.30 area.
For Be[in]Crypto’s latest Bitcoin (BTC) analysis, click here
Disclaimer
In line with the Trust Project guidelines, this price analysis article is for informational purposes only and should not be considered financial or investment advice. BeInCrypto is committed to accurate, unbiased reporting, but market conditions are subject to change without notice. Always conduct your own research and consult with a professional before making any financial decisions. Please note that our Terms and Conditions, Privacy Policy, and Disclaimers have been updated.
