

Despite several attempts at doing so, the Bitcoin (BTC) price has struggled to break out above a significant resistance level at $7800.
With the upcoming block reward halving in May and the fact that central banks are printing money at an unprecedented rate, this is a very interesting time for Bitcoin.
In this article, we will analyze 10 coins individually and determine their expected future movements.
Bitcoin (BTC)
The Bitcoin price is trading inside an ascending channel and has been doing so since April 23. At the time of writing, it was trading slightly above the midpoint (EQ) of this range. This level is also supported by the 50-hour moving average (MA). As long as the BTC price continues trading above this level, it is expected to reach the resistance line of the channel once more and, possibly, break out. If Bitcoin breaks out from this channel, it could reach highs of $8000, which is a longer-term resistance level — strengthened by the 200-day MA.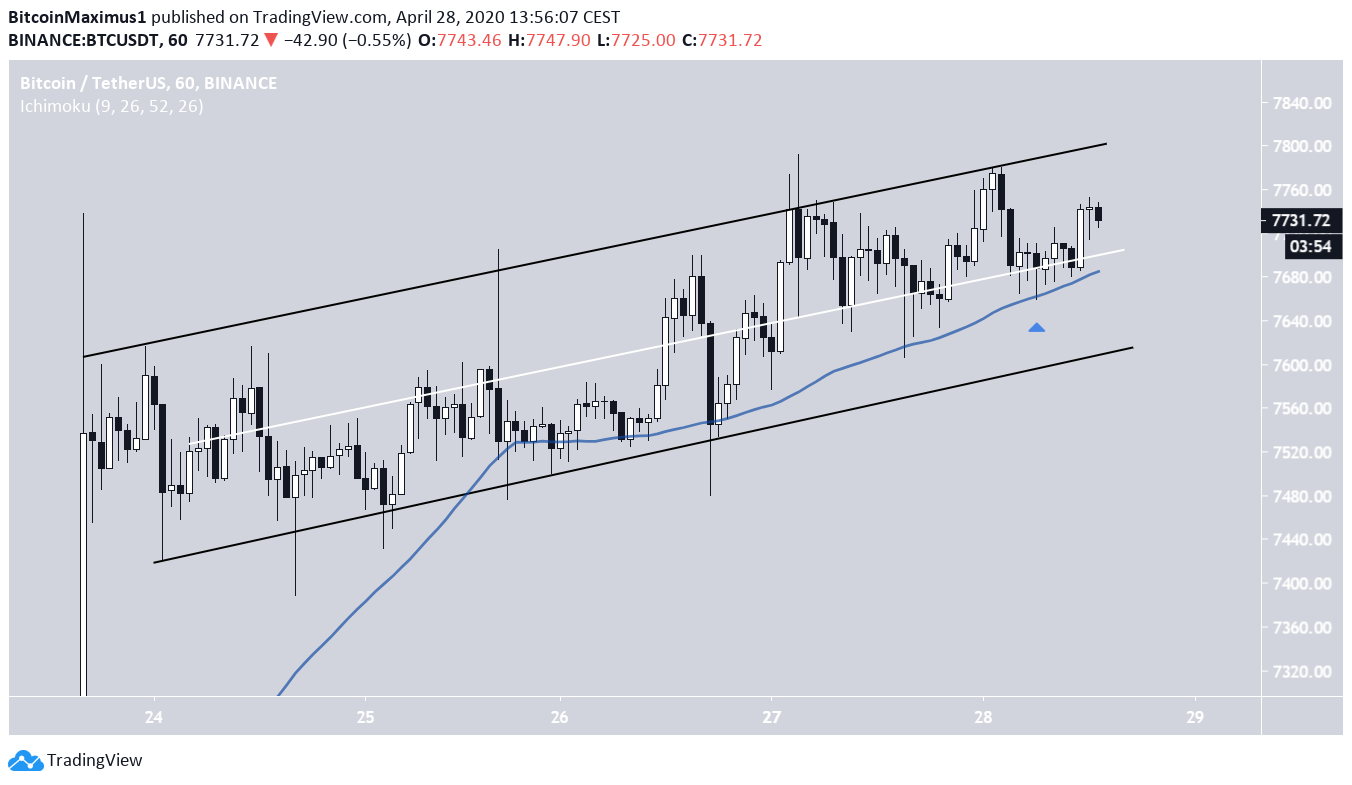
Ethereum (ETH)
The Ethereum price broke out from a long-term descending resistance line on April 16 and has been increasing since. The increase has taken the price all the way to a high of ₿0.026, which was reached on April 18. Ethereum has been gradually decreasing since. The price has been trading inside a symmetrical triangle. Even though this is considered a neutral pattern, the fact that it is transpiring after an upward move makes it more likely that it will act as a continuation pattern — causing a price breakout. If the ETH price breaks out, it is likely to reach the next resistance area, found at ₿0.027.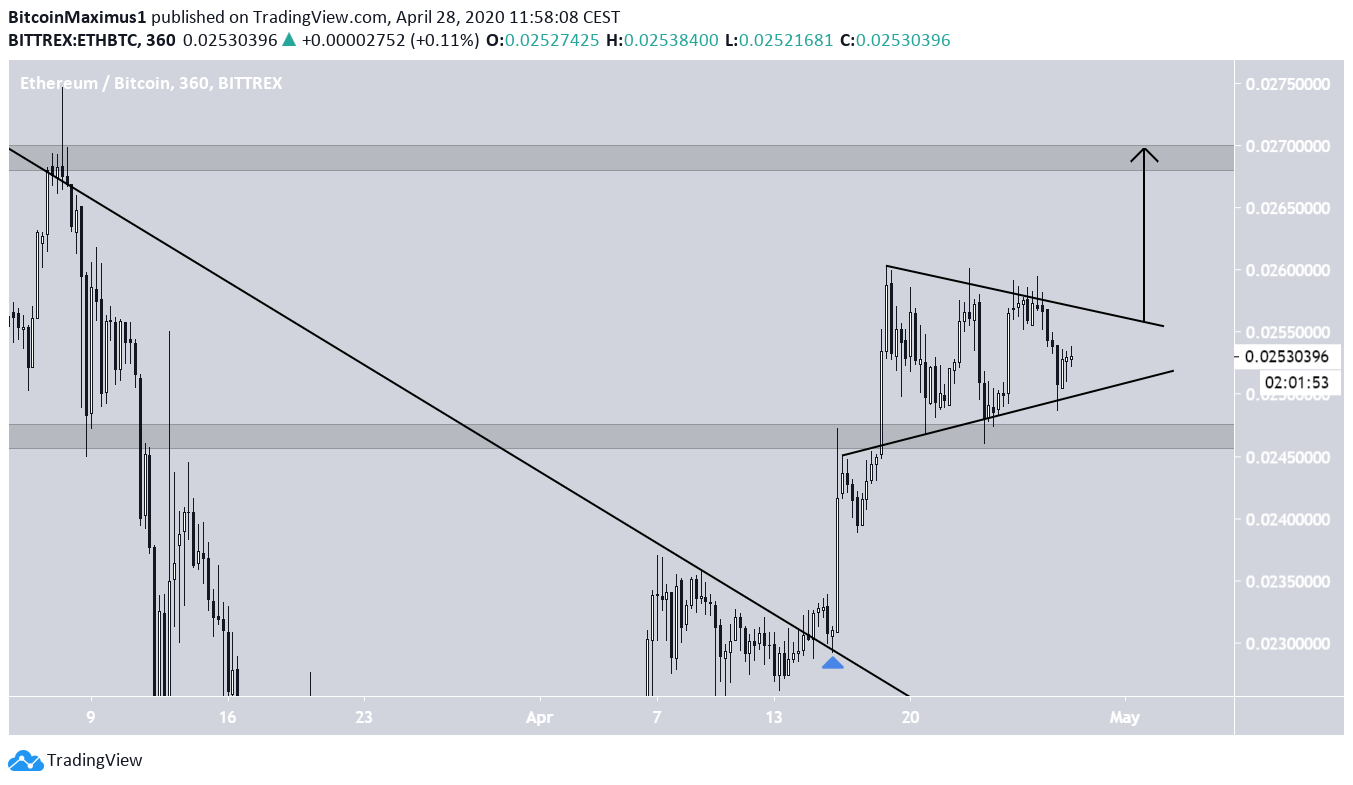
XRP (XRP)
The XRP price has been decreasing since February 17, following a descending resistance line. The price is not following any support lines but there is a support area at 2550 satoshis. Once the price has reached this area, it has begun upward moves towards the resistance line. Due to the fact that the line is descending, each upward move has been weaker than the previous one — thereby creating numerous lower highs. The price reached this support area once more on April 28 and began another upward move. The move was preceded by bullish divergence in the RSI. At the time of writing, the XRP price had reached the 25-day moving average (MA), which is providing resistance to the price. Until XRP breaks out above this descending resistance line, its price movement is considered bearish — and the price is expected to fall back to the 2550 satoshi support area once more.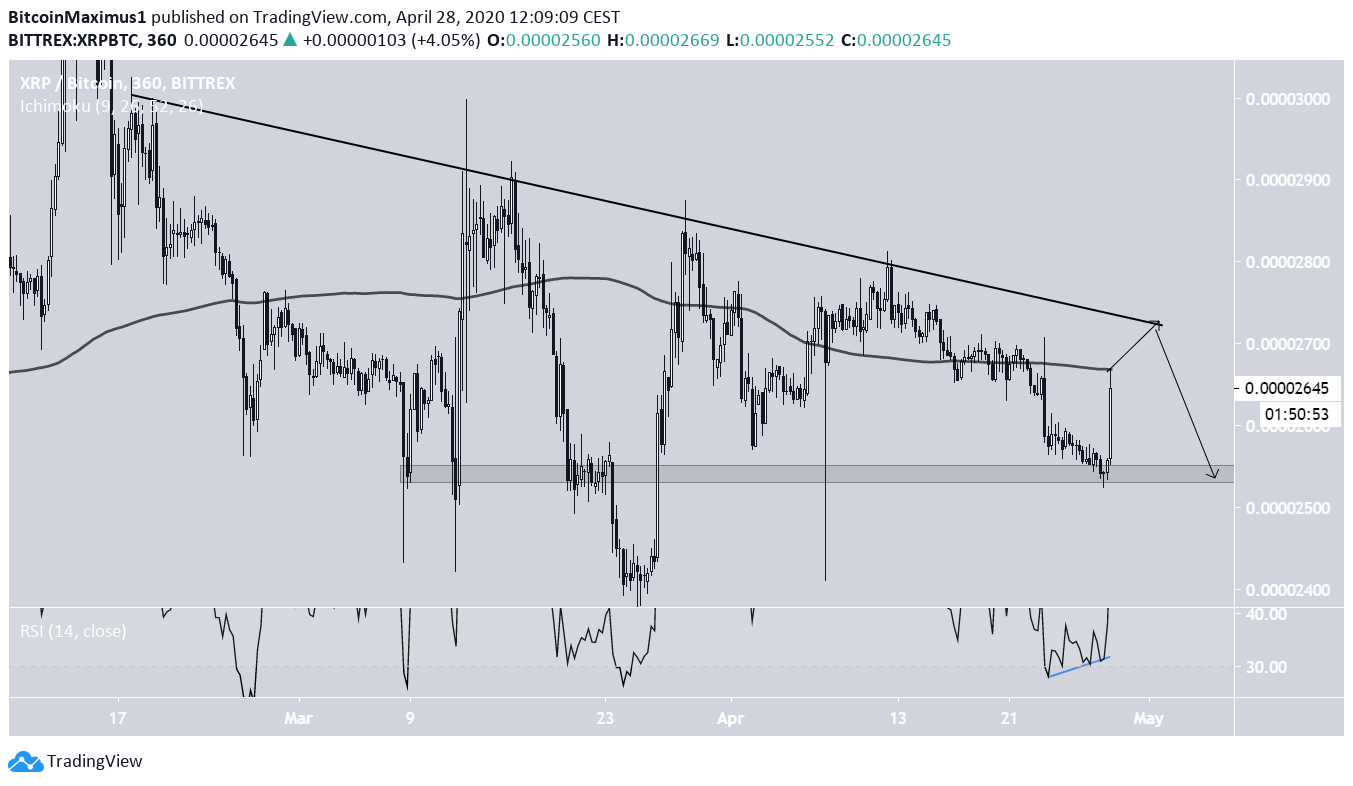
Bitcoin Cash (BCH)
The BCH price began an upward move on March 12 and put in a high of ₿0.0380. The price has been decreasing since. On April 13, the price reached the 0.618 Fib level of the entire move and began to create a descending wedge, which is considered a bullish reversal pattern. The breakout from this wedge was also supported by the developing bullish divergence. However, on April 27, the price broke down instead. At the time of writing, the price was trading between the 0.618 and 0.786 Fib levels — a likely level to initiate a reversal. However, due to the aforementioned breakdown, it would make more sense for the price to decrease all the way to ₿0.0281 and create a double bottom before possibly beginning another upward move.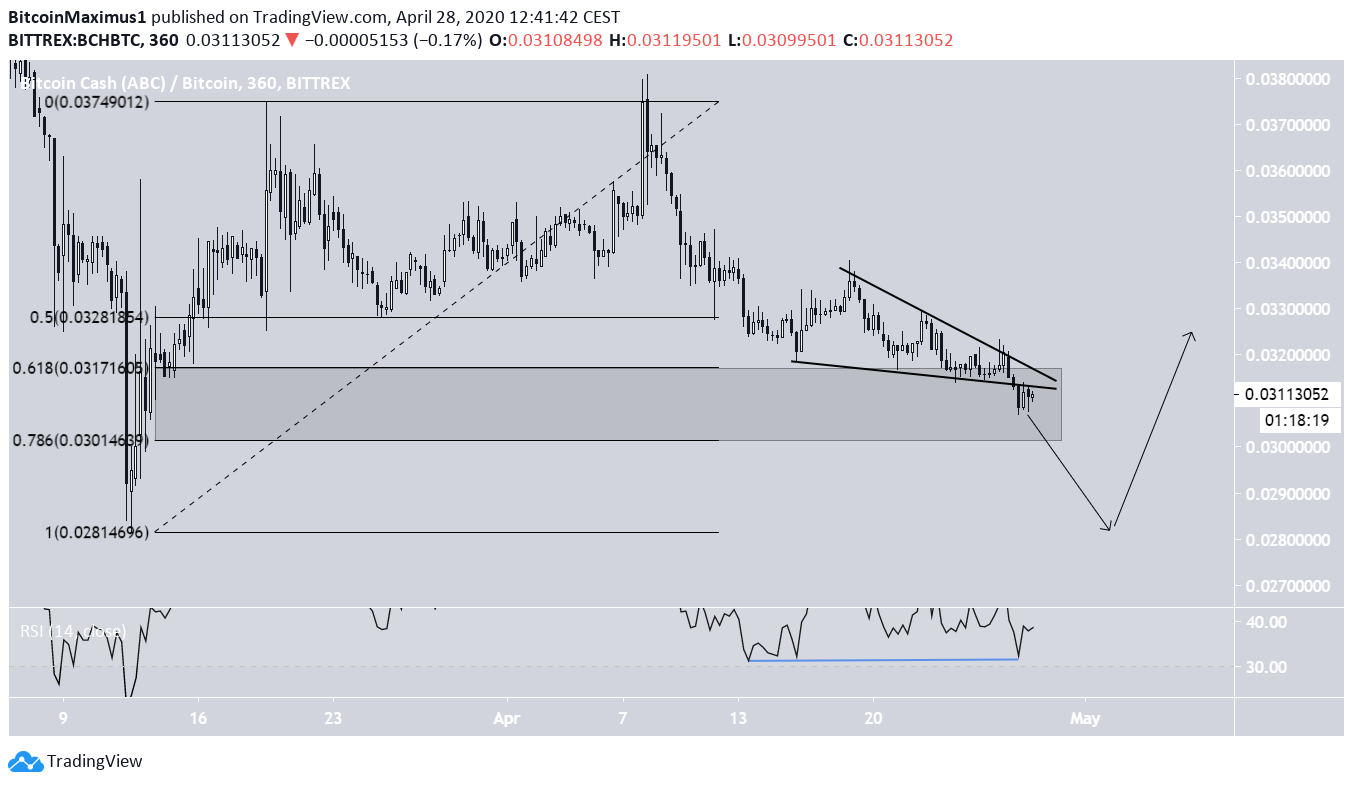
Bitcoin SV (BSV)
The BSV price had been following an ascending support line since December 2019, validating it numerous times. However, on April 24, the price broke down from this line and has been decreasing since. The breakout was also supported by an RSI decrease below a 50 line, a sign that the prevailing trend is bearish. The closest support area is found at ₿0.0210, a level also supported by the 200-day moving average. Therefore, the BSV price is expected to decrease until it reaches this level and then possibly begin an upward move.
Litecoin (LTC)
The Litecoin price is trading inside a descending channel and has been doing so since April 11. The price reached the support line of the channel along with the ₿0.0057 support area twice, the first time in the form of a lower wick, before initiating an upward bounce that is still ongoing. This movement was preceded by bullish divergence in the RSI. Combining this with the fact that the price is trading inside an area that is suitable to initiate a reversal, it is likely that the LTC price does so and, initially, moves towards the resistance line of the channel. If the price breaks out, it is expected to reach the closest resistance area, which is found at ₿0.0064.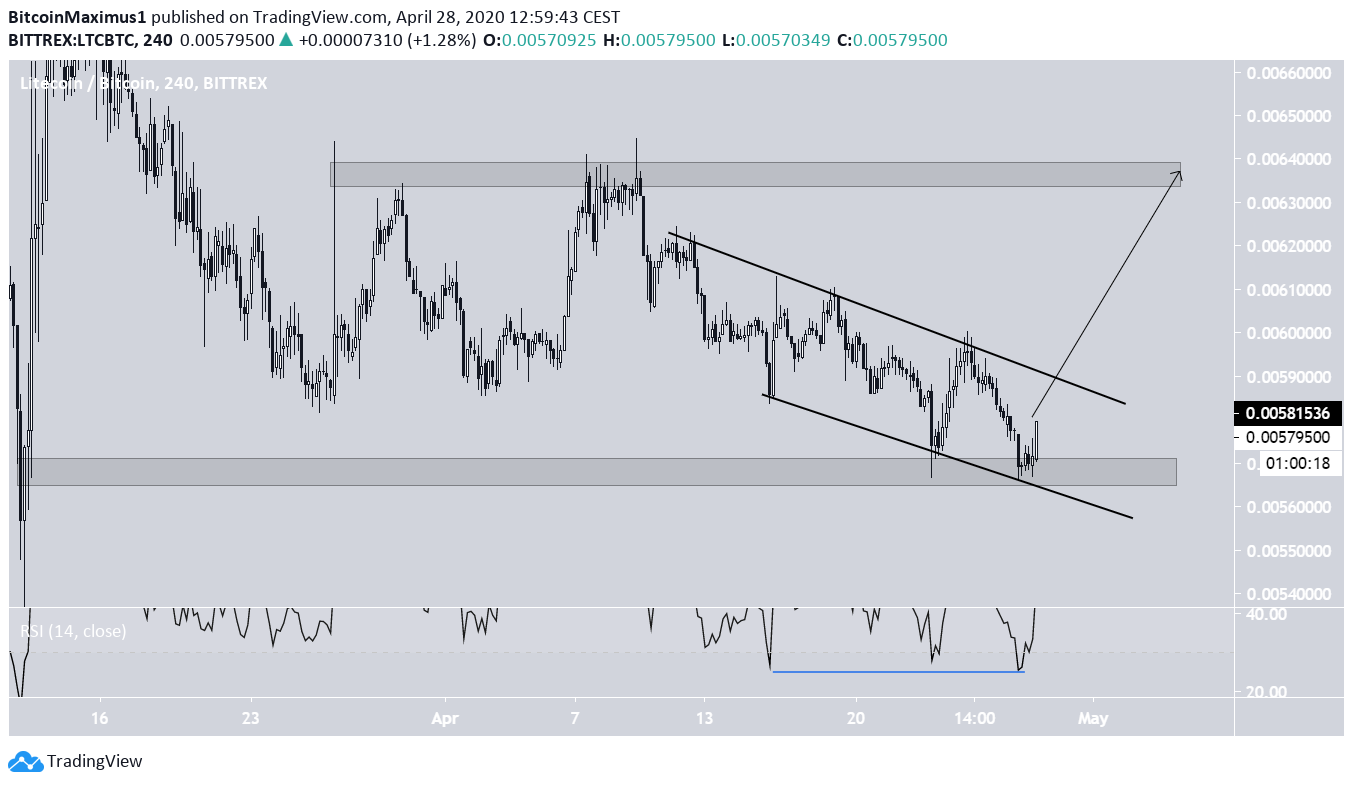
Binance Coin (BNB)
The Binance Coin price had been following an ascending support line beginning on March 13. However, the price broke down from this line on April 24 and validated it as resistance two days later. This is a bearish sign that very often is followed by a downward move. If the price continues to decrease, as is expected, the closest support area is found at ₿0.002 — an area that previously acted as resistance near the end of March and, afterward, as support at the beginning of April.
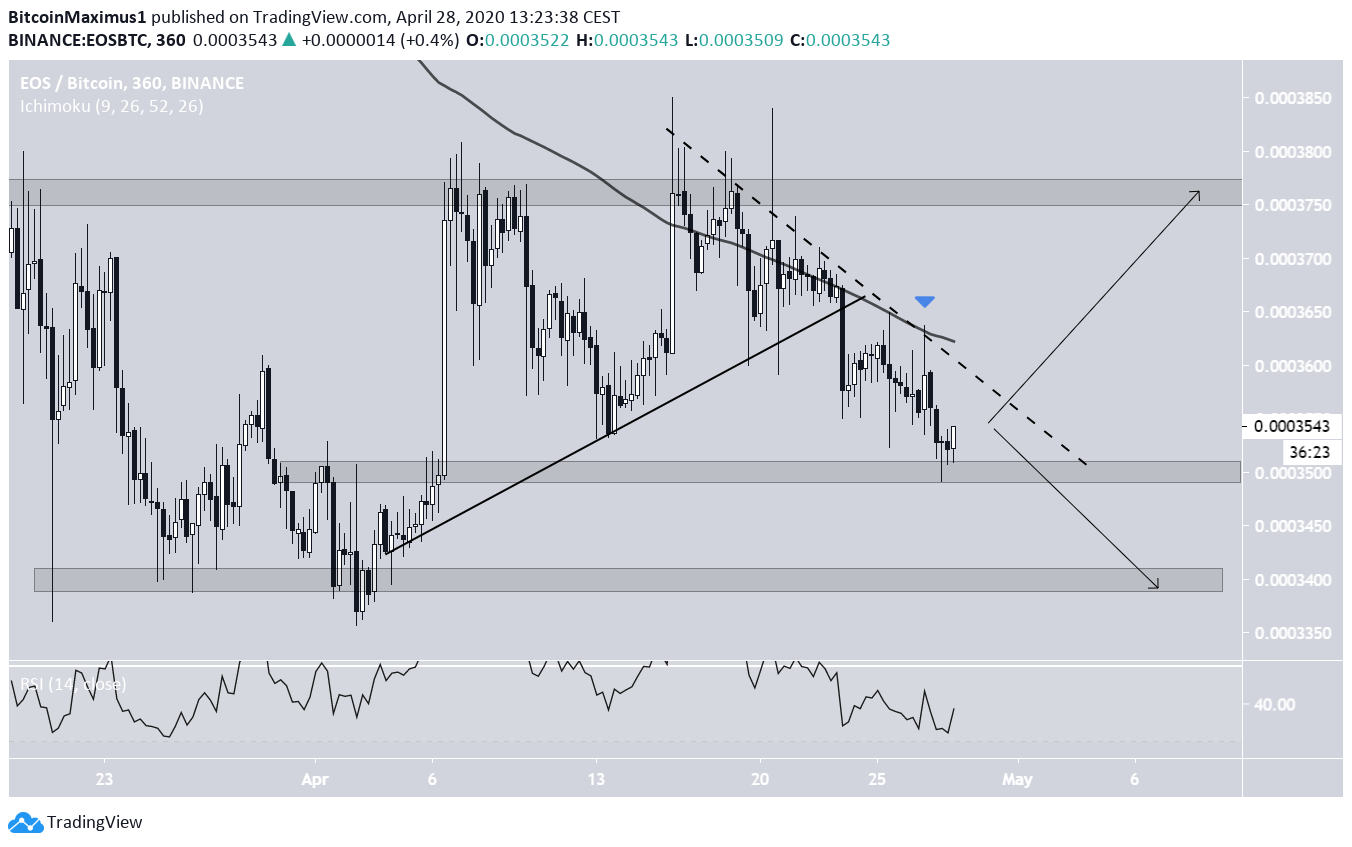
EOS (EOS)
The EOS price had been trading inside a symmetrical triangle since April 5. The price broke down from this triangle on April 23 and has been decreasing since. Even after the breakdown, the resistance line of the triangle is still valid, having rejected the price twice more since. In addition, this line is supported by the 25-day MA, which is also offering resistance to the price. There are two possible movements from here:- First, a breakout above the resistance line that takes the price towards the resistance area of 3750 satoshis. While this is possible, there is no bullish divergence in development that would indicate a trend reversal. Additionally, there is a strong resistance above the current price.
- Second, a decrease towards the closest support area at 3400 satoshis is possivle. Due to the reasons mentioned above, this seems more likely.
Tezos (XTZ)
On April 26, the TXZ price reached a high of 37,920 satoshis. This created a double top relative to the all-time high price on February 20. Besides being a bearish reversal pattern, the double top is also combined with a bearish divergence in the RSI, making a breakdown likely. This possibility is also supported by the fact that the upward move that began on April 6 has been parabolic, which is unsustainable in the long-run. If the price begins to decrease, which is expected, it could find support at the 25,000 satoshi support area, which is also strengthened by the presence of the 200-day MA. Prior to this, there is a minor support area at 28,500, which could initiate a slight upward bounce. However, due to the long-term bearish pattern and divergence, it would make more sense for the price to decrease all the way to a major support area, as is the 25,000 satoshi one.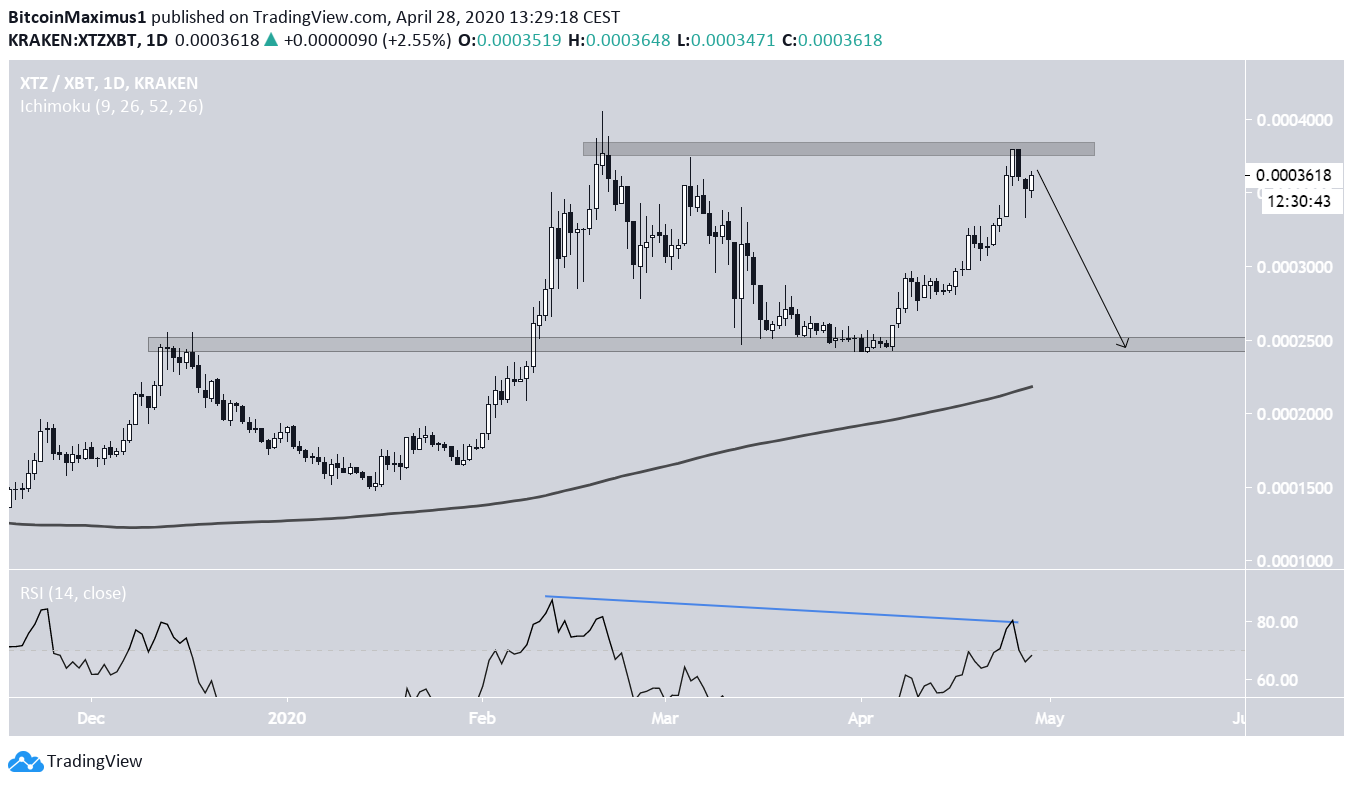
Chainlink (LINK)
The LINK price had been trading inside an ascending wedge since April 7. After reaching a high of 52,600 on April 19, the price began to decrease and broke down from the wedge afterward. The closest support area is found at 44,000 satoshis, possibly strengthened by the presence of the 25-day MA, which is slightly below this support level. While the RSI is oversold, it has yet to generate any type of bullish divergence. Therefore, it is expected that the price will decrease all the way to this area, after possibly validating previous support area at 49,000 satoshis as resistance.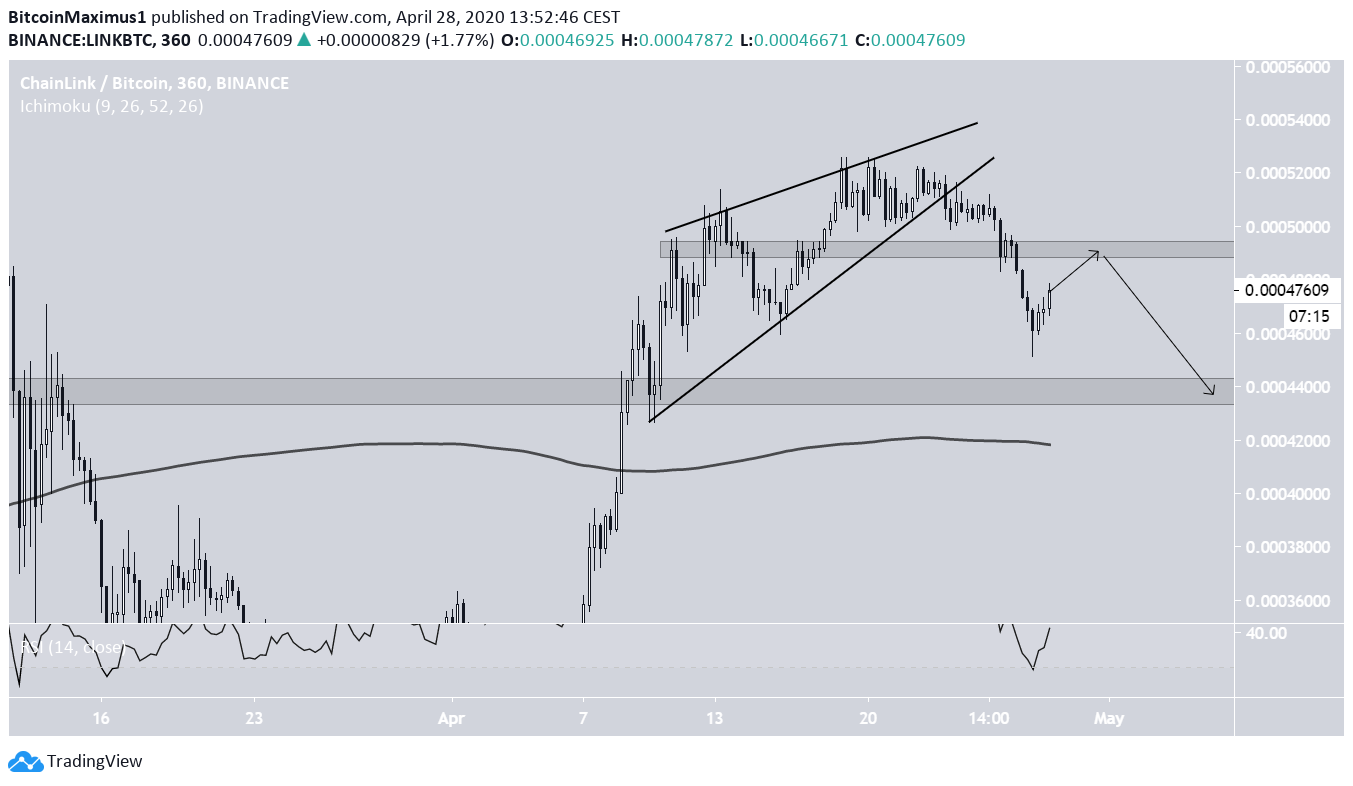
Top crypto projects in the US | April 2024
Trusted
Disclaimer
In line with the Trust Project guidelines, this price analysis article is for informational purposes only and should not be considered financial or investment advice. BeInCrypto is committed to accurate, unbiased reporting, but market conditions are subject to change without notice. Always conduct your own research and consult with a professional before making any financial decisions. Please note that our Terms and Conditions, Privacy Policy, and Disclaimers have been updated.

Valdrin Tahiri
Valdrin discovered cryptocurrencies while he was getting his MSc in Financial Markets from the Barcelona School of Economics. Shortly after graduating, he began writing for several different cryptocurrency related websites as a freelancer before eventually taking on the role of BeInCrypto's Senior Analyst.
(I do not have a discord and will not contact you first there. Beware of scammers)
READ FULL BIO
Sponsored
Sponsored