
Merely hours after reaching a low of $6,480, the BTC price rallied significantly to reach a daily close of $7,101. Numerous altcoins followed suit, posting double-digit gains until the daily close.
Bitcoin (BTC)
At the time of writing, the BTC price was trading very close to the $7,150 resistance area. This area had previously acted as support but turned to resistance after the April 10 breakdown. The price initially validated it as resistance on April 12 and has now generated a double top inside this area.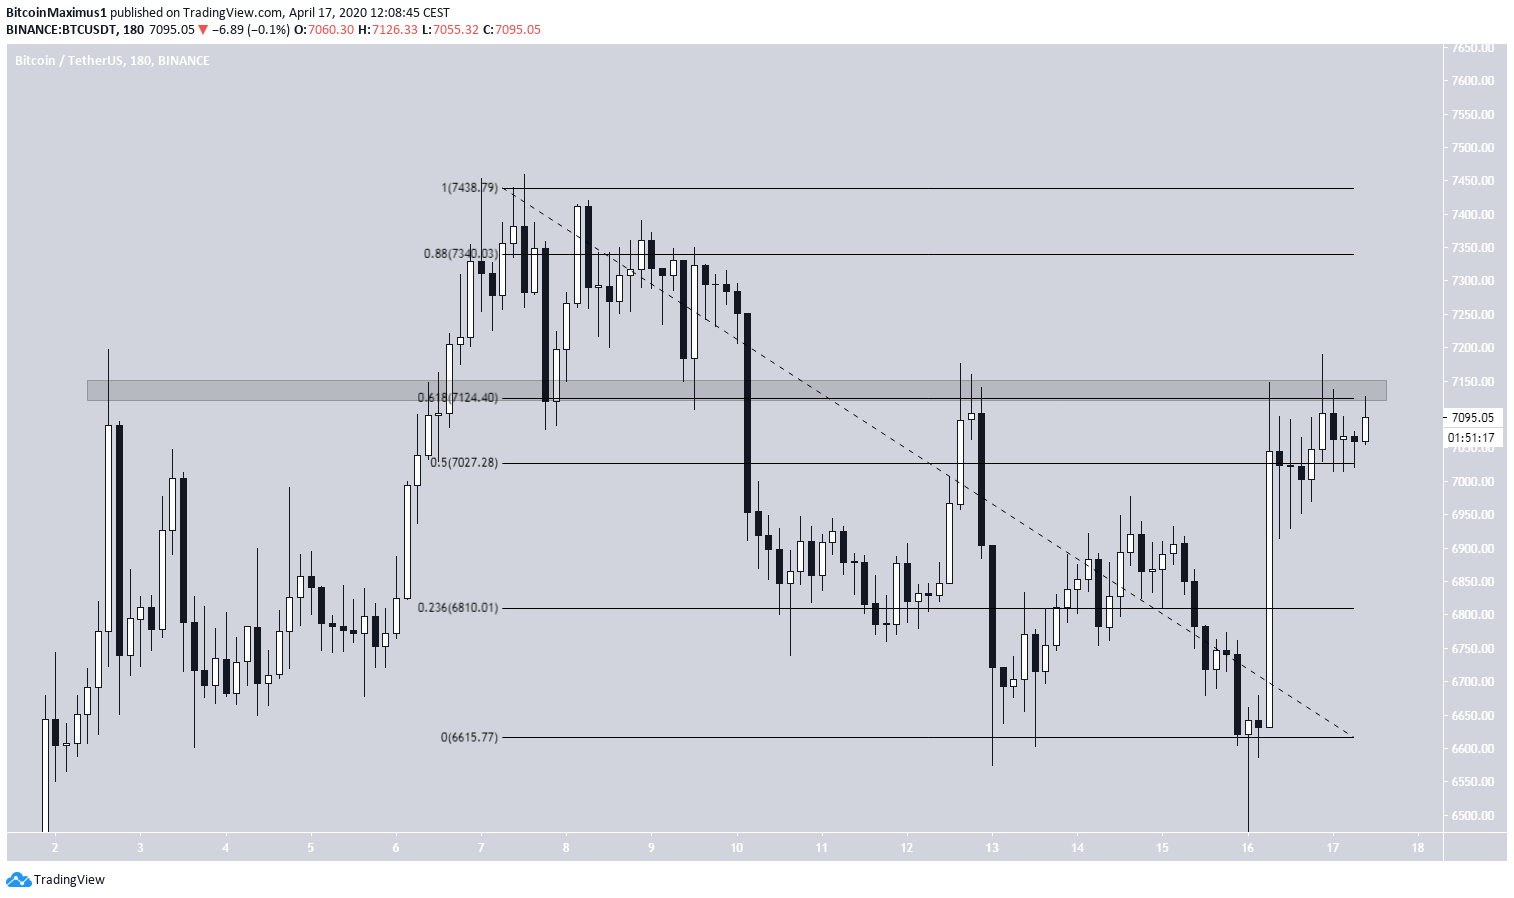
Verdict
The outlook is undetermined. A breakout above $7,150 would be bullish, while a rejection from this area would be bearish.Ethereum (ETH)
The Ethereum price has been moving upwards since March 13. The increase has taken the form of an ascending channel, both the resistance and support lines of which have been validated sufficient times.
Verdict
Ethereum is likely to decrease and validate the support line of the channel. At the time of writing, we cannot confidently predict a breakdown from the channel.XRP (XRP)
The XRP price has been following a descending resistance line since March 12. At the time of writing, the price was trading right at this resistance line, having validated it for the fourth time.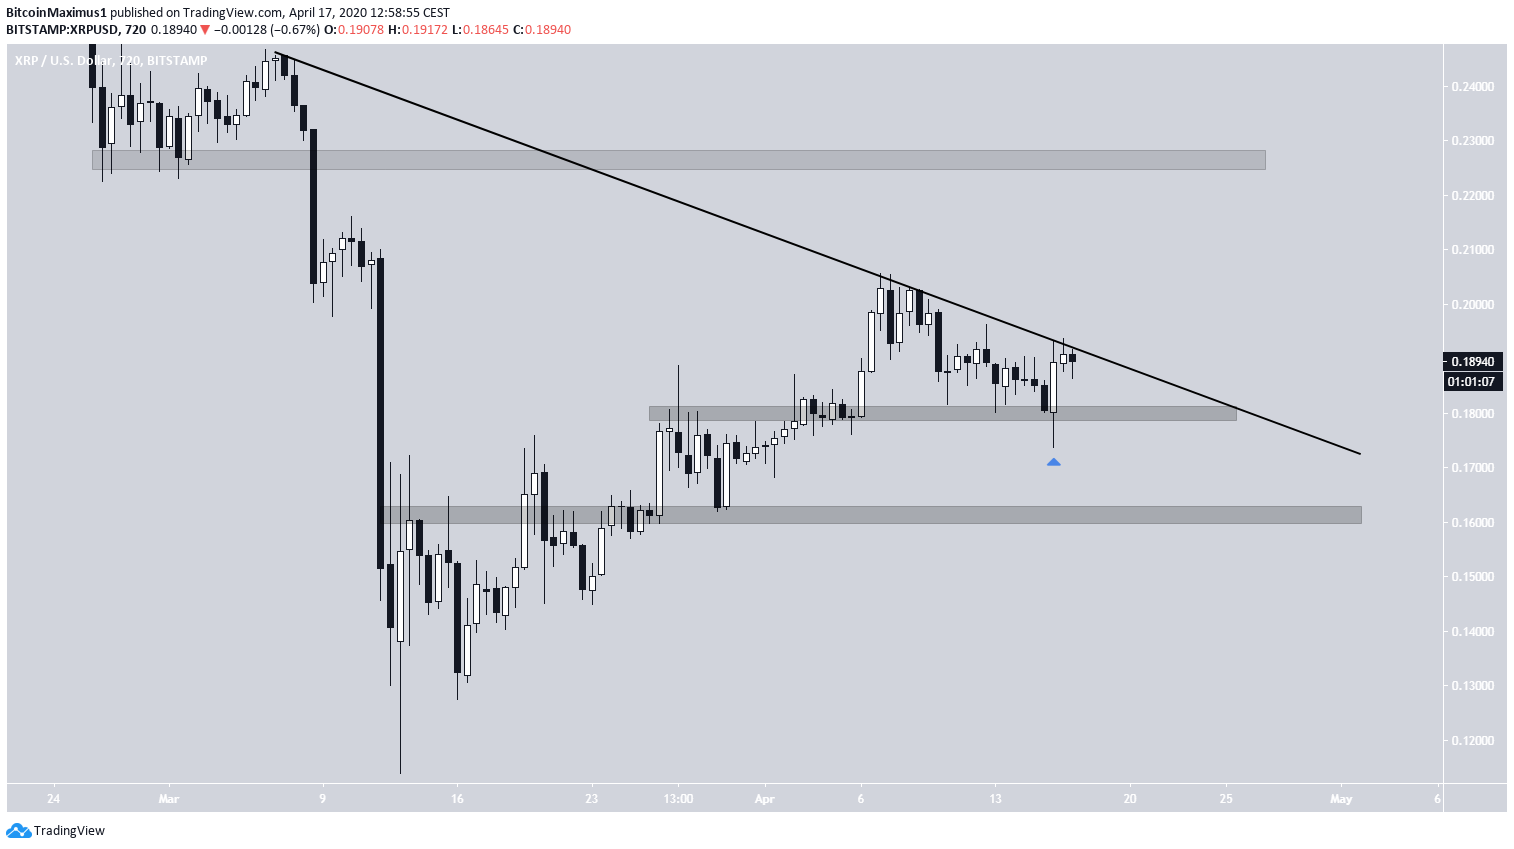
Verdict
Neutral outlook for XRP, until the price either breaks out above the descending resistance line or breaks down below the support area.Bitcoin Cash (BCH)
The BCH price has been following a descending support line since March 20. It reached this line on April 16 and immediately bounced upwards, beginning the current upward movement.
Verdict
The BCH price is expected to break down from the head and shoulders pattern and move towards the descending support line once more.Bitcoin SV (BSV)
The BSV price has been following a descending support line since Jan. 14. At the time of writing, the price was in the process of validating the line for the fourth time.
Verdict
BSV is expected to trade between the $175 support area and the descending resistance line. An eventual breakdown is slightly more likely due to the possibility of a drop in the price of BTC.Litecoin (LTC)
The LTC price is trading inside a steep descending channel and has been since April 8. The price has validated both the resistance and support lines thrice.
Verdict
The Litecoin price is expected to decrease towards the support line of the channel, which currently is at $37.Binance Coin (BNB)
The BNB chart shows that the price has been trading inside an ascending wedge since March 13. The price is quickly approaching the point of convergence between the resistance and support lines.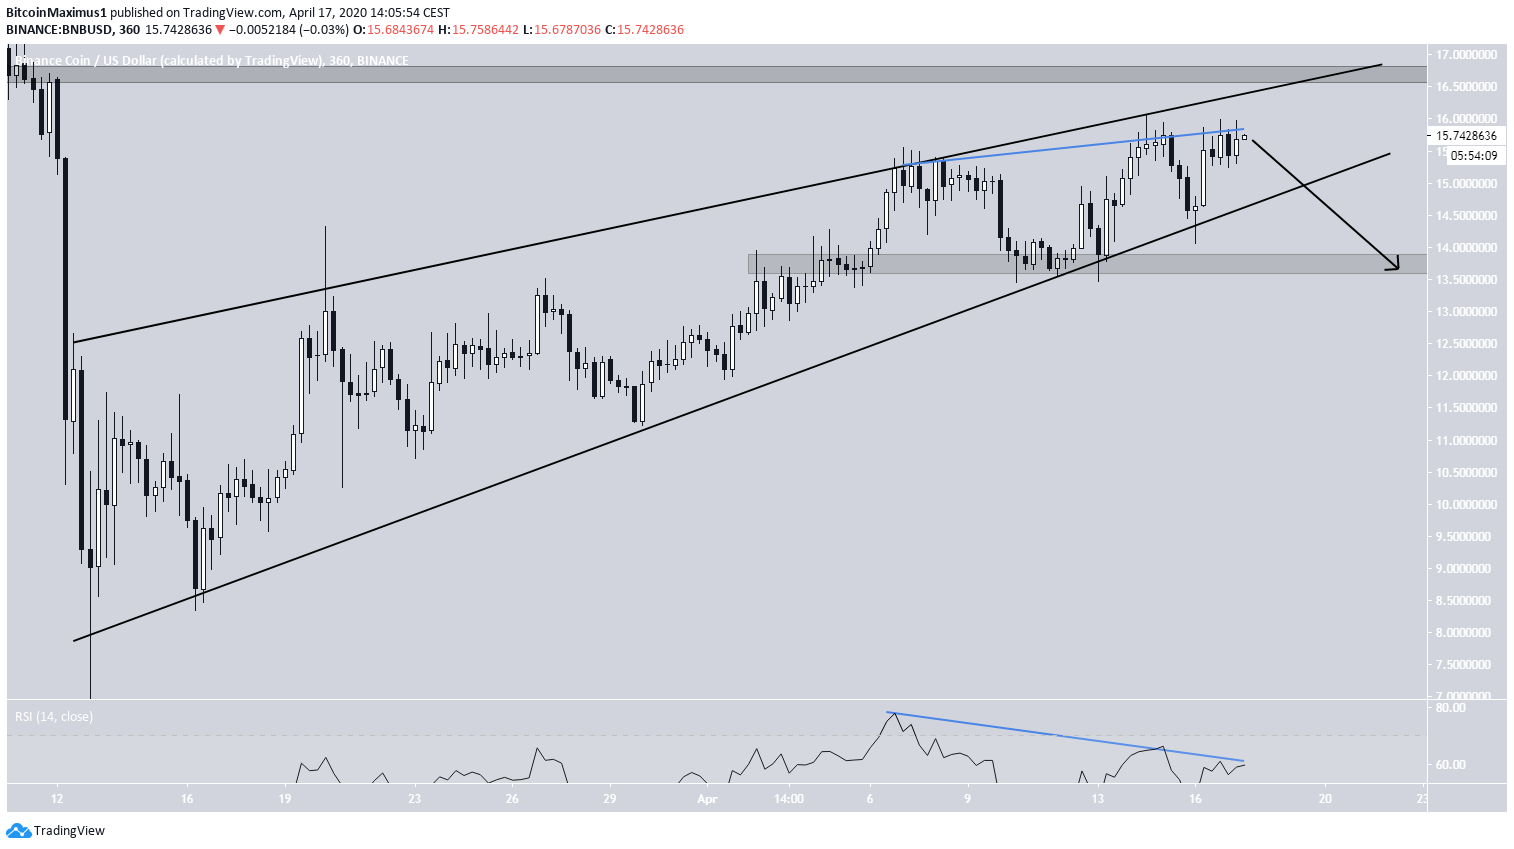
Verdict
The BNB price is likely to break down from the ascending wedge and reach the support area at $13.5.EOS (EOS)
The EOS price is trading inside a symmetrical triangle and has been doing so since March 9. Yesterday’s high served to provide the slope of the descending resistance line.
Verdict
The EOS price is likely to continue trading inside its pattern. A breakdown is slightly more likely due to the preceding downward move and possible bearishness for BTC.Tezos (XTZ)
The XTZ price is trading inside an ascending channel and has been doing so since March 13. On April 14, the price reached the ascending support line of this channel, which coincides with the $1.8 support area and began the current upward move, which is still ongoing.
Verdict
The XTZ price is likely to continue increasing until it reaches the resistance line of the channel, which is currently at $2.4.ChainLink (LINK)
The LINK price has been following an ascending support line since March 13. It increased gradually at its slope until April 6, when the rate of increase greatly accelerated.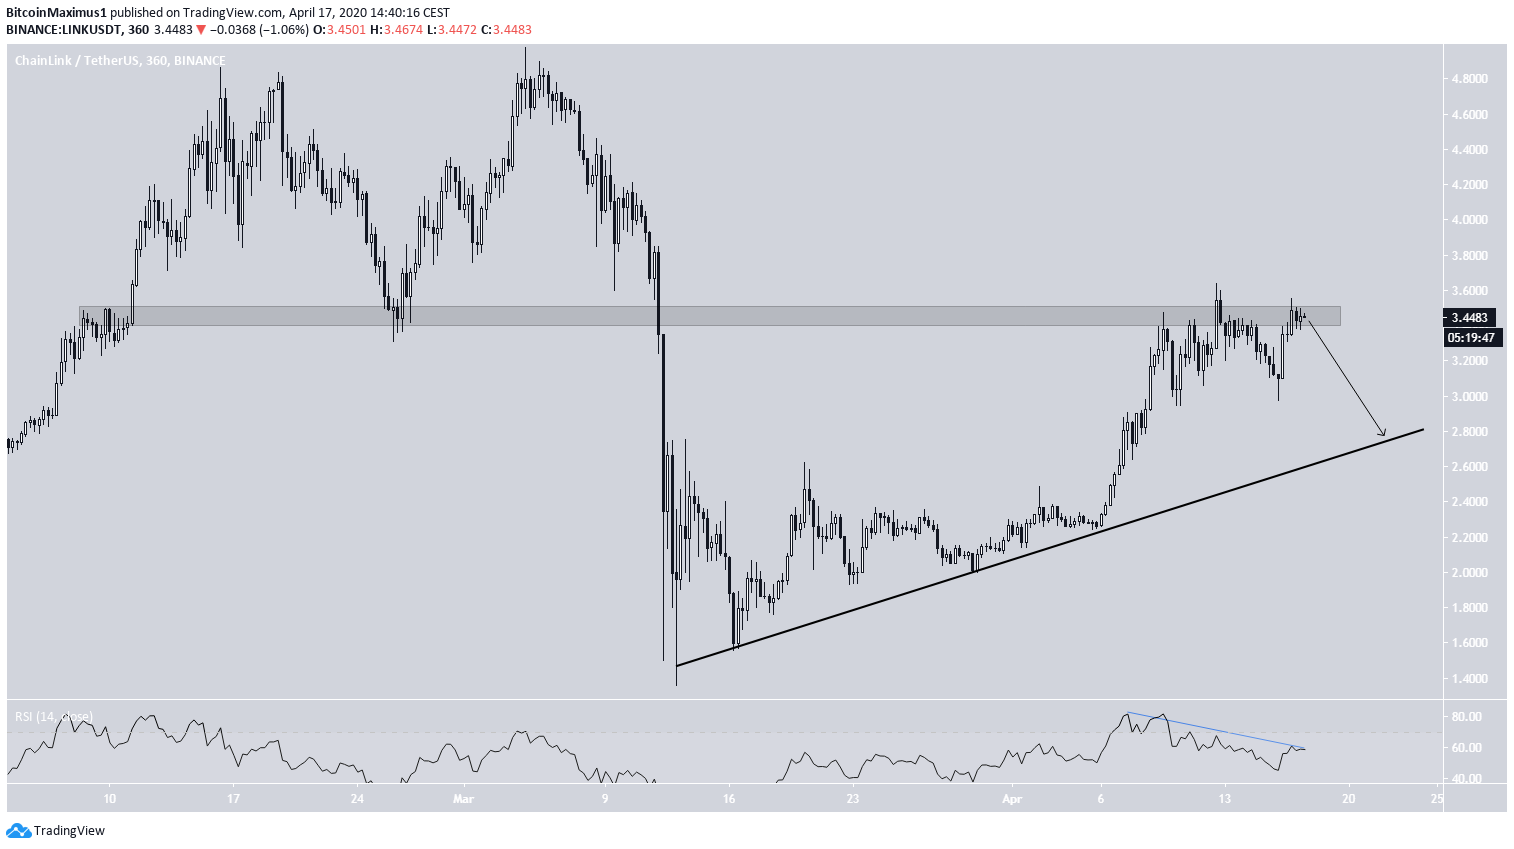
Verdict
The LINK price is likely to decrease until it reaches the ascending support line outlined above.
Top crypto projects in the US | April 2024
Trusted
Disclaimer
In line with the Trust Project guidelines, this price analysis article is for informational purposes only and should not be considered financial or investment advice. BeInCrypto is committed to accurate, unbiased reporting, but market conditions are subject to change without notice. Always conduct your own research and consult with a professional before making any financial decisions. Please note that our Terms and Conditions, Privacy Policy, and Disclaimers have been updated.

Valdrin Tahiri
Valdrin discovered cryptocurrencies while he was getting his MSc in Financial Markets from the Barcelona School of Economics. Shortly after graduating, he began writing for several different cryptocurrency related websites as a freelancer before eventually taking on the role of BeInCrypto's Senior Analyst.
(I do not have a discord and will not contact you first there. Beware of scammers)
READ FULL BIO
Sponsored
Sponsored