

The Cartesi (CTSI) price has been struggling to move above the $0.061 resistance area for nearly six months, but is expected to soon break out.
COTI (COTI) has already broken out from its resistance area and is expected to gradually increase towards a new all-time high price.
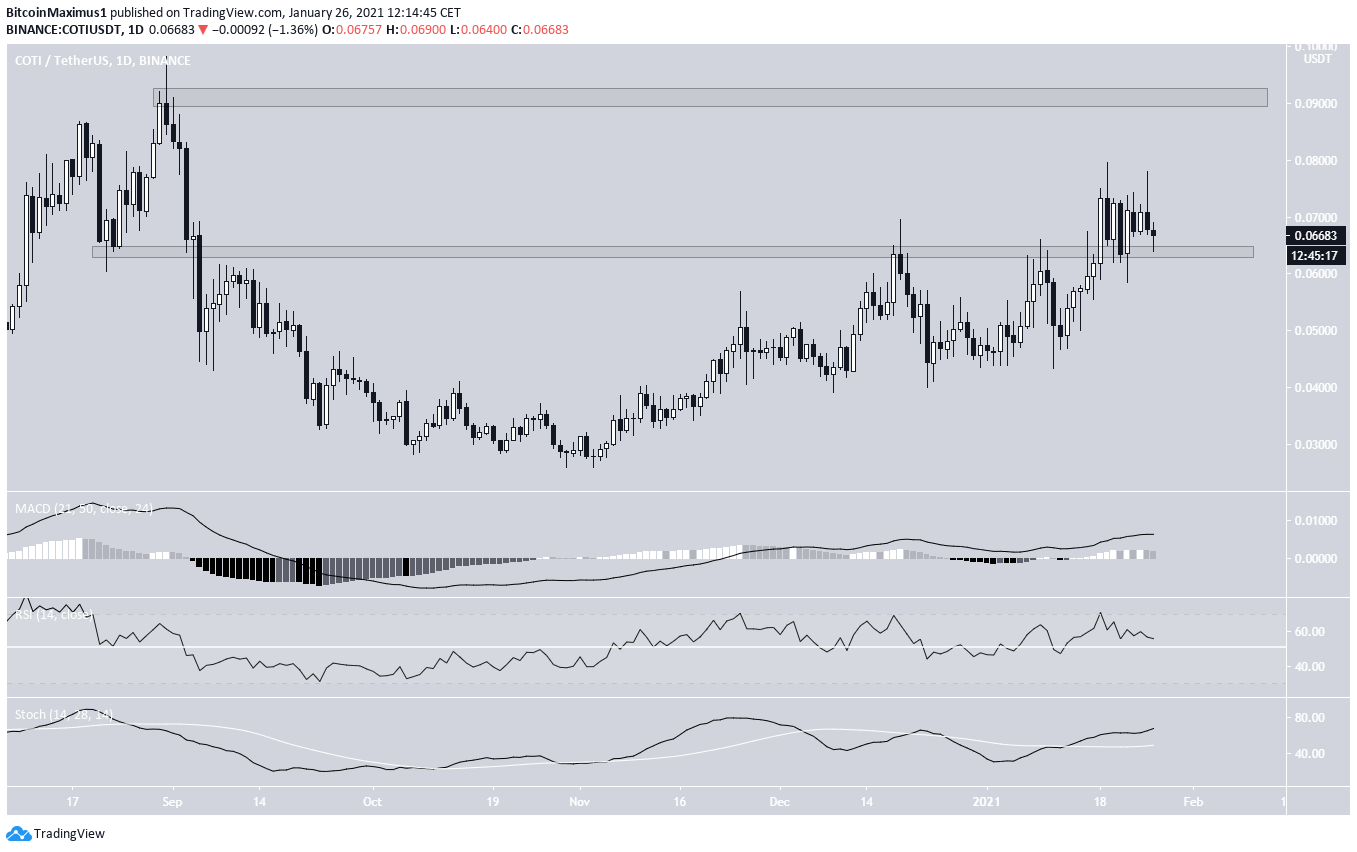
COTI Breaks Out
COTI has already broken out from its resistance area at $0.064.
Currently, COTI is in the process of validating this area as support. If successful, it would be expected to move towards $0.09 and eventually a new all-time high.
Technical indicators support this possibility.
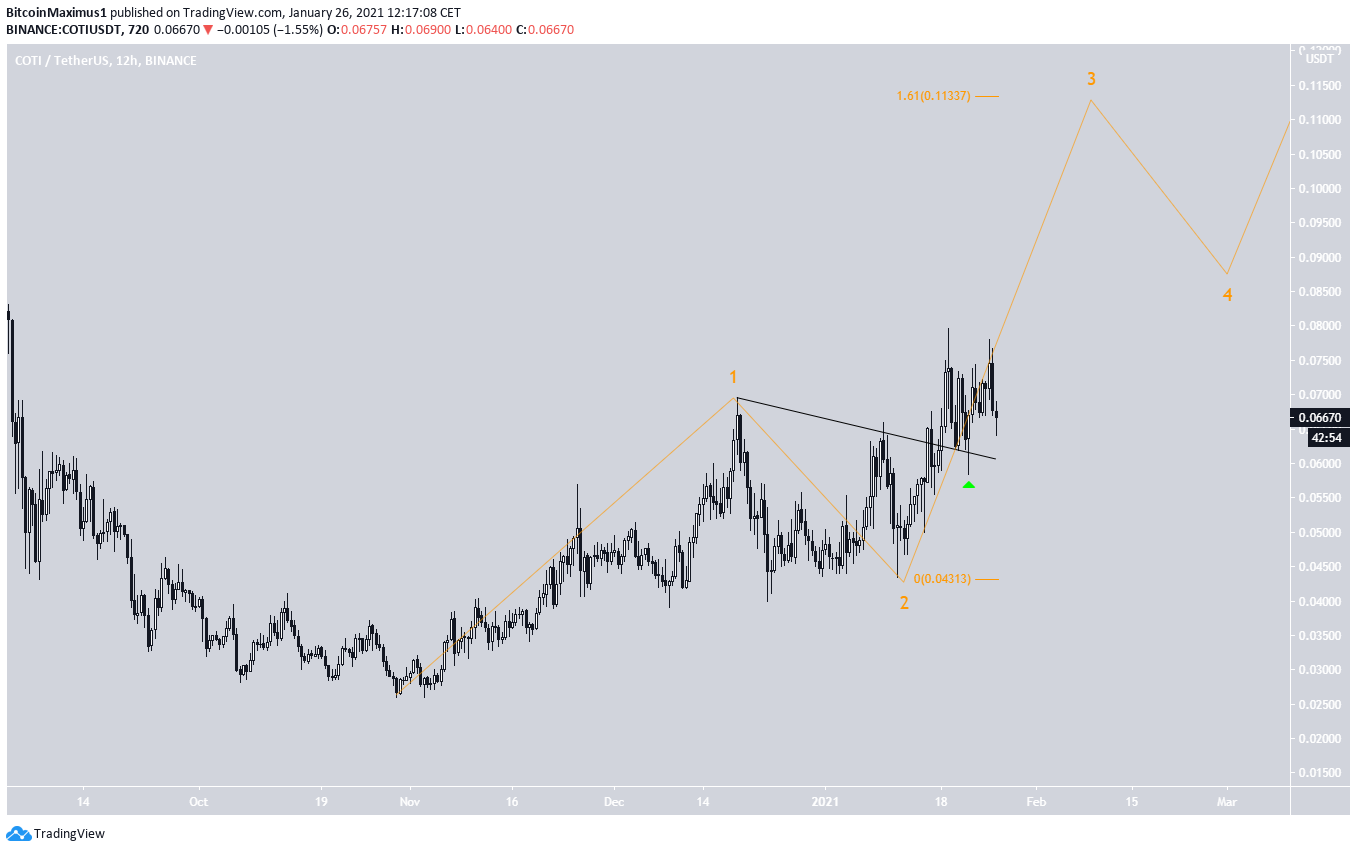
The wave count suggests that COTI is in wave 3 of a bullish impulse (shown in orange) that began in November 2020.
A likely target for the top of wave 3 is found at $0.11, which would give waves 1:3 a 1:1.61 ratio, as is common in bullish impulses.
Wave 5 could become parabolic since COTI would be in price discovery.
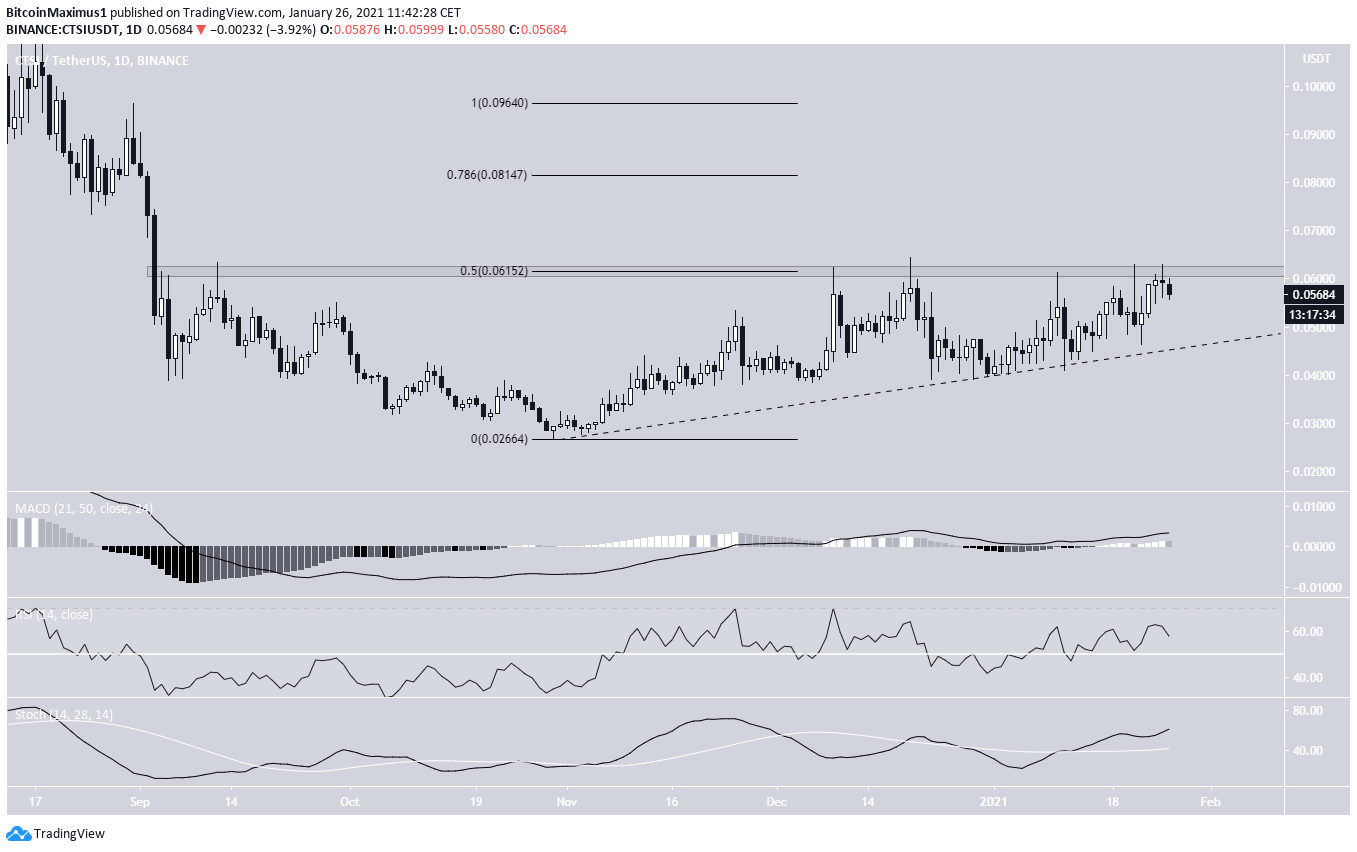
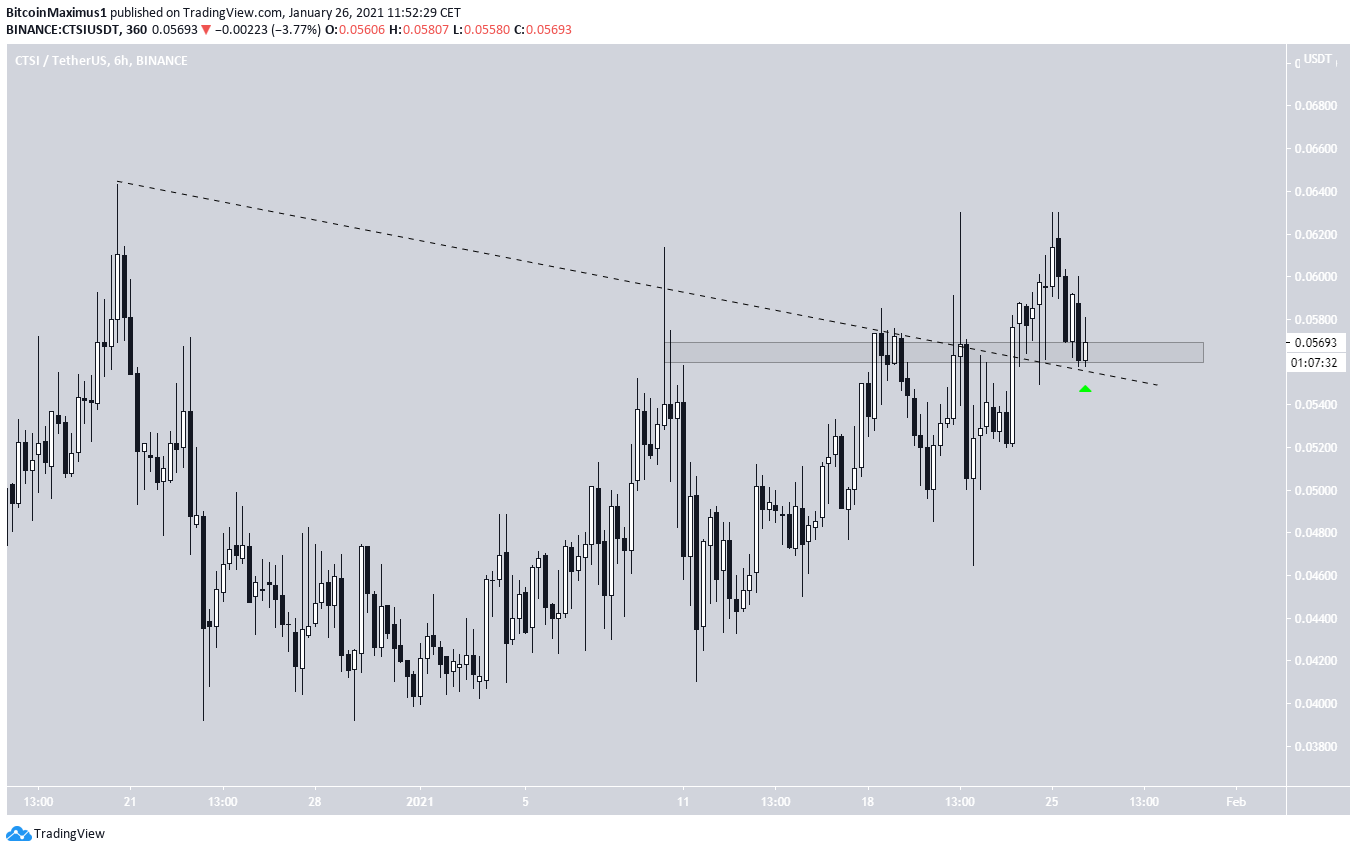
CTSI Attempts To Break Out
CTSI has been moving upwards since reaching a low of $0.026 on Oct. 30. Throughout this increase, CTSI has been following an ascending support line (dashed).
The resistance area cannot be accurately determined because of numerous long upper wicks. However, the 0.5 Fib retracement level falls at $0.61, making this a likely level for the resistance area.
Technical indicators are bullish, supporting the possibility that CTSI breaks out. Finally, the Jan. 24 close was the highest one since the initial breakdown in September 2020, indicating buyer strength.
If CTSI breaks out, the next closest resistance area is found at $0.081 (0.786 Fib retracement level).
Cryptocurrency trader @Crypto_Off outlined a CTSI chart, stating that a breakout from the current symmetrical triangle could occur soon.
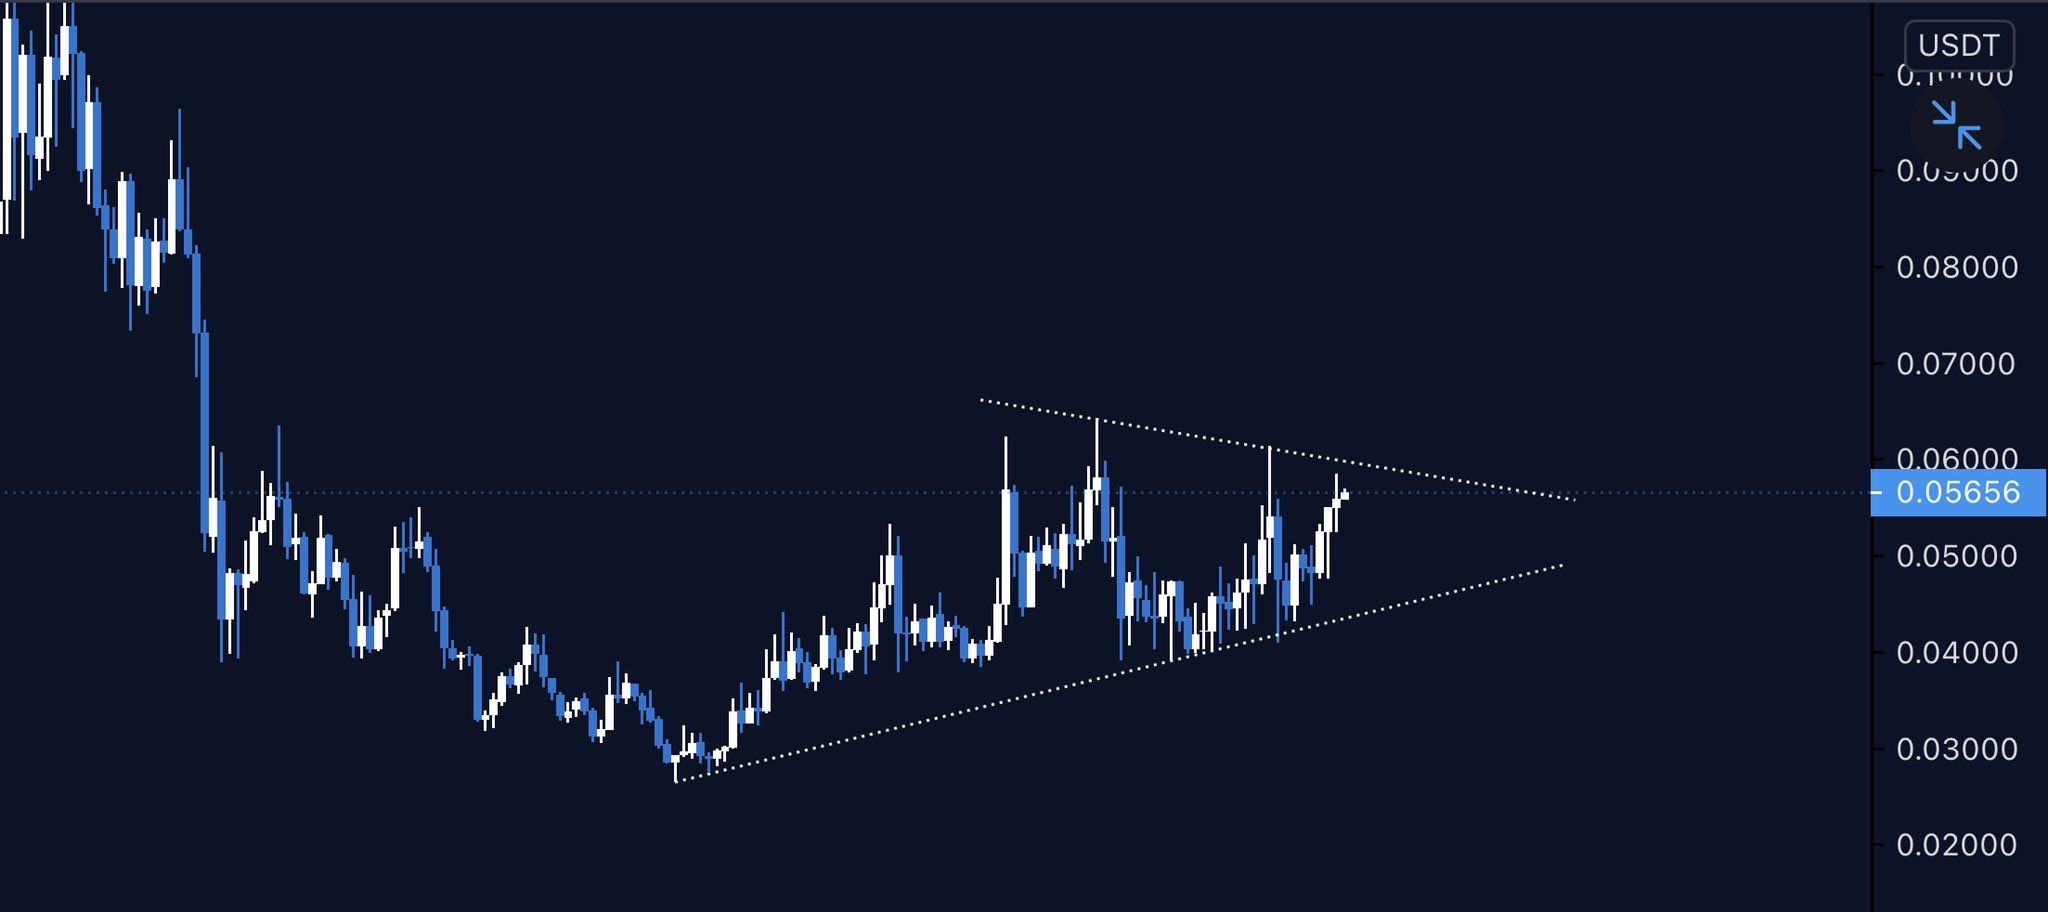
Since the tweet, CTSI has already broken out from the symmetrical triangle and is currently in the process of validating the resistance line as support.
This further supports the possibility that CTSI will continue increasing and eventually break out above the $0.061 resistance area.
Conclusion
CTSI is expected to soon break out above the $0.061 resistance area and gradually move towards $0.078.
COTI has already broken out from and re-tested its previous resistance area at $0.064 and is now expected to gradually increase towards a new all-time high.
For BeInCrypto’s latest Bitcoin (BTC) analysis, click here!
Trusted
Disclaimer
In line with the Trust Project guidelines, this price analysis article is for informational purposes only and should not be considered financial or investment advice. BeInCrypto is committed to accurate, unbiased reporting, but market conditions are subject to change without notice. Always conduct your own research and consult with a professional before making any financial decisions. Please note that our Terms and Conditions, Privacy Policy, and Disclaimers have been updated.
