

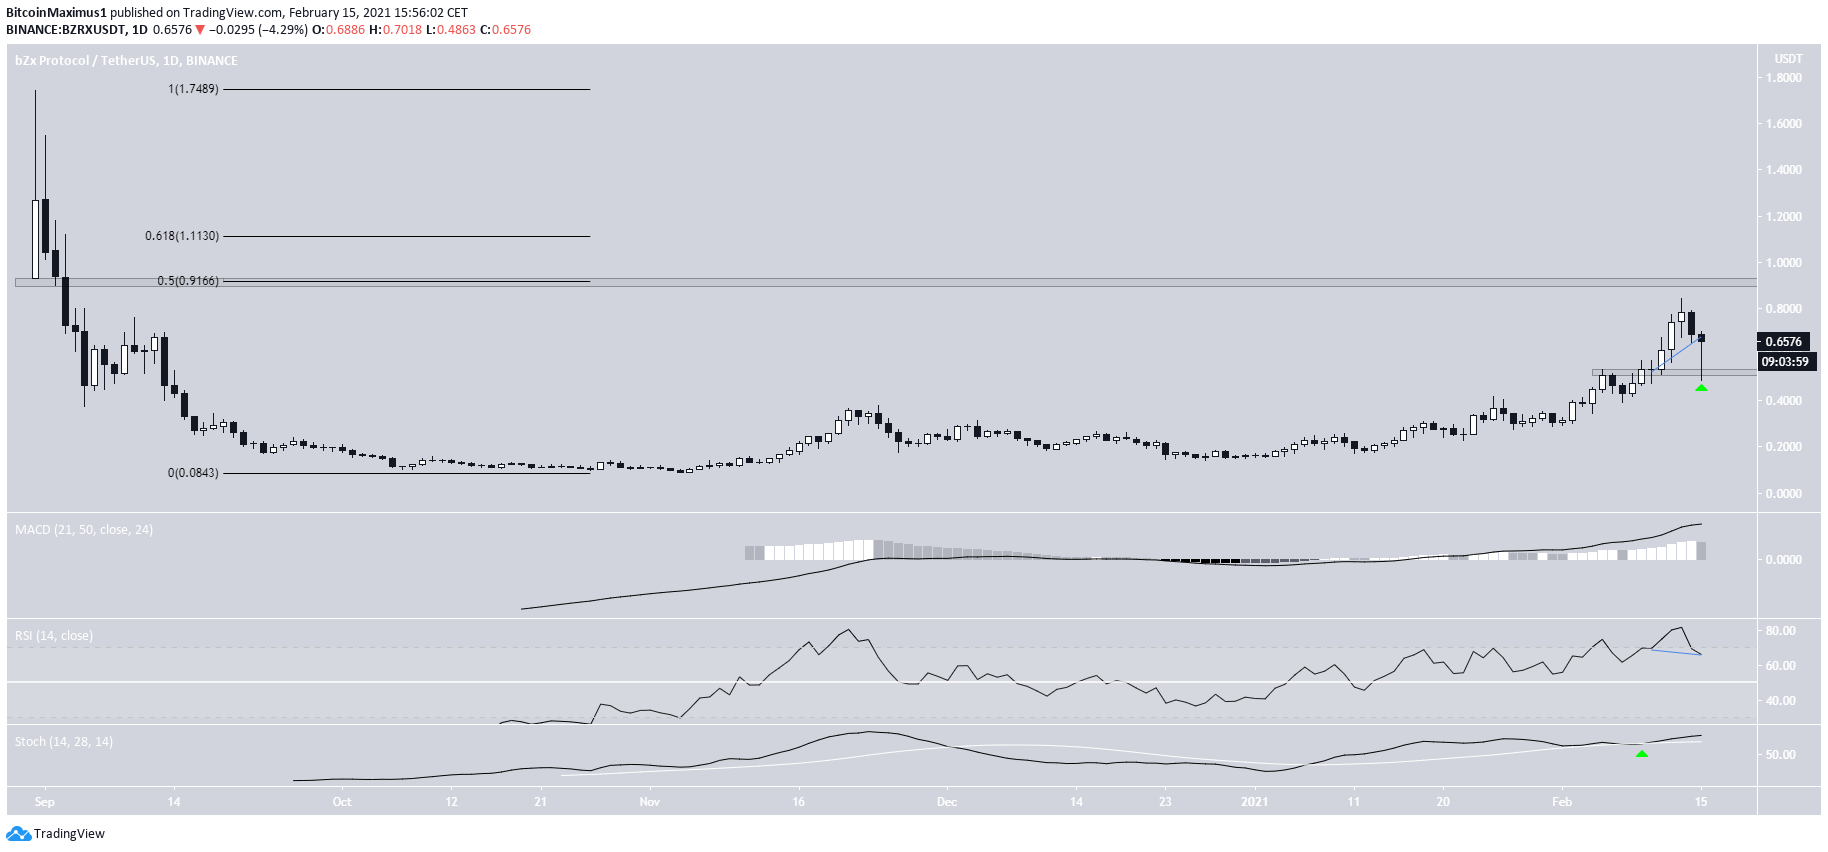
The bZx Protocol (BZRX) price has been decreasing since reaching a high of $0.84 on Feb. 13.
The dip was stopped short once bZx Protocol reached the $0.52 support area.
BZRX is expected to continue increasing towards the closest resistance area at $0.915 and possibly higher.
bZx Protocol Approaches Resistance
BZRX has been increasing since reaching an all-time low price of $0.088 on Nov. 5, 2020. The price action continued until a high of $0.84 was reached on Feb. 13. At this point, BZRX dropped sharply.
The dip served to validate the $0.52 area as support and created a long lower wick in the process (green arrow).
Technical indicators are bullish, supporting the continuation of the upward movement. In addition, the RSI has generated a hidden bullish divergence and the Stochastic oscillator has just made a bullish cross.
If BZRX continues increasing, the closest resistance area would be found at $0.915. The area is the 0.5 Fib retracement level and a horizontal resistance level. So, if BZRX were to clear it and the 0.618 Fib retracement at $1.11, it would likely accelerate towards the all-time high price of $1.74.
Cryptocurrency trader @CryptoChimpanz outlined a BZRX chart, stating that it looks very bullish since it has reclaimed the $0.70 resistance area.
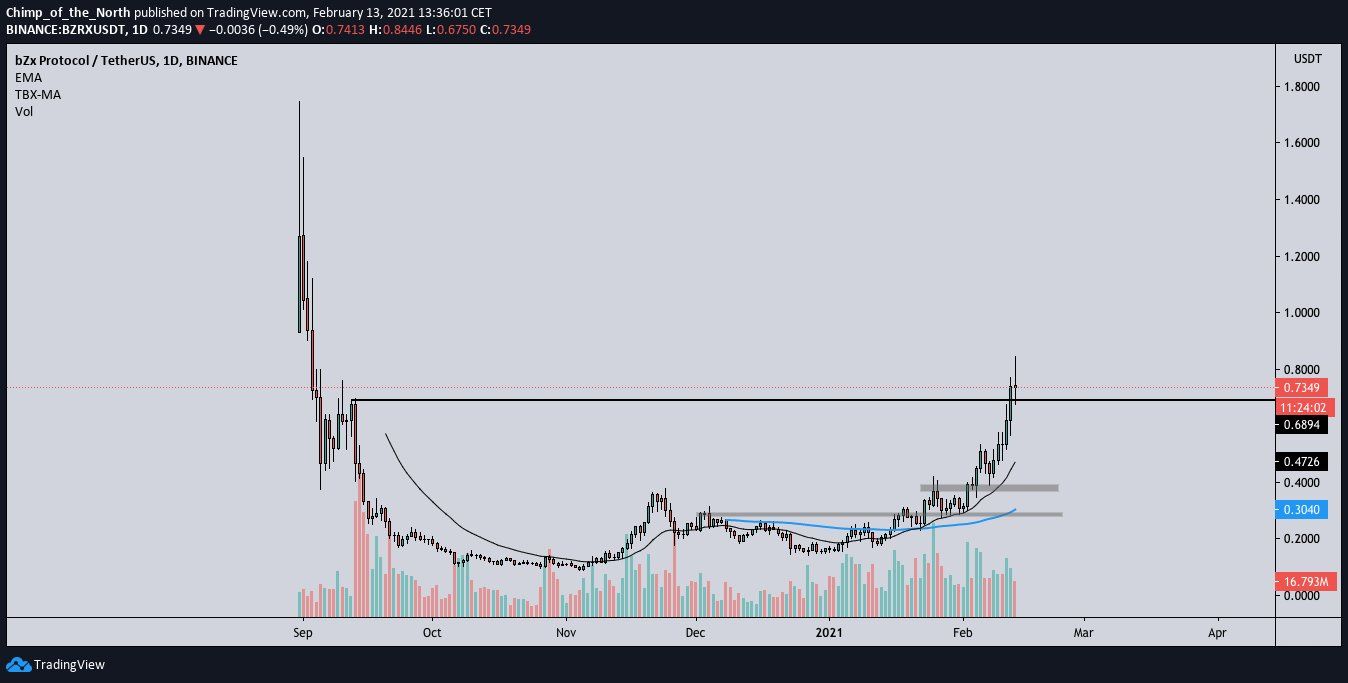
Since the tweet, BZRX has fallen back below this resistance area. It likely needs to clear the $0.915 resistance area for the rate of increase to truly accelerate.
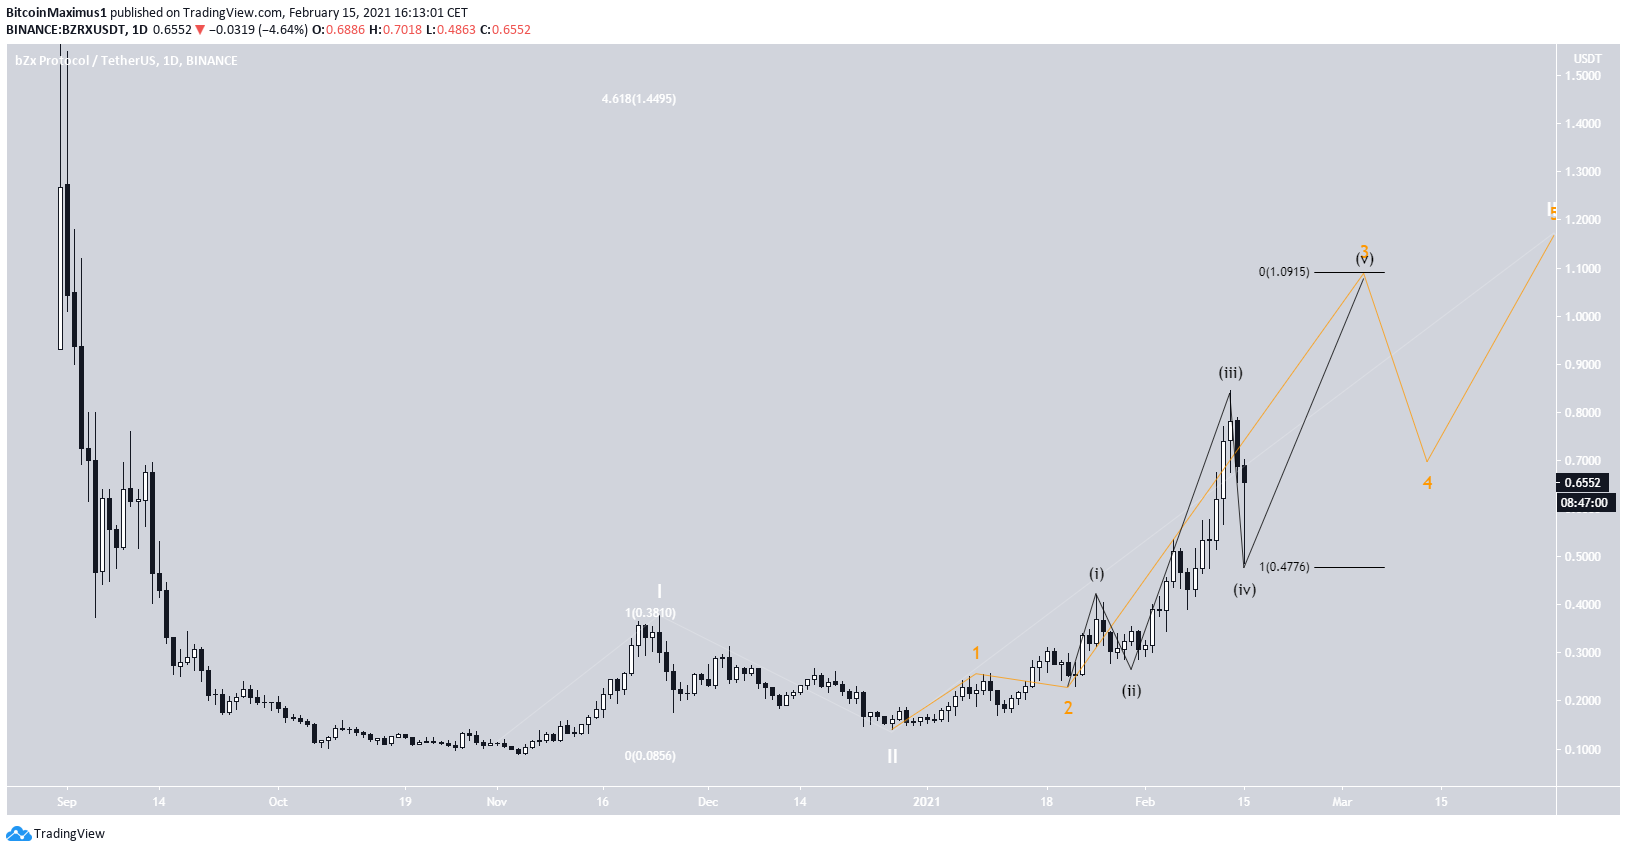
Wave Count
The wave count suggests that BZRX is in sub-wave five (black) of a bullish impulse (orange) that began in December 2020.
The most likely target for the top of the short-term upward move is found at $1.09. This target also coinciding with the previously outlined resistance at $1.11.
Afterward, a possible target for the top of the entire impulse is found at $1.44.
BZRX/BTC
The BZRX/BTC chart shows a similar bounce at the 1,240 satoshi support area, which left a long lower wick.
The Stochastic oscillator has made a bullish cross, supporting the continuation of the upward movement.
If BZRX continues increasing, the next likely resistance area is found at 2,100 satoshis — a level that hasn’t been broken since October 2020.
If BZRX manages to clear it, it would be expected to increase at an accelerated rate.
Conclusion
The trends for BZRX/USD and BZRX/BTC appear to be bullish. Both are expected to increase towards their closest resistance areas at $0.91 and 2,100 satoshis respectively.
For BeInCrypto’s latest Bitcoin (BTC) analysis, click here
Trusted
Disclaimer
In line with the Trust Project guidelines, this price analysis article is for informational purposes only and should not be considered financial or investment advice. BeInCrypto is committed to accurate, unbiased reporting, but market conditions are subject to change without notice. Always conduct your own research and consult with a professional before making any financial decisions. Please note that our Terms and Conditions, Privacy Policy, and Disclaimers have been updated.
