

What is SOPR?
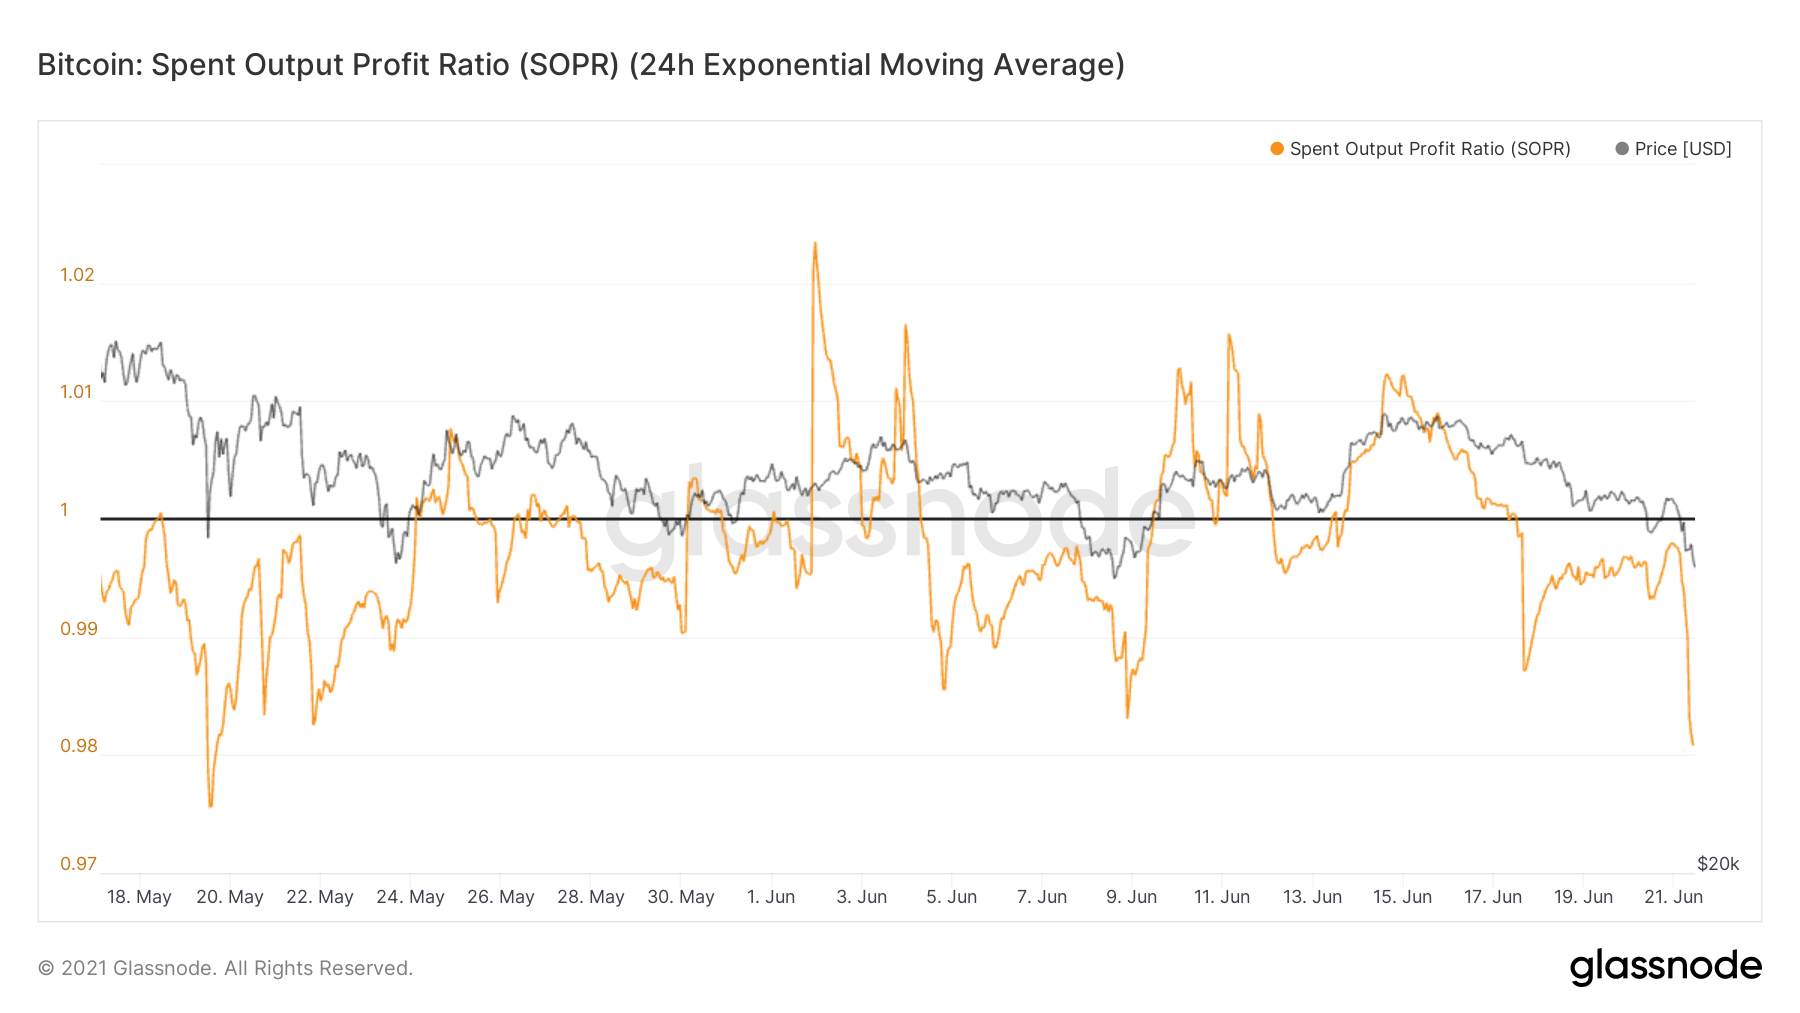
SOPR is an indicator that measures the profit or loss of every single transaction that is made in the market. This is done by measuring the difference between the purchase and sale prices. Therefore, it shows whether the overall market is at a profit or at a loss.
A SOPR >1 means that participants in the market are selling at a profit, while the opposite is true for values <1.
A consistent indicator reading above 1 suggests that the asset is in a bull market. In such times, participants rarely sell at a loss. This means that at the worst case scenario, the SOPR bounces at the 1 line but does not drop below it.
Current reading
In the 2015-2017 bull run, the SOPR briefly fell below the 1 line three times. However, it bounced immediately and continued to increase afterwards (black icons). Afterwards, it moved freely above and below the 1 line in the period from Jan. 2018 to March 2020. As stated above, this is a sign that the direction of the trend is undecided. In the current bull run, it re-tested the one line on Sept. 2020 and moved upwards. However, in April 2021, it fell well below the line and has been struggling to move back above it. Therefore, this is either a sharper than usual retracement or it forewarns of a change in the direction of the trend.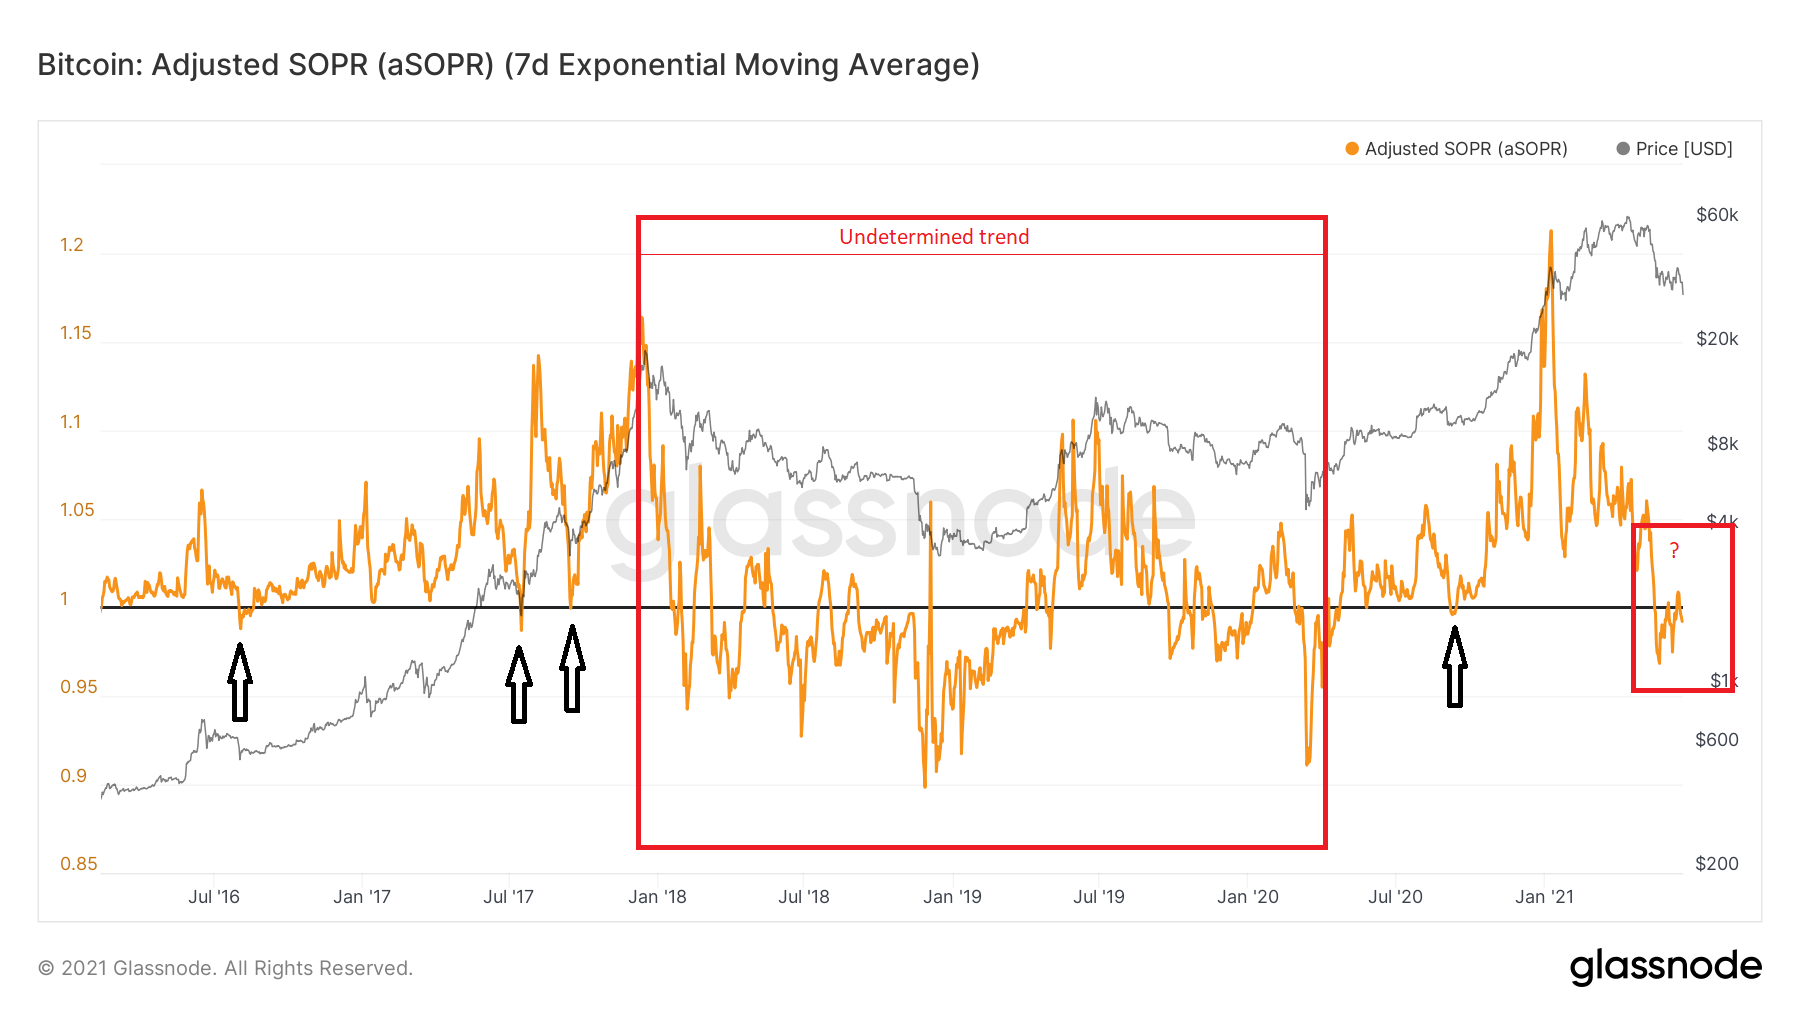
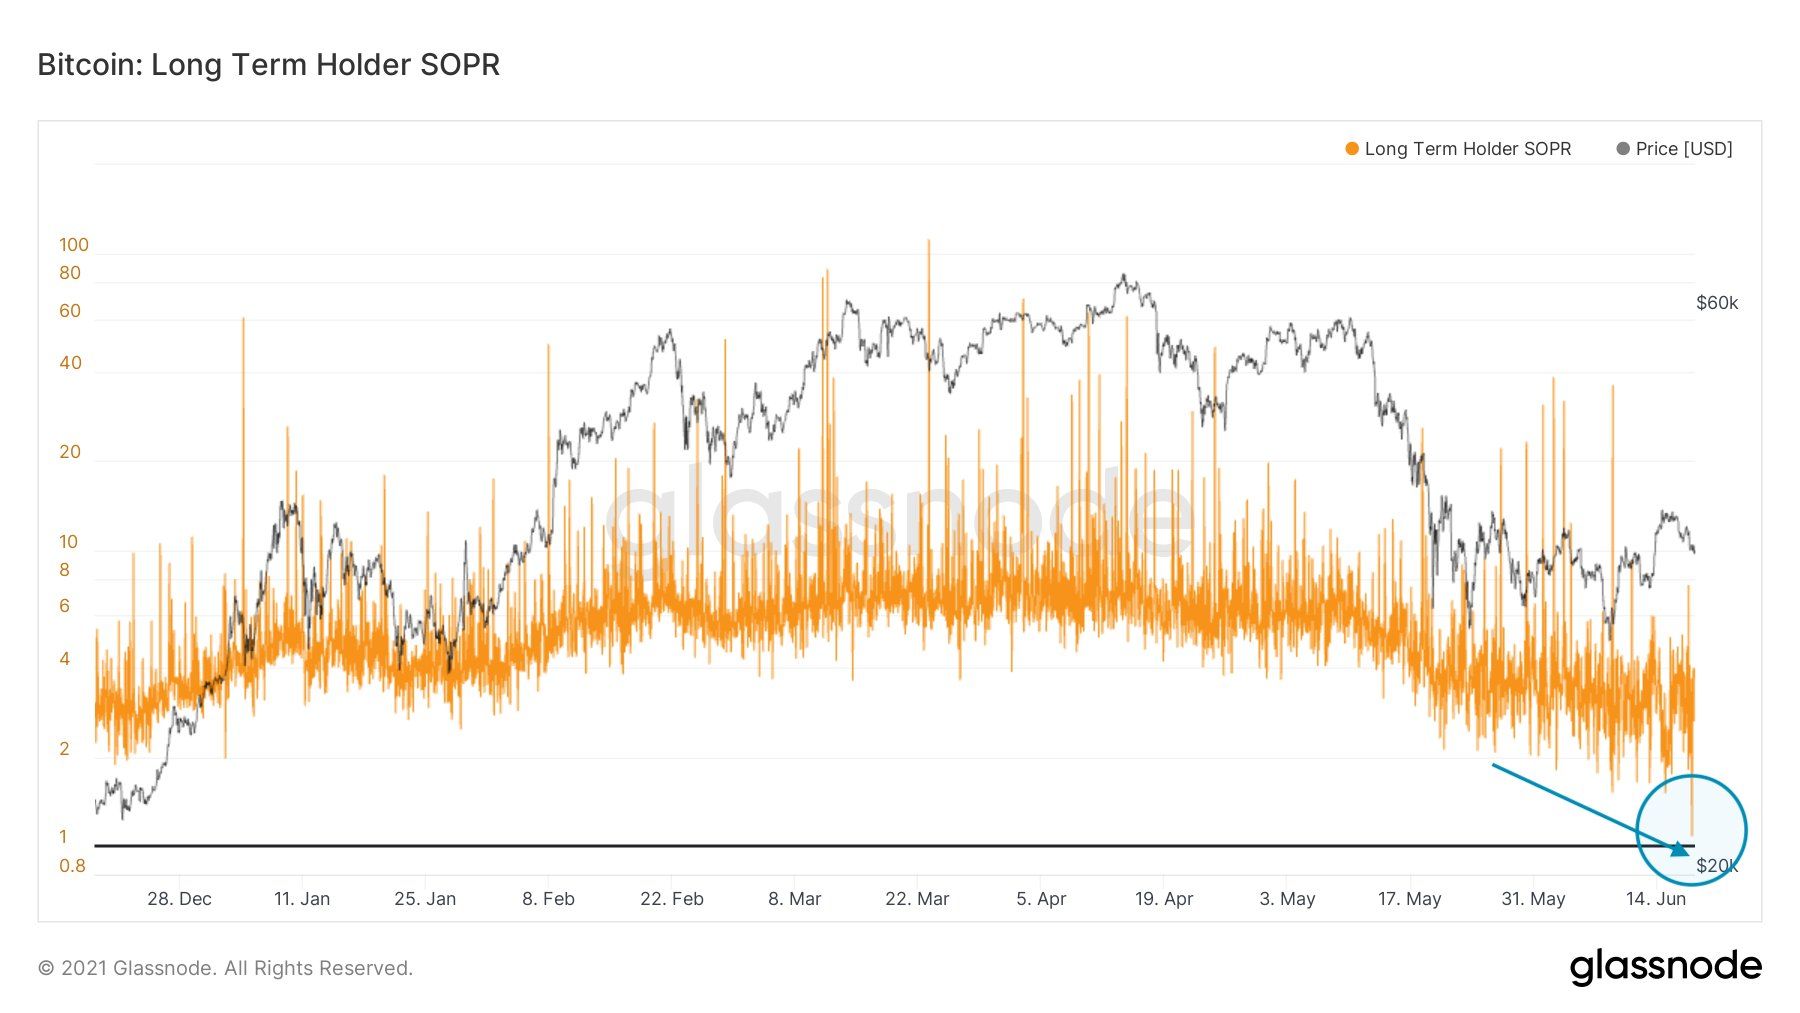
The long-term holder SOPR is also dropping, and has nearly reached the 1 line. This means that even holders are getting impatient and are selling at low prices, just slightly above break even.
If holders capitulate, it would likely drive down the regular SOPR way below 0, confirming the change of trend.
Trusted
Disclaimer
In line with the Trust Project guidelines, this price analysis article is for informational purposes only and should not be considered financial or investment advice. BeInCrypto is committed to accurate, unbiased reporting, but market conditions are subject to change without notice. Always conduct your own research and consult with a professional before making any financial decisions. Please note that our Terms and Conditions, Privacy Policy, and Disclaimers have been updated.
