BTC, SXP, and NEAR are trading inside parallel channels.
XMR and YFI reached all-time highs on May 7 and 12, respectively.
ETH and XRP have potentially begun cycle wave fives.
promo
Bitcoin (BTC) has bounced at the support line of an ascending parallel channel.
Ethereum (ETH) is approaching the top of its bullish impulse.
XRP (XRP) has potentially just begun the fifth and final wave of its bullish impulse.
Yearn Finance (YFI) has broken out from a descending resistance line.
Monero (XMR) is approaching support at $325.
NEAR Protocol (NEAR) and Swipe (SXP) are trading inside descending parallel channels.
BTC
BTC has been trading inside a descending parallel channel since reaching an all-time high price just below $65,000 on April 14. On May 17, it bounced at the support line of the channel and has been moving upward since.
The MACD, RSI, and Stochastic oscillator have all generated bullish divergences. This is a sign that more upward movement is likely.
Therefore, the price is likely to move towards the closest resistance area between $48,650-$50,700.BTC Chart By TradingView
ETH
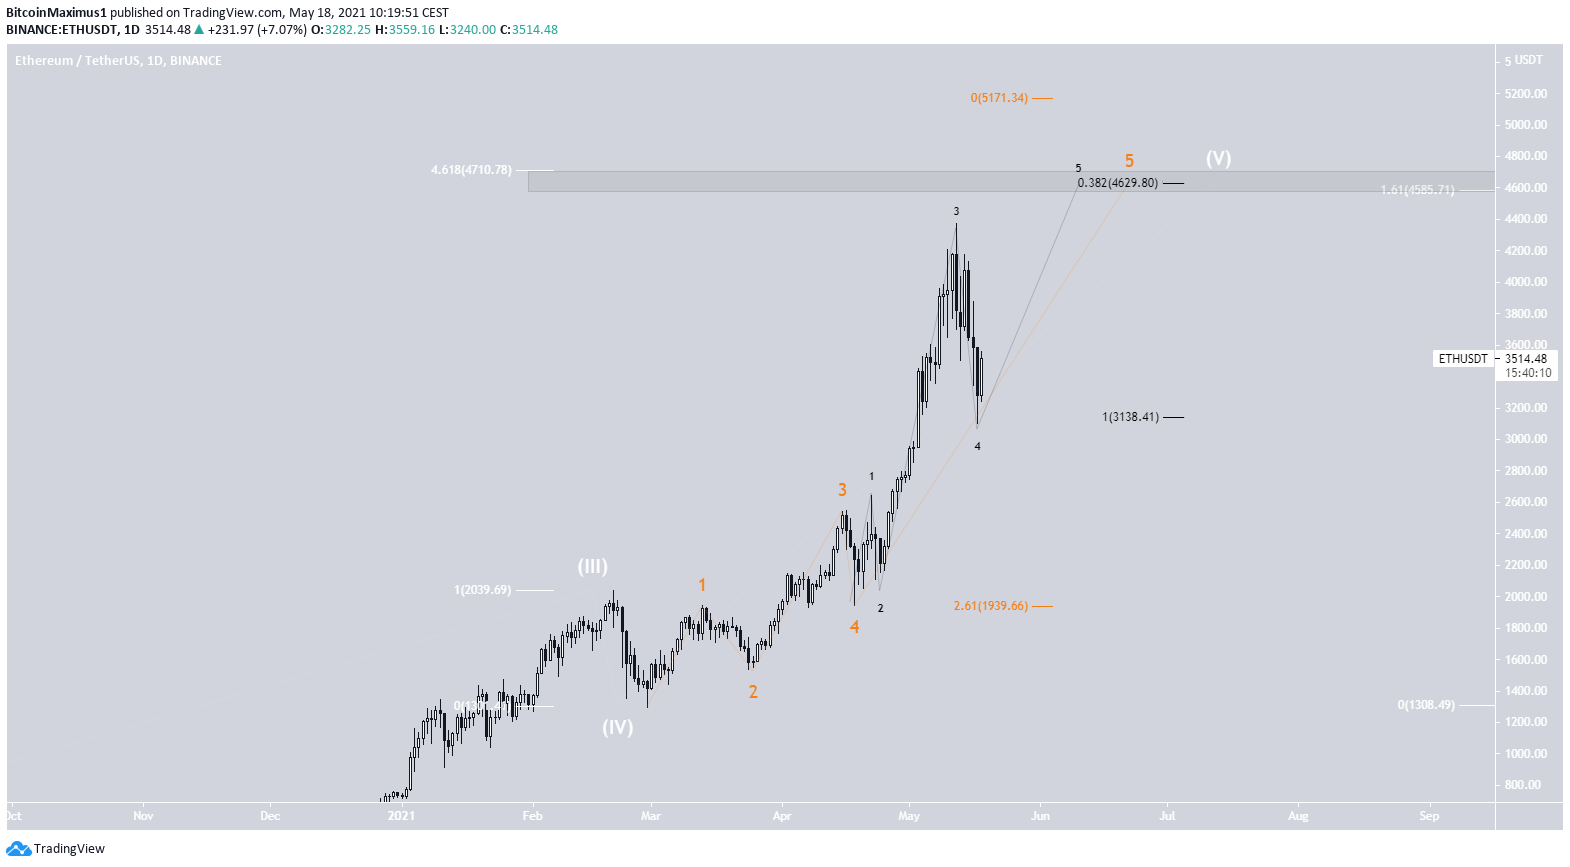
ETH has been rapidly moving upwards since April 23. However, it’s potentially approaching a local top.
Currently, it appears to be in sub-wave five (orange) of wave five (white). Therefore, it’s likely that the upward movement that began in March 2020 will be coming to an end.
There is a confluence of Fib resistance levels between $4,585 and $4,710, making it a likely area for the top to be reached.
This target area is found by using Fib projections on the cycle waves (white) and minor sub-waves (black) 1-3, and an external retracement on wave four.
If the movement extends, the next most likely target would be found at $5,171, though this is less likely to occur.
ETH Chart By TradingView
XRP
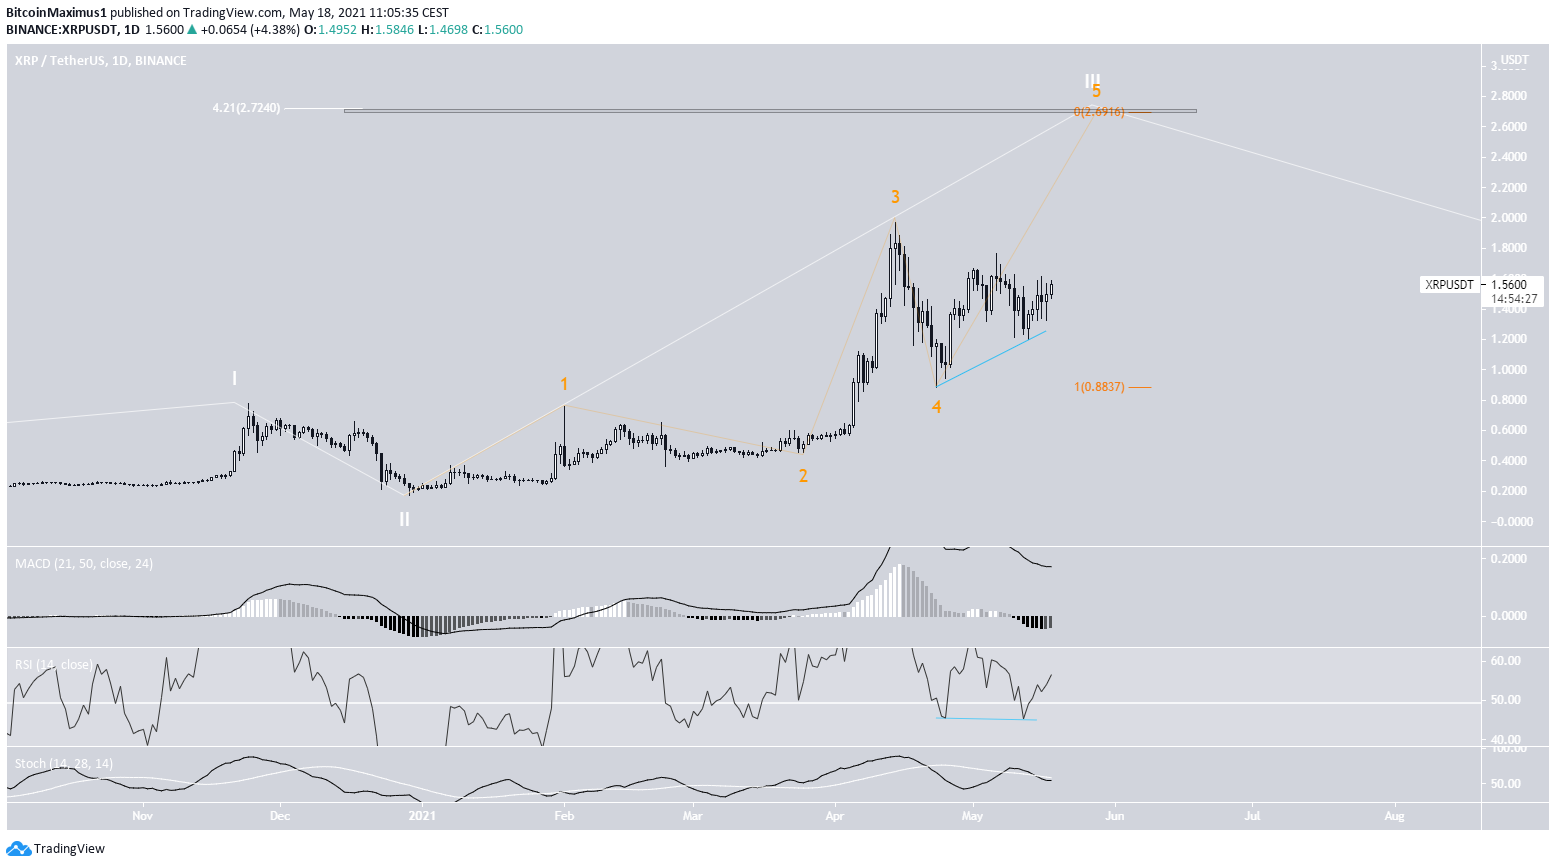
Similar to ETH, XRP has been moving upwards since April 23. It’s likely that it has begun sub-wave five (orange) of a bullish impulse.
A potential target for the top of the upward movement is found at $2.70.
Technical indicators are also relatively bullish. The MACD is increasing and is close to giving a bullish reversal signal while the RSI has generated a hidden bullish divergence.XRP Chart By TradingView
YFI
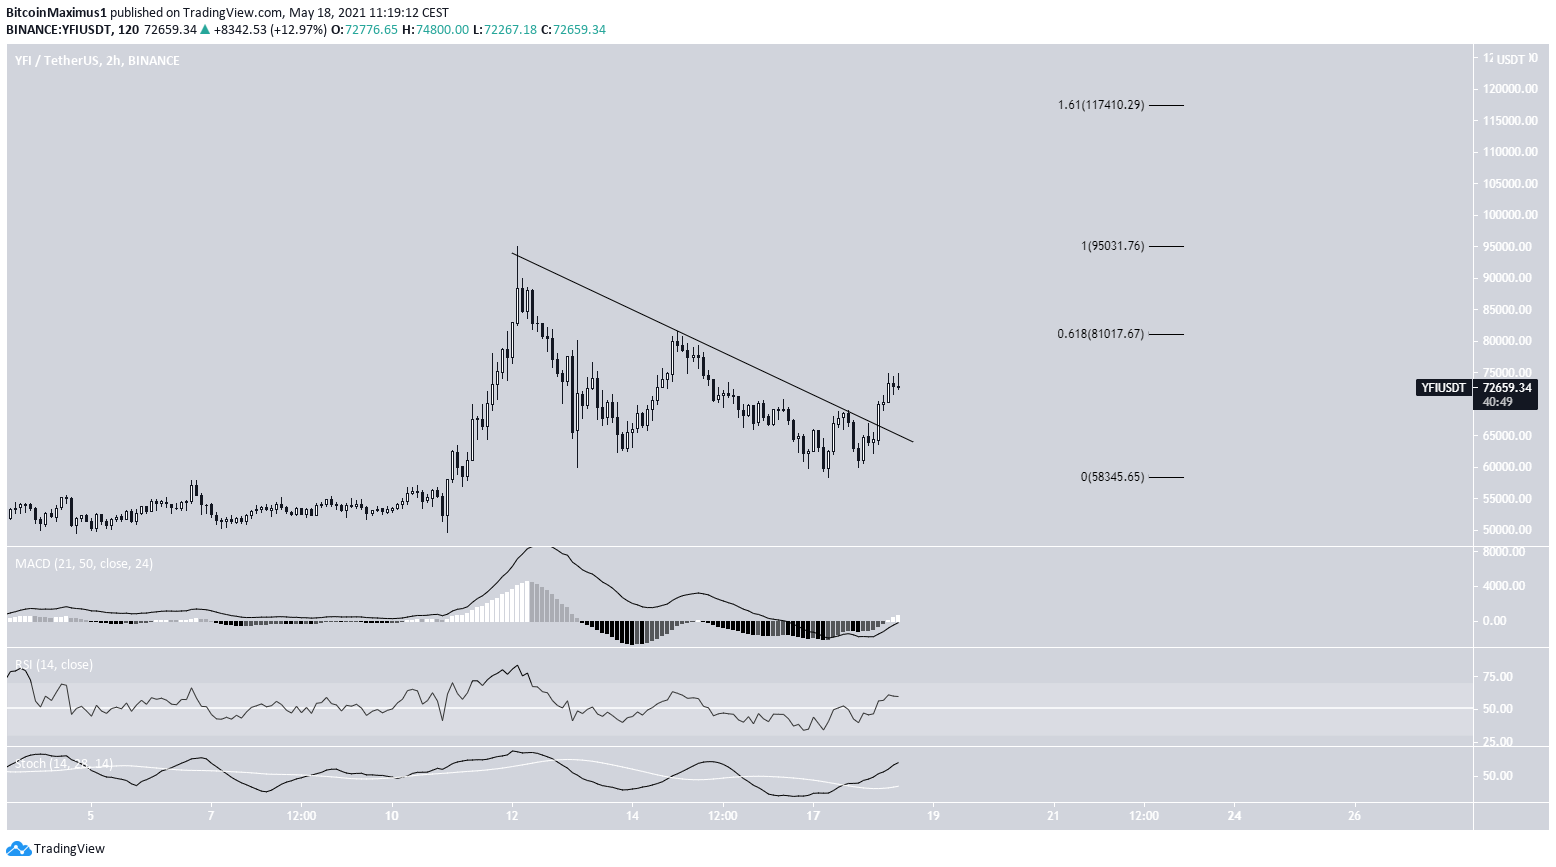
YFI has been moving downwards since reaching an all-time high price of $95,000 on May 12. Throughout the decrease, it’s followed a descending resistance line.
YFI broke out on May 18 and has been increasing since. The closest resistance area is found at $81,000. This is found using the 0.618 Fib retracement level of the entire downward movement.
If successful in moving above this level, the next resistances would be found at $95,000 and $117,410.
YFI Chart By TradingView
XMR
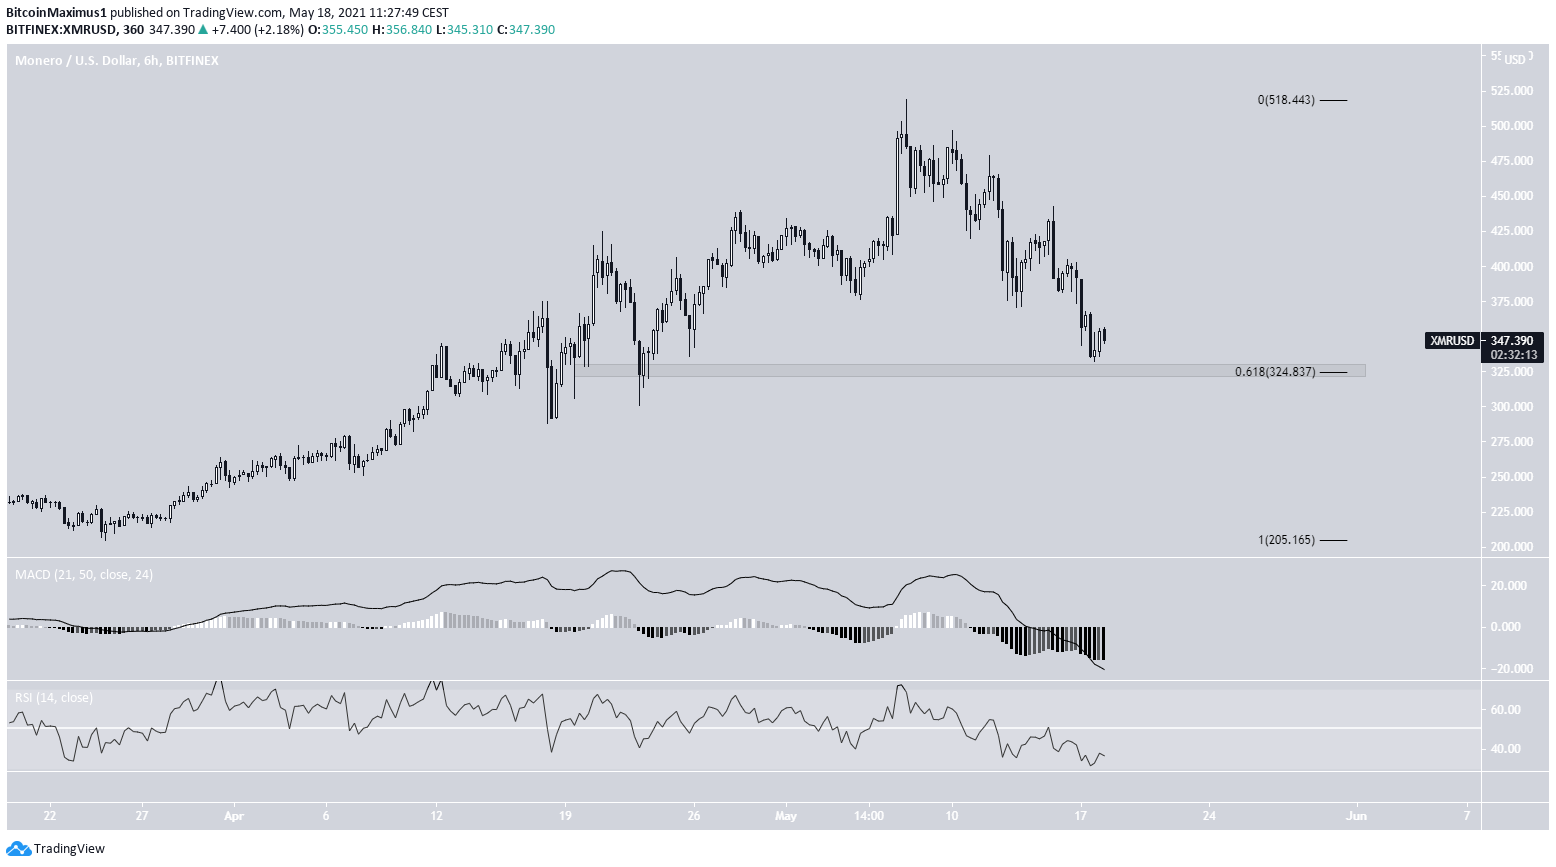
XMR has been moving downwards since May 7 after reaching an all-time high price of $518.
Currently, it’s approaching the $325 support area. Besides being a horizontal support level, it’s also the 0.618 fib retracement level of the entire upward movement.
However, there are no bullish reversal signs yet. Both the MACD and RSI are decreasing and there are no bullish divergences at play.
XMR Chart By TradingView
NEAR
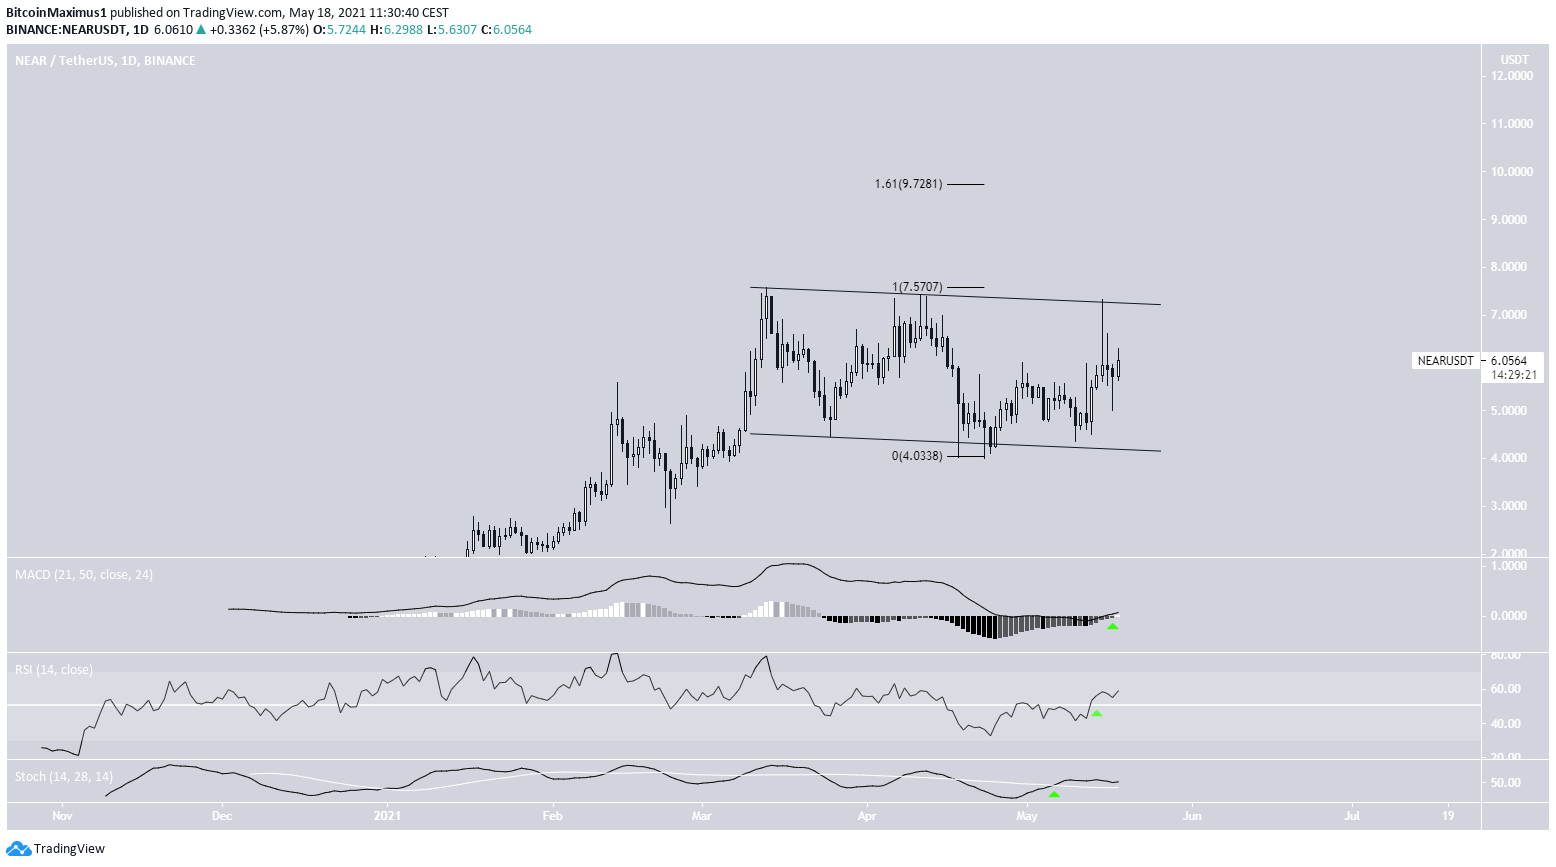
NEAR has been trading inside a descending channel since reaching an all-time high price of $7.58 on March 13.
On April 23, it reached the support line of this channel and began an upward movement which is still ongoing.
Technical indicators are bullish. This is especially evident by the RSI cross above 50 and the MACD cross above 0.
If the price breaks out from the current channel, the next closest resistance would be found at $9.72. This level is found using an external Fib retracement on the most recent downward movement.
NEAR Chart By TradingView
SXP
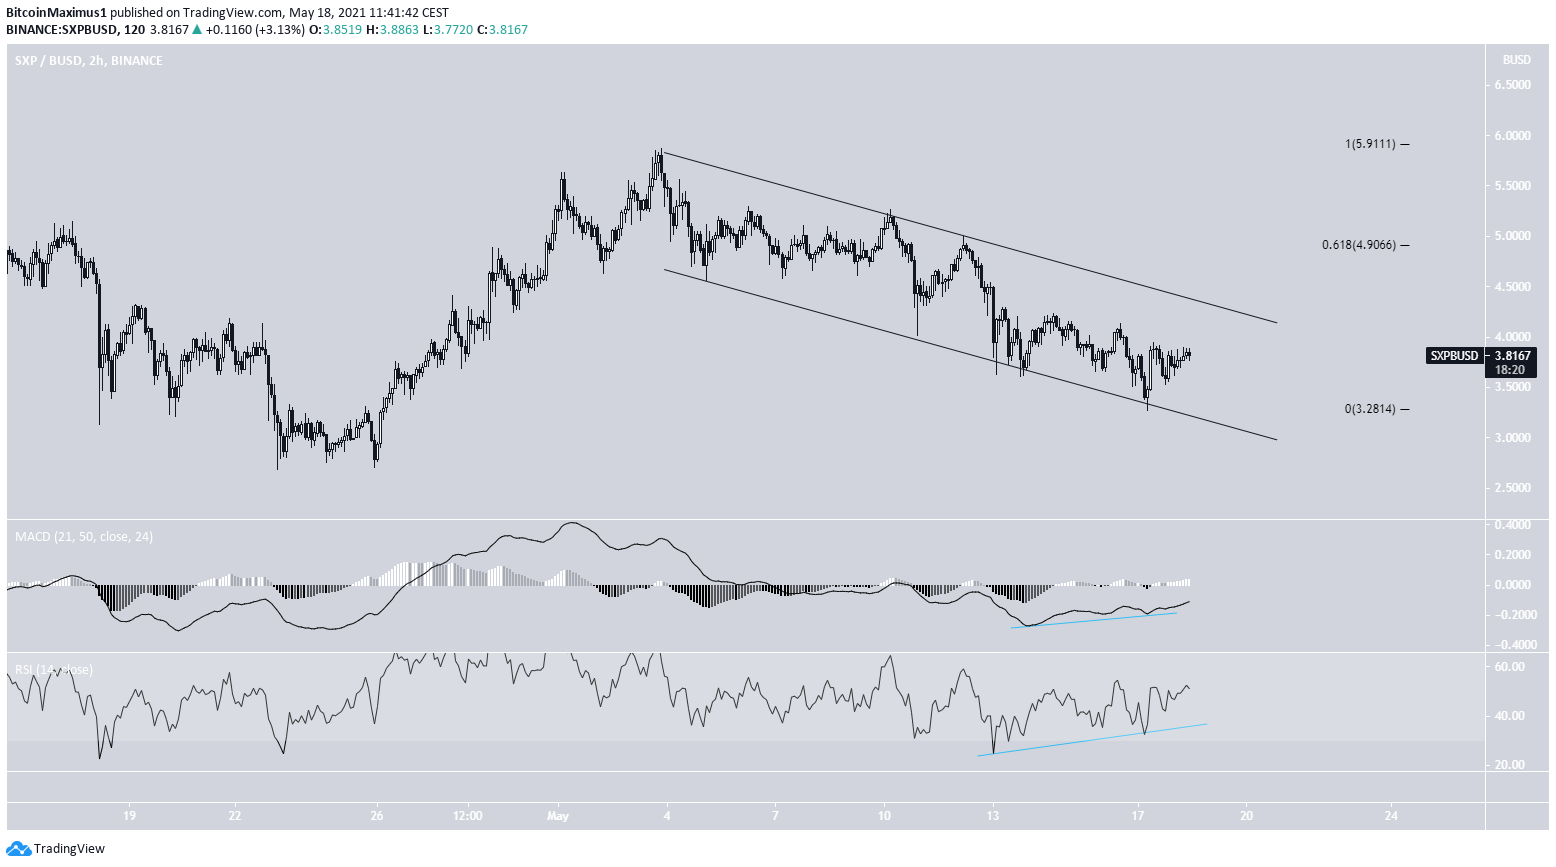
SXP has been trading inside a descending parallel channel since May 3. This is likely to be a corrective movement, from which a breakout is expected.
On May 17, SXP bounced at the support line of the channel. Both the MACD and RSI have also generated bullish divergences, supporting the possibility of a breakout.
If the price breaks out, the next closest resistance areas would be found at $4.90 and $5.90.
SXP Chart By TradingViewFor BeInCrypto’s latest bitcoin (BTC) analysis, click here.
In line with the Trust Project guidelines, this price analysis article is for informational purposes only and should not be considered financial or investment advice. BeInCrypto is committed to accurate, unbiased reporting, but market conditions are subject to change without notice. Always conduct your own research and consult with a professional before making any financial decisions. Please note that our Terms and Conditions, Privacy Policy, and Disclaimers have been updated.
Valdrin discovered cryptocurrencies while he was getting his MSc in Financial Markets from the Barcelona School of Economics. Shortly after graduating, he began writing for several different cryptocurrency related websites as a freelancer before eventually taking on the role of BeInCrypto's Senior Analyst.
(I do not have a discord and will not contact you first there. Beware of scammers)