
The prices of Bitcoin (BTC), Ethereum (ETH), Ren (REN) and Ravencoin (RVN) have reached, or are very close to reaching, their respective all-time high prices.
While XRP (XRP) is trading in a range without confirming a trend, ICON (ICX) and Dash (DASH) are looking bullish. Both are expected to reach their respective long-term resistance areas.
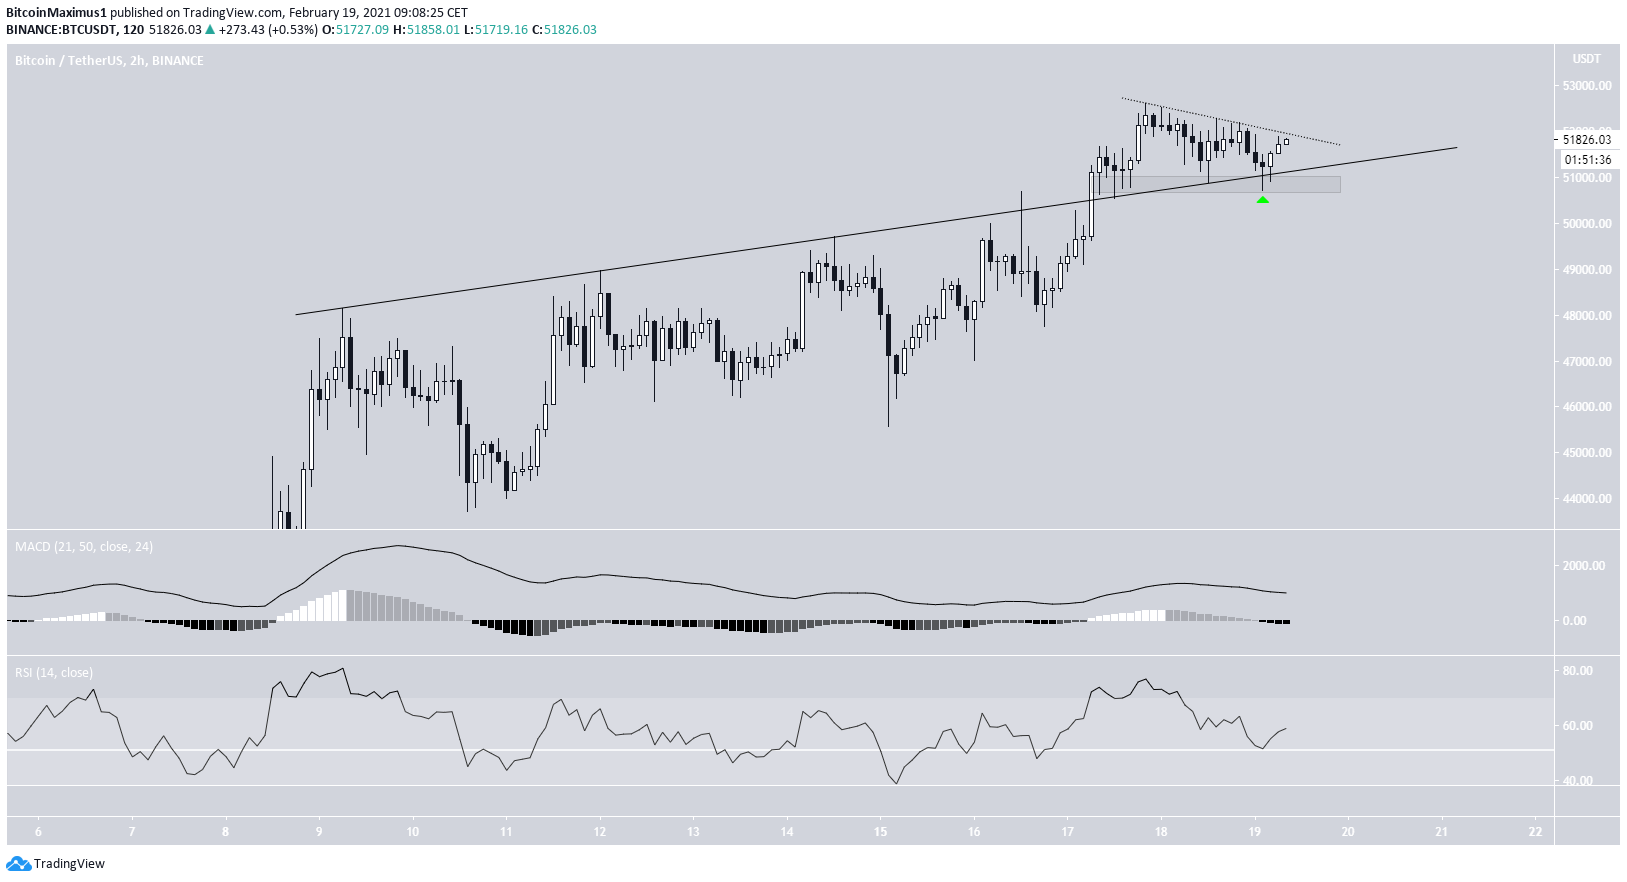
Bitcoin (BTC)
BTC has been gradually decreasing since reaching an all-time high price of $52,618 on Feb. 17. However, the decrease that followed has taken BTC back to the ascending resistance line and $50,800 minor support area (green arrow). BTC bounced after reaching these levels, validating them as support.
Technical indicators are bullish. The RSI has also bounced at the 50-line and the MACD is potentially turning upwards. A positive cross in the MACD histogram would confirm this upward movement.
The rate of increase would be expected to accelerate once BTC manages to break out from this short-term descending resistance line (dotted). The most likely target for the next high is in the range of $55,100-$55,900.
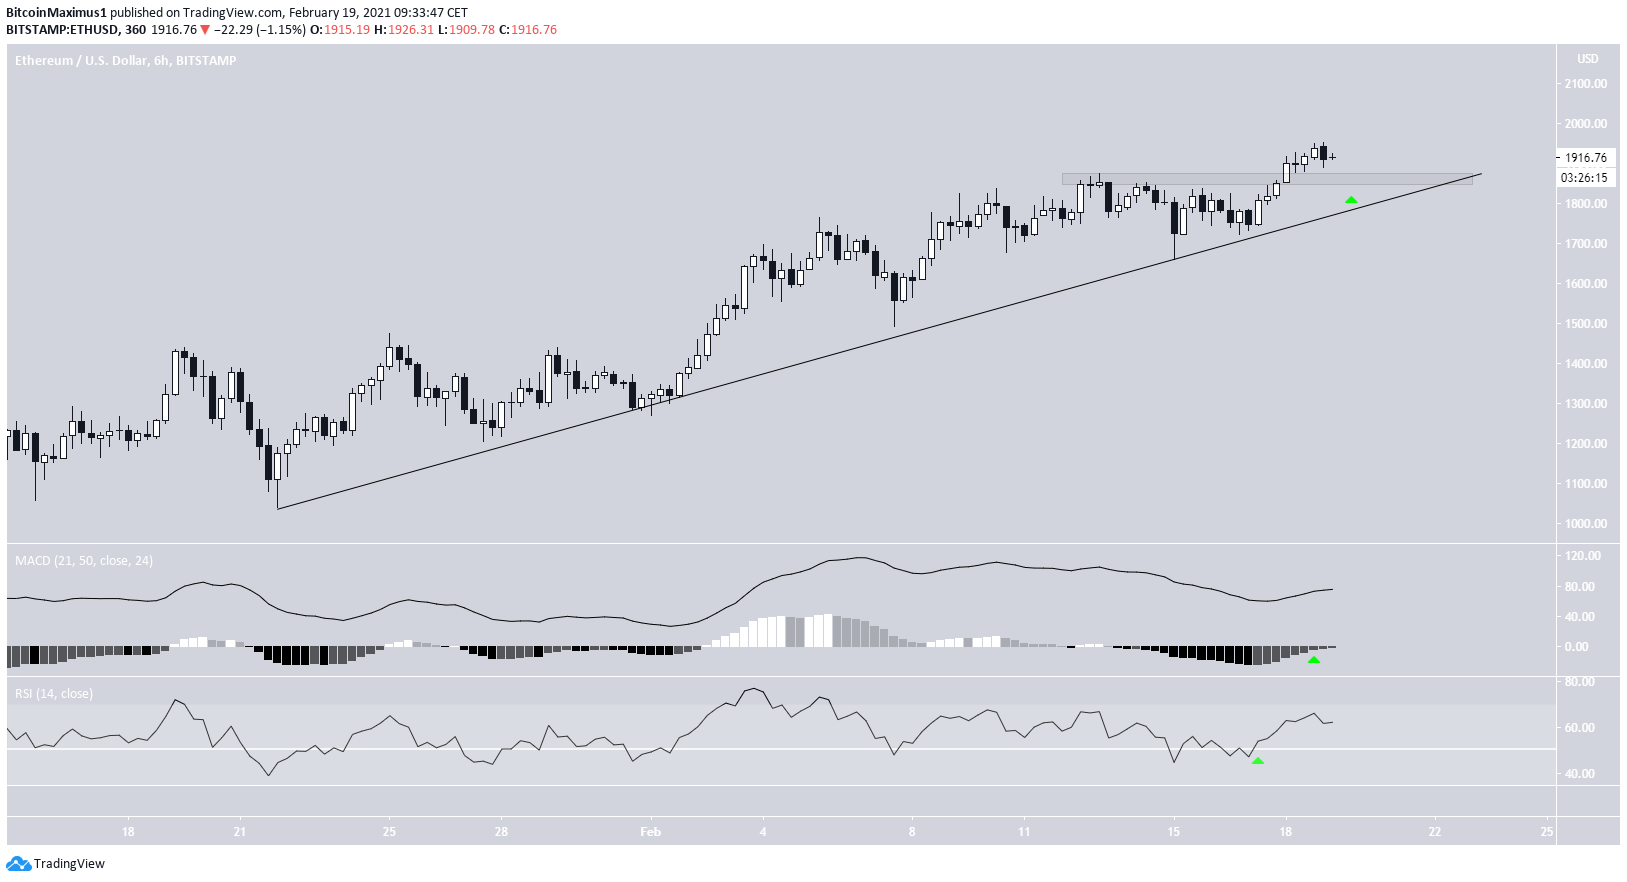
Ethereum (ETH)
ETH has been following an ascending support line since Jan. 21. The line has been validated multiple times — most recently on Feb. 16.
After bouncing on Feb. 16, ETH proceeded to reclaim the $1,850 resistance area to reach an all-time high price of $1,951. Currently, ETH is in the process of retracing, potentially validating the $1,850 area as support.
Technical indicators are bullish. The RSI has bounced at the 50-line and the MACD histogram has nearly crossed into positive territory.
After a potential bounce, ETH would be expected to continue increasing toward $2,250.
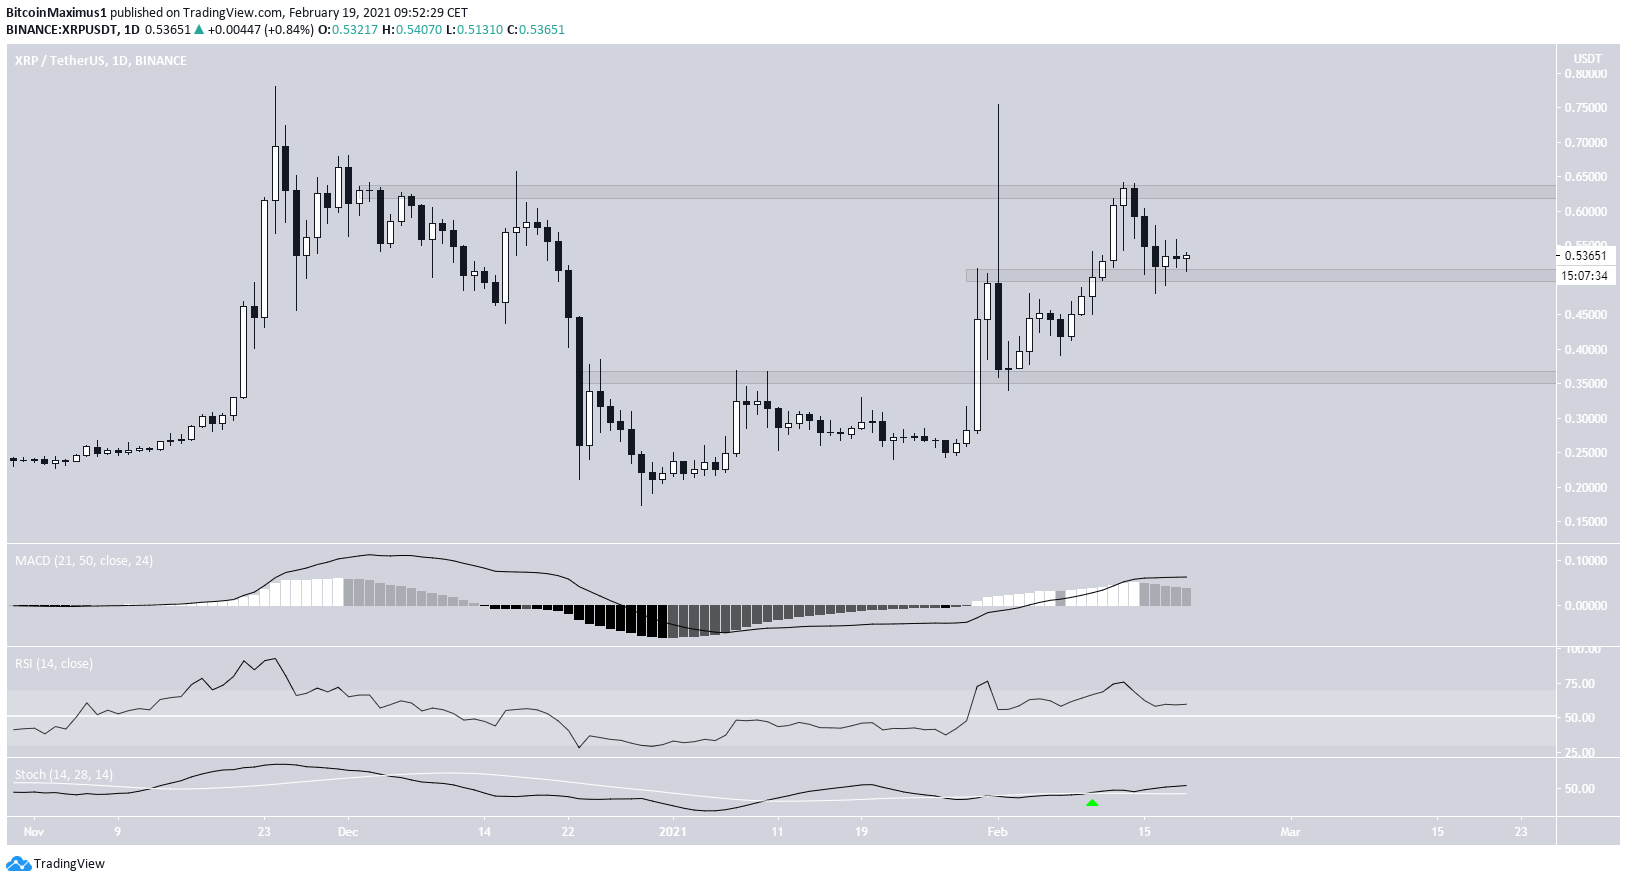
XRP (XRP)
XRP has been decreasing since Feb. 13, when it reached a local high of $0.642. The decrease has taken it to the $0.51 support area, creating several lower wicks — a sign of buying pressure.
Technical indicators are fairly bullish. The RSI is above 50 and the Stochastic oscillator has made a bullish cross. However, they are showing a clear lack of momentum.
Thus, it’s likely that XRP consolidates for a bit before potentially breaking out above the $0.62 resistance. This is also a long-term resistance level.
If XRP were to break down, the next closest resistance area would be found at $0.36.
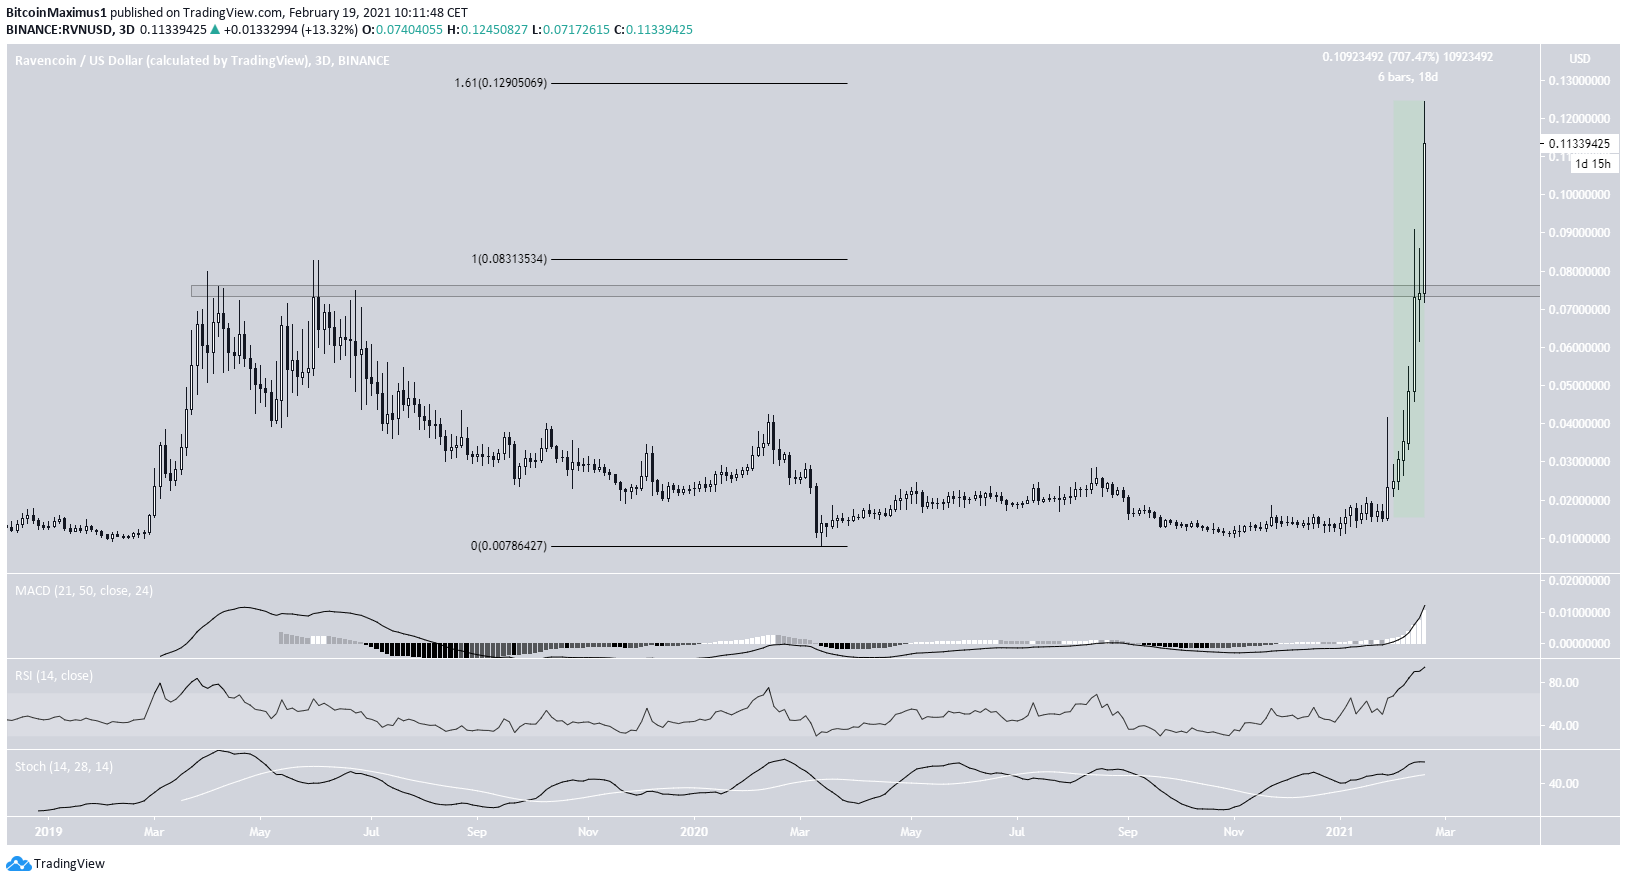
Ravencoin (RVN)
RVN has been increasing rapidly since Jan. 28. It has moved upwards by 700% in just 18 days. So far, it has reached an all-time high price of $0.123.
The rate of increase further accelerated once RVN broke out from the $0.075 area. This level had been acting as resistance since March 2019.
Since RVN is in price discovery, we need to use an external Fib retracement on the most recent downward movement in order to find the next resistance area. Doing that gives us a resistance at $0.129 — very close to the current price.
Technical indicators are bullish though, making it likely that the trend is also bullish.
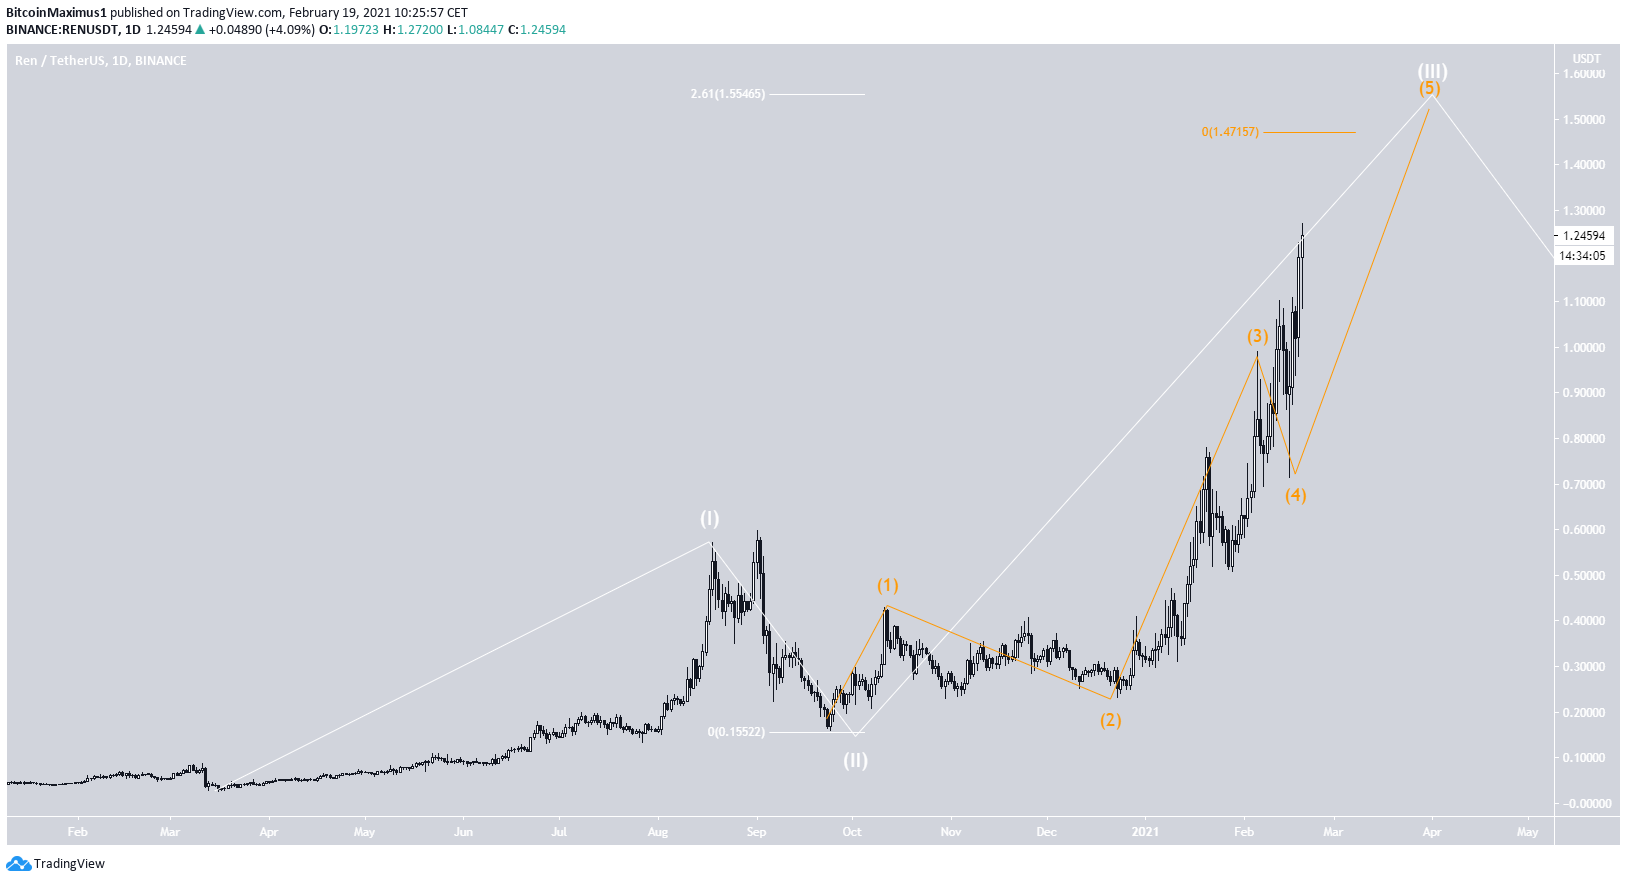
Ren (REN)
Similar to RVN, REN has increased considerably over the past two weeks to reach an all-time high price of $1.27.
REN seems to be in a bullish trend. It’s currently in an extended wave three (white) of a bullish impulse that began in March 2020.
However, REN seems to be approaching the top of its upward movement, which has a likely top target of $1.47-$1.55. After that, REN would be expected to correct in wave four.
The sub-wave count is shown in orange.
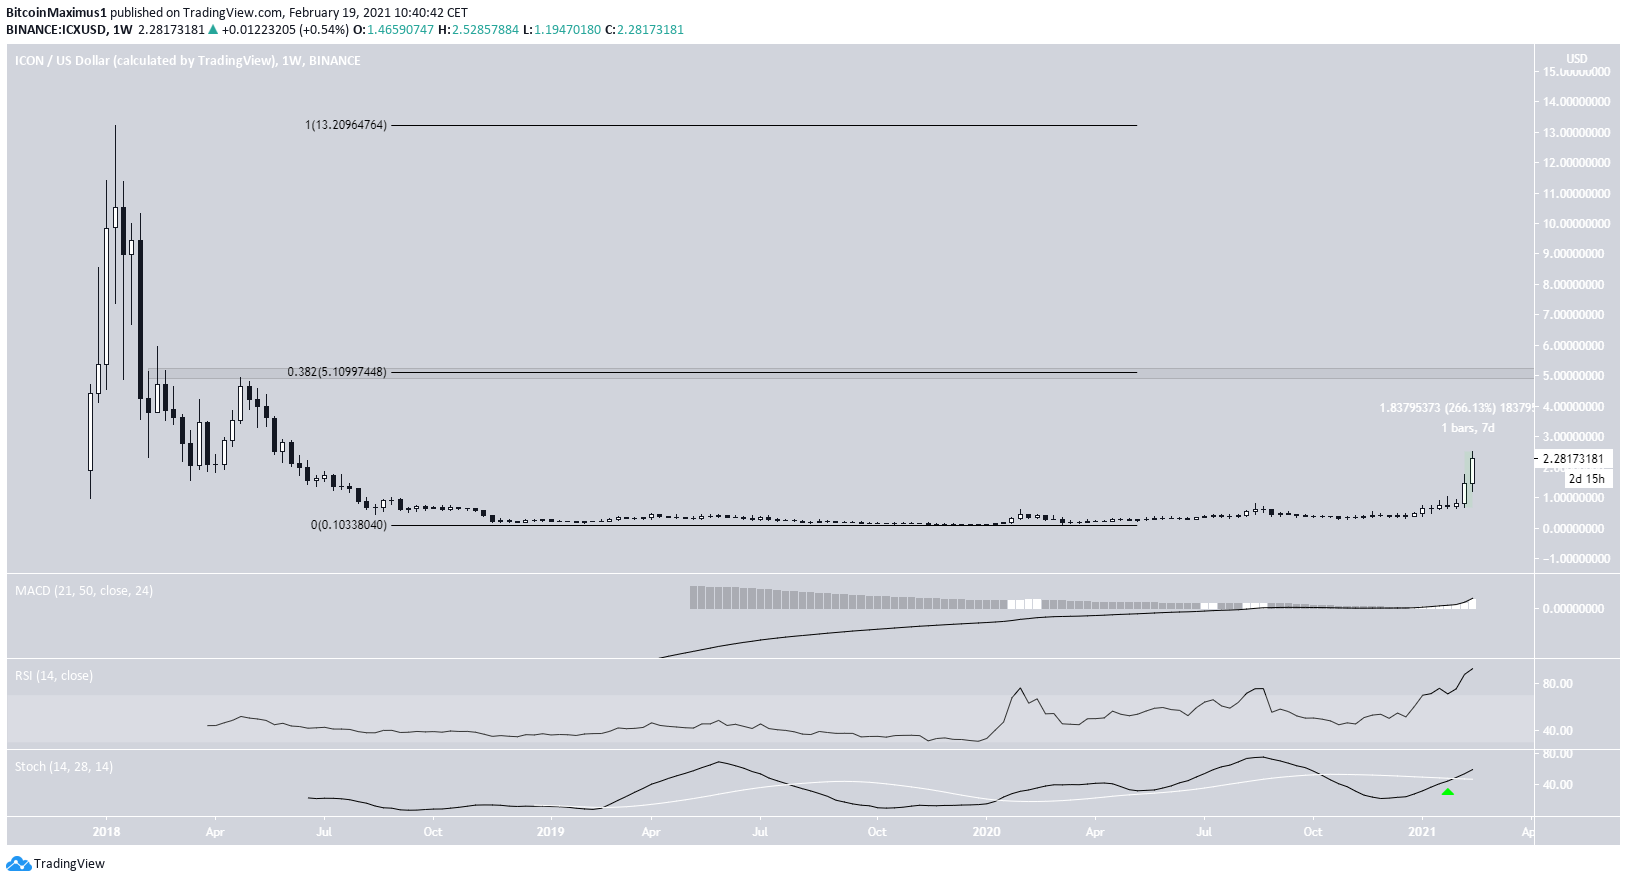
ICON (ICX)
ICX has increased considerably over the past two weeks, going from a low of $0.69 to a high of $2.52 in the process. This amounted to a 266% increase in roughly two weeks.
Technical indicators are bullish and support the continuation of the upward movement. This is especially evident by the bullish cross in the Stochastic oscillator.
The next closest resistance area is found at $5.10. This is the 0.382 Fib retracement level of the entire downward movement measuring from the all-time high price of $13.20.
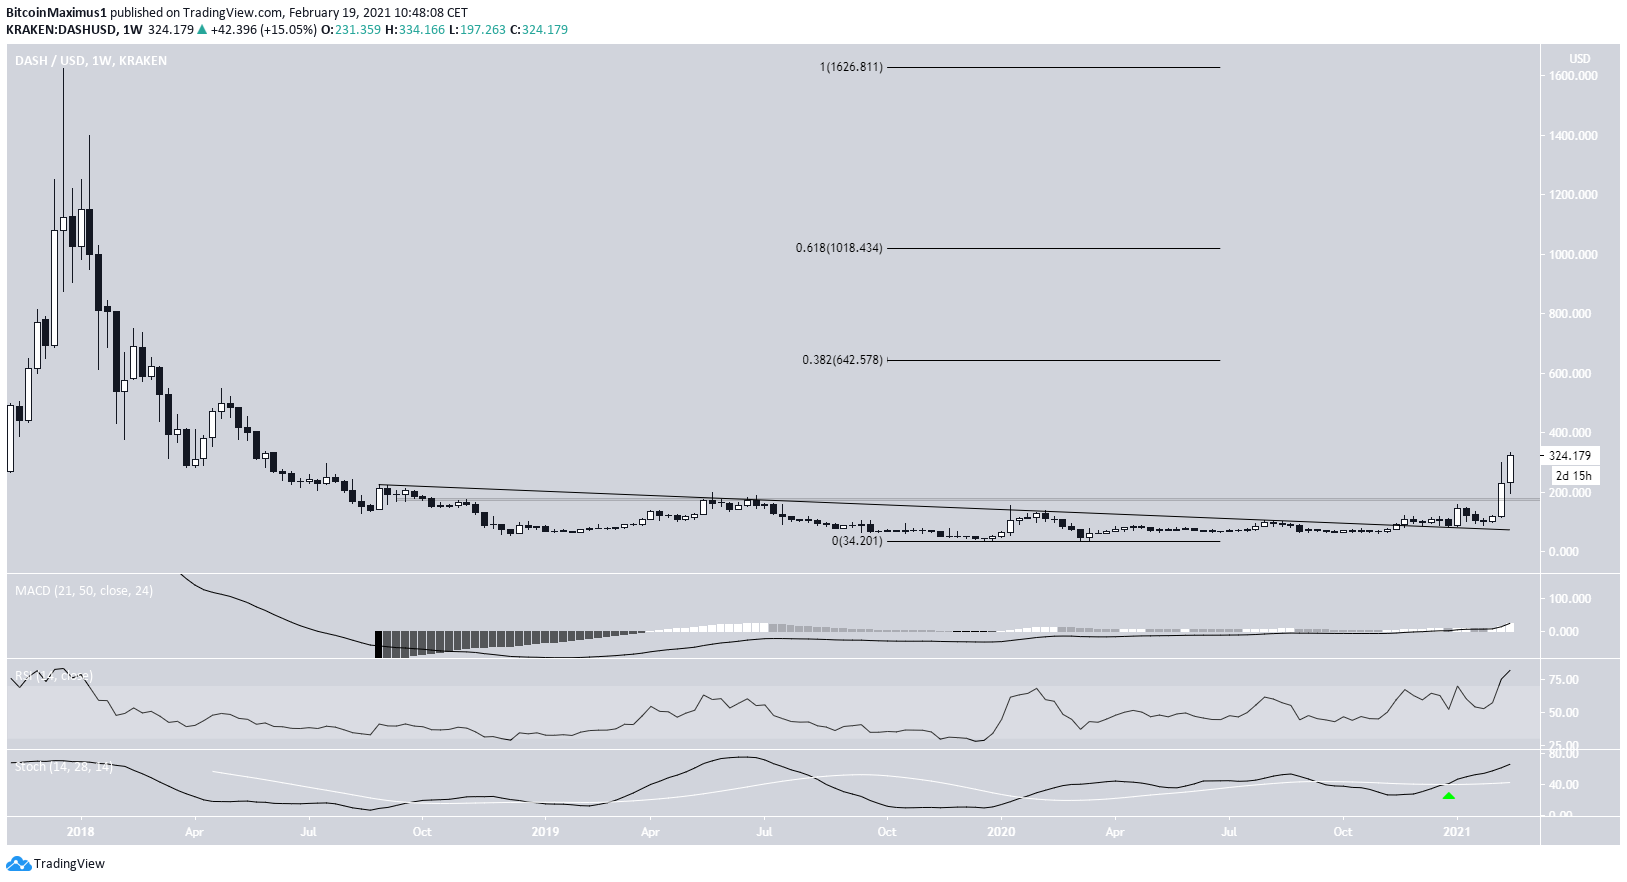
DASH (DASH)
Similar to ICX, DASH has increased considerably over the past two weeks, creating two massive bullish candlesticks in a row. The movement was preceded by a breakout above a long-term descending resistance line.
The rate of increase accelerated once DASH moved above the $175 resistance area, which had previously been in place for more than two years.
Furthermore, technical indicators are bullish. This is evidenced by the bullish cross in the Stochastic oscillator and the RSI cross above 70.
The next closest resistance area is found at $642. This is the 0.382 Fib retracement level of the entire downward movement measuring from the all-time high price of $1,626.
For BeInCrypto’s latest Bitcoin (BTC) analysis, click here
Trusted
Disclaimer
In line with the Trust Project guidelines, this price analysis article is for informational purposes only and should not be considered financial or investment advice. BeInCrypto is committed to accurate, unbiased reporting, but market conditions are subject to change without notice. Always conduct your own research and consult with a professional before making any financial decisions. Please note that our Terms and Conditions, Privacy Policy, and Disclaimers have been updated.
