

Bitcoin (BTC) has broken out from a descending parallel channel.
Ethereum (ETH) and XRP (XRP) are in wave five of their respective bullish impulses.
Near Protocol (NEAR) has broken out from a descending resistance line.
Monero (XMR) is following an ascending support line.
Cocos-BCX (COCOS) is trading inside a descending parallel channel.
Chromia (CHR) is trading inside an ascending wedge.
BTC
BTC had been decreasing inside a descending parallel channel since Aug 29. Such channels usually contain corrective structures.
It bounced at the $46,800 horizontal support area on Sept 1 and broke out later that day. Both the MACD and RSI are bullish, giving validity to the breakout.
However, BTC is still trading below the $51,200 horizontal resistance area.

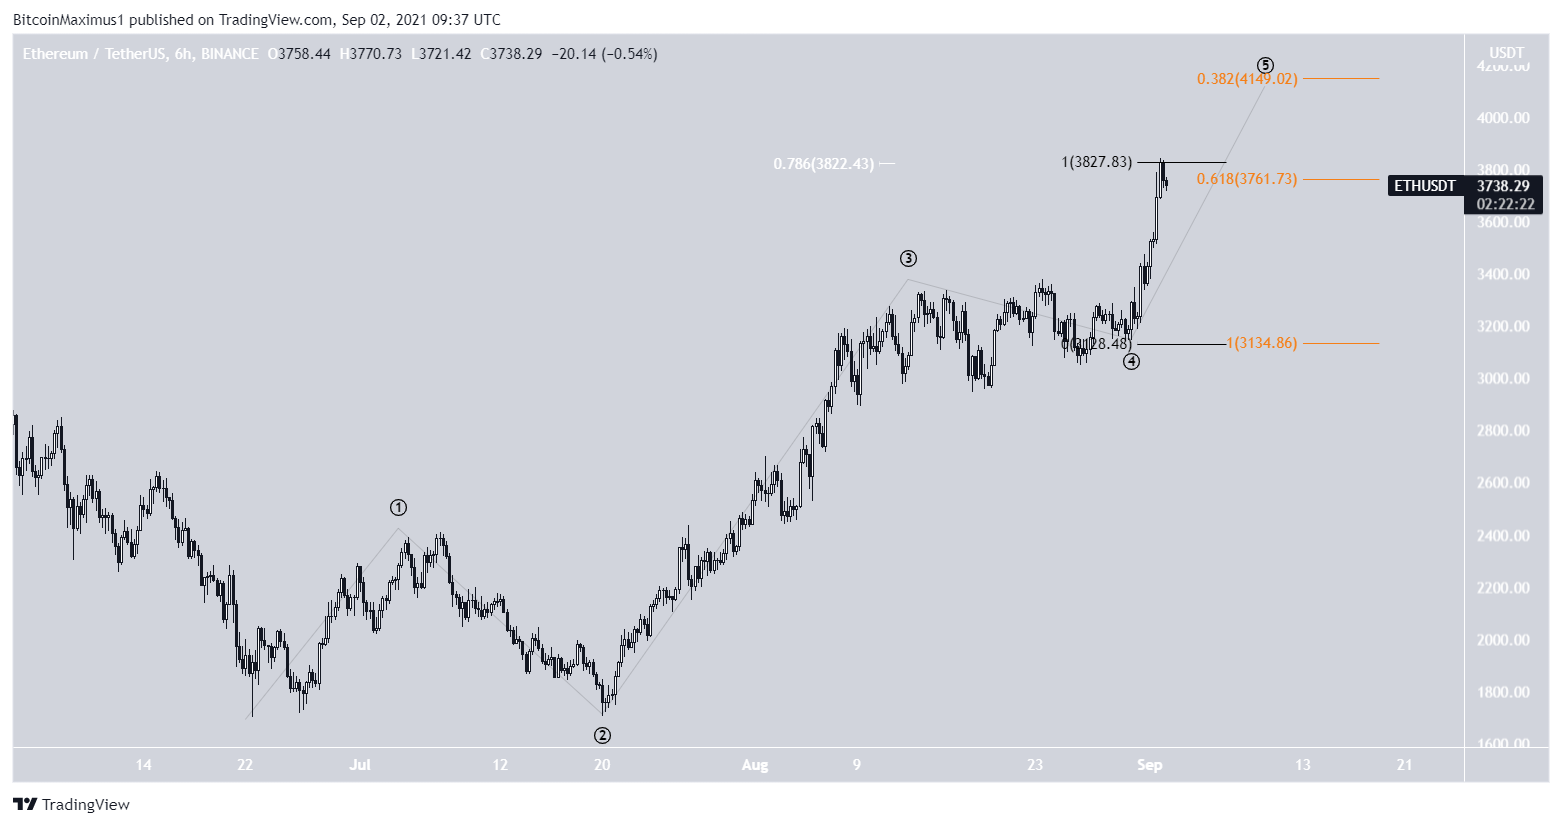
ETH
ETH has been increasing since July 20. While the rally stalled between Aug 13 and Aug 31, ETH broke out on the latter date and has been moving upwards since.
So far, it has reached a high of $3,956 on Sept 3.
It seems that ETH is in wave five of a bullish impulse. Furthermore, it’s trading at a confluence of Fib targets, given by the:
- 0.786 Fib retracement resistance level (white)
- Length of wave one (black)
- 0.382 length of waves 1-3 (orange).
If ETH continues upwards, the next resistance would likely be found between $4,150-$4,254.
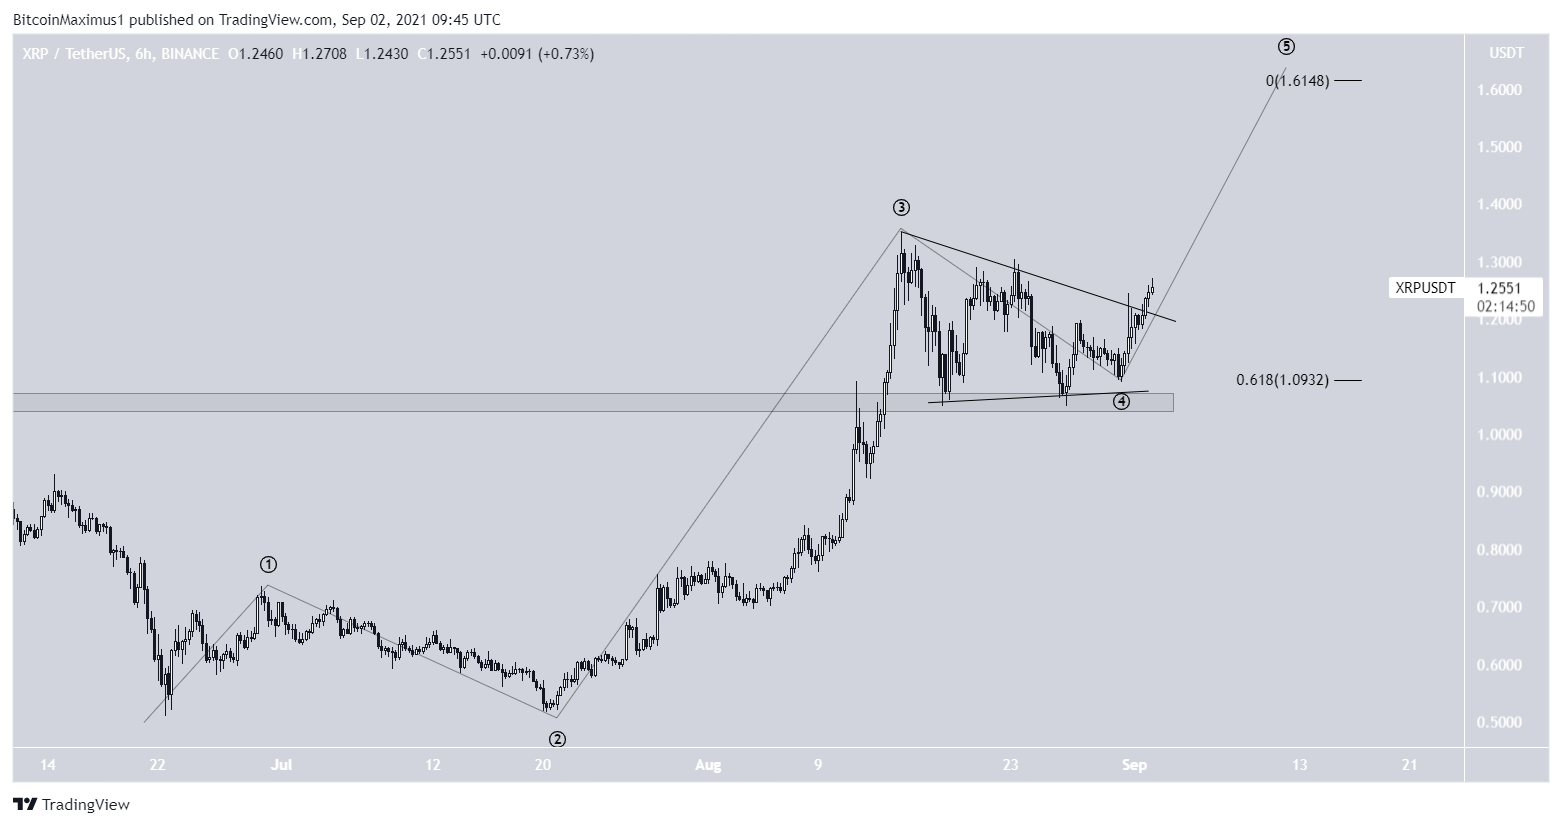
XRP
XRP has been moving upwards since July 20. On Aug 13, it broke out above the $1.05 horizontal area before validating it as support.
It consolidated inside a symmetrical triangle, which was likely the fourth wave of a bullish impulse.
A potential target for the top of the entire upward move is $1.65. The target is found using the 0.618 length of waves 1-3. In addition to this, it coincides with a horizontal resistance area.
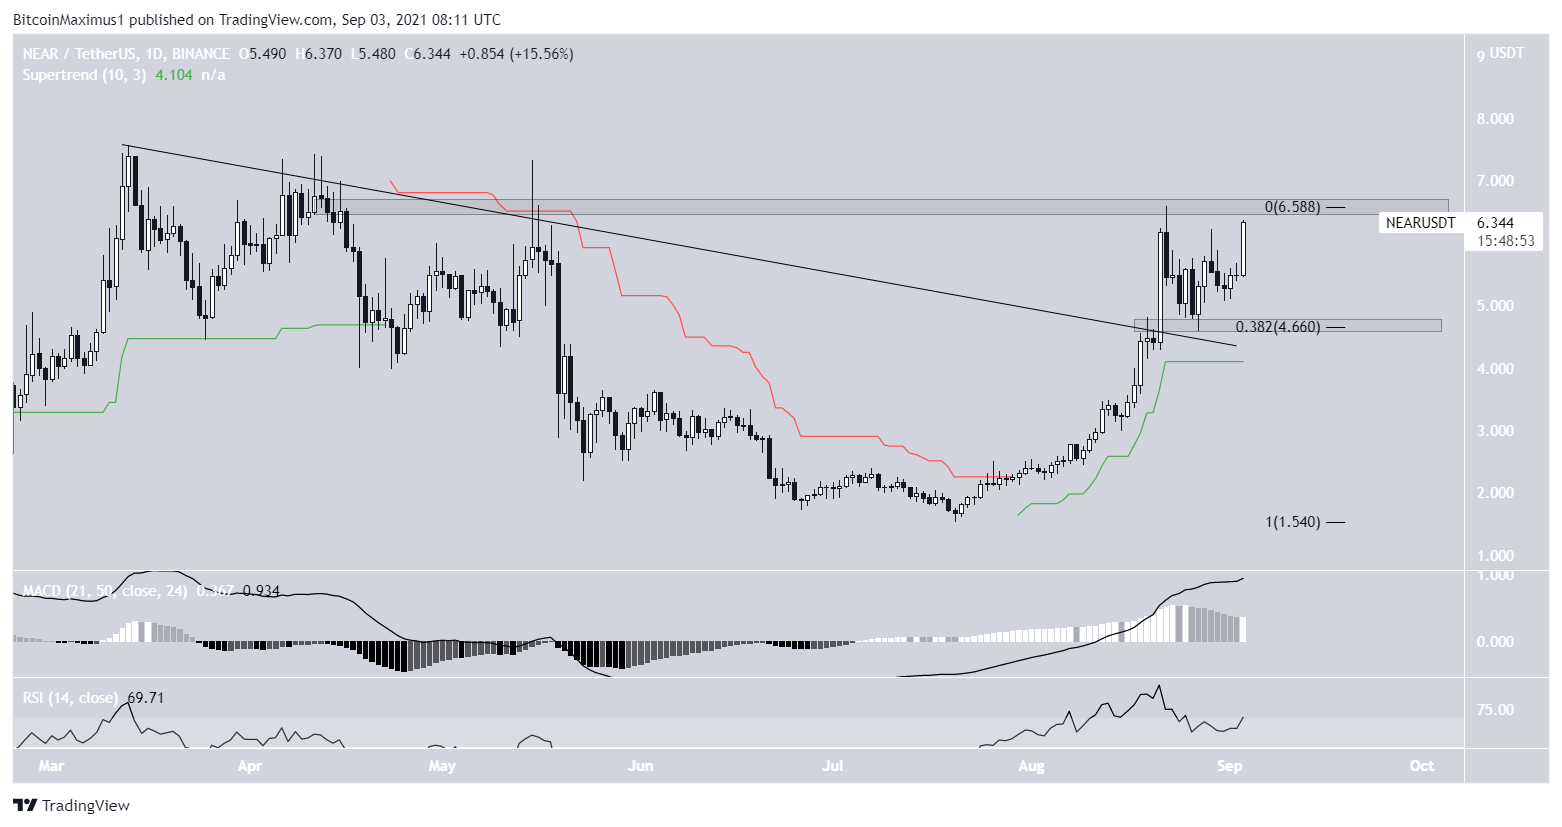
NEAR
NEAR has been following a descending resistance line since March 13. On Aug 18, it managed to break out and reached a high of $6.59 four days later.
However, it was rejected by the $6.60 horizontal resistance area.
The rejection caused it to validate both the $4.66 horizontal support area and the previous resistance line as support.
However, technical indicators are relatively neutral. While the MACD is losing strength, it’s still positive and the RSI is above 50. Furthermore, the supertrend is bullish.
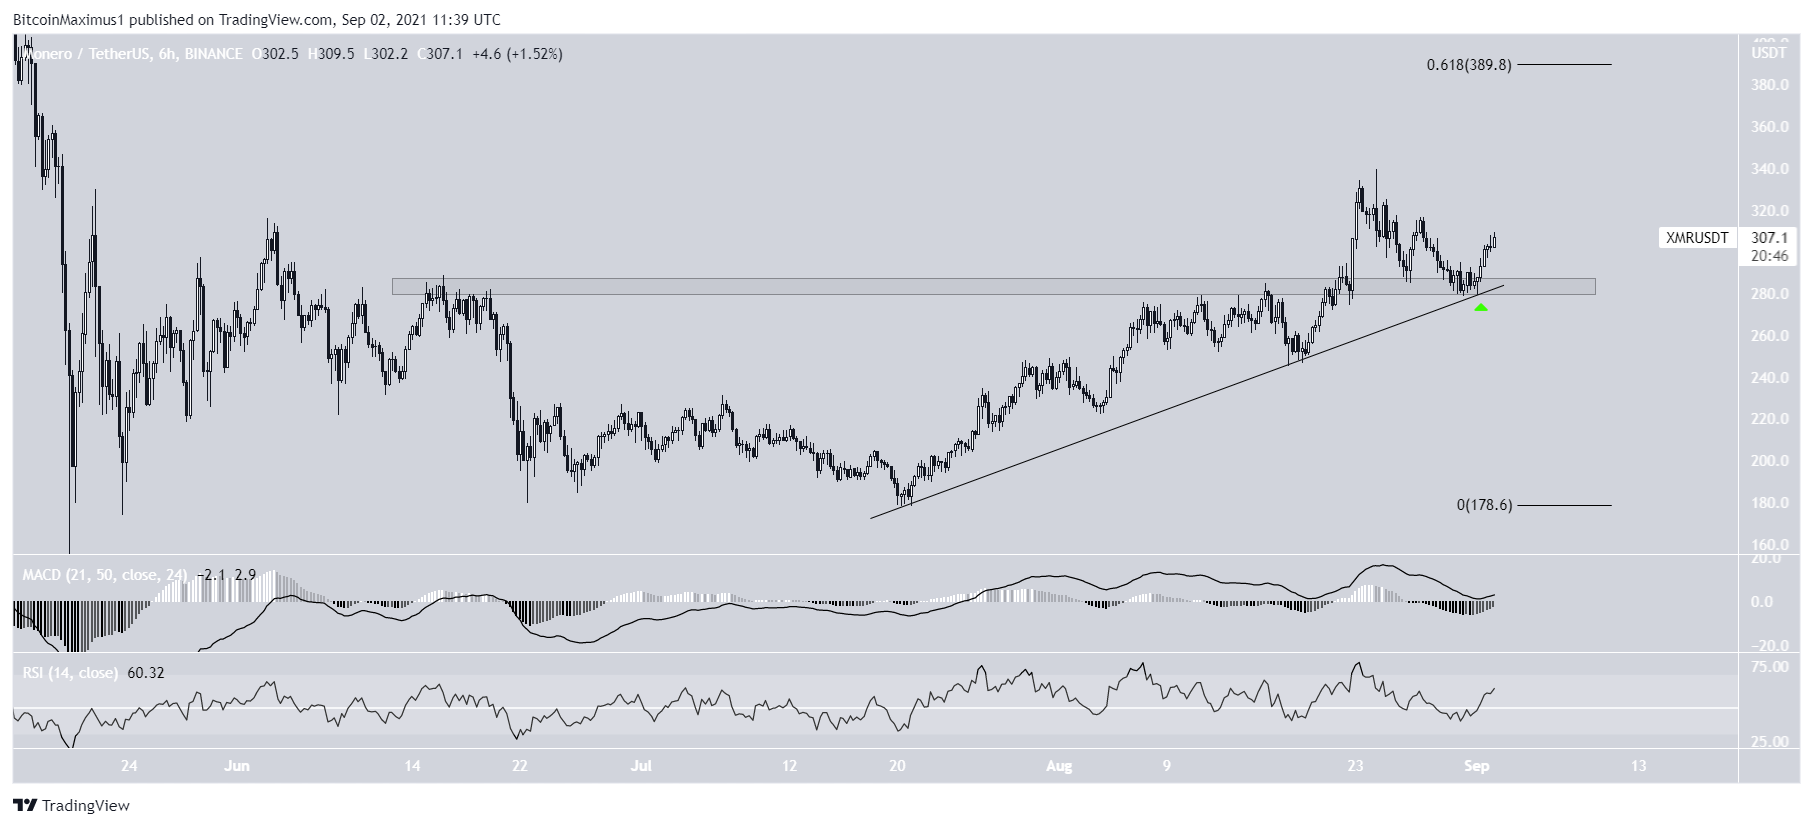
XMR
XMR has been following an ascending support line since July 20. After breaking out from the $283 horizontal resistance area, it returned in order to validate it as support on Aug 31 (green icon). The touch of the area also coincided with the ascending support line.
XMR has been moving upwards since. The increase is supported by the bullish MACD and RSI. The next closest resistance area is found at $390. This target is the 0.618 Fib retracement resistance level.
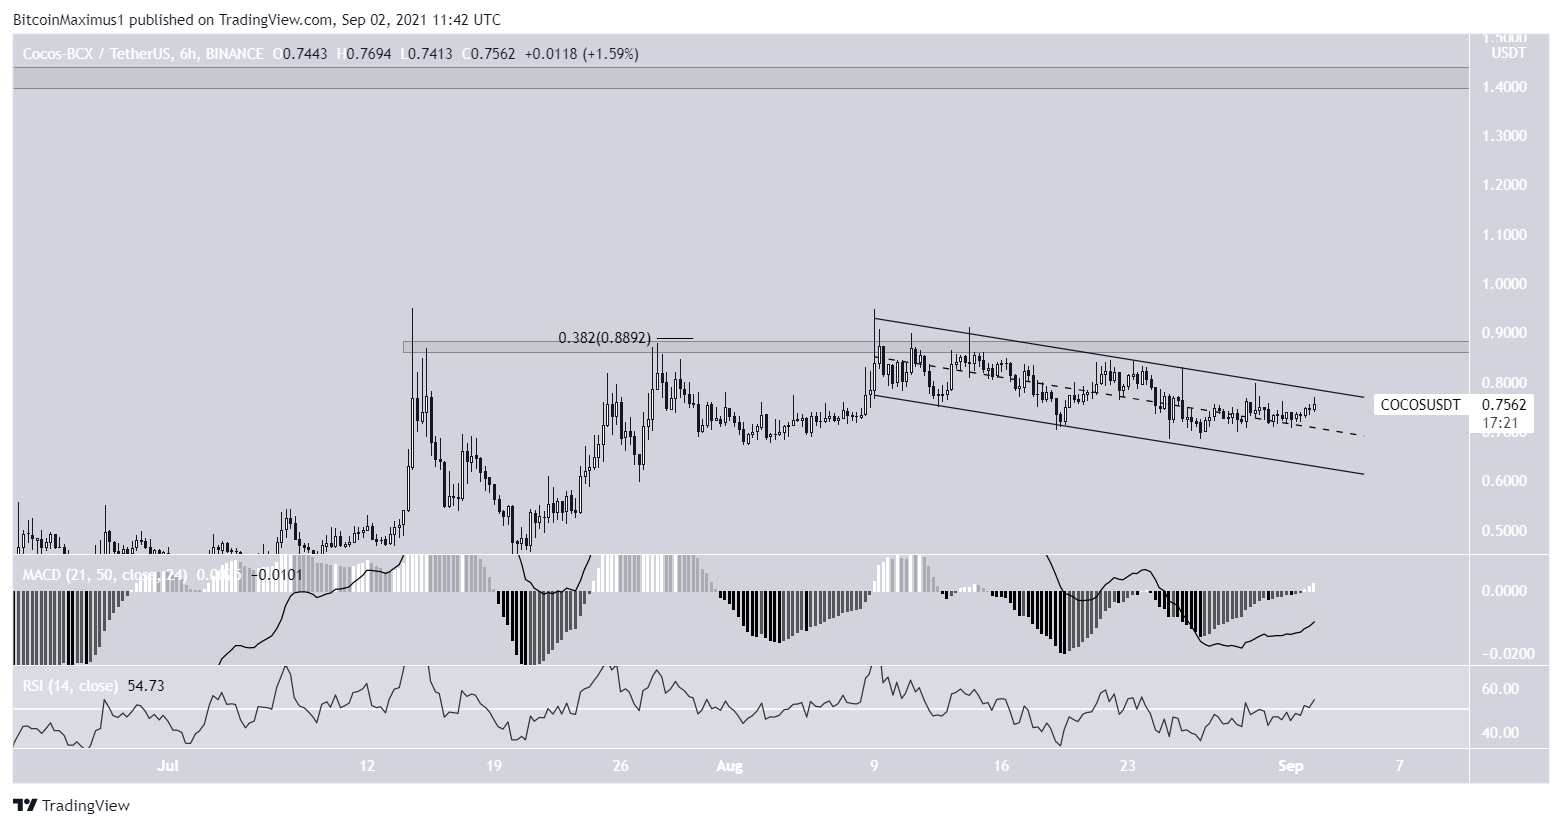
COCOS
Similar to BTC prior to its breakout, COCOS is trading inside a descending parallel channel. It has been doing so since it was rejected by the $0.88 resistance area on Aug 9.
It is currently trading in the upper portion of the channel and is rapidly approaching the resistance line.
The MACD and RSI both support the possibility of a breakout.
If COCOS manages to break out from both the channel and the $0.88 area, the next resistance would be found at $1.42.
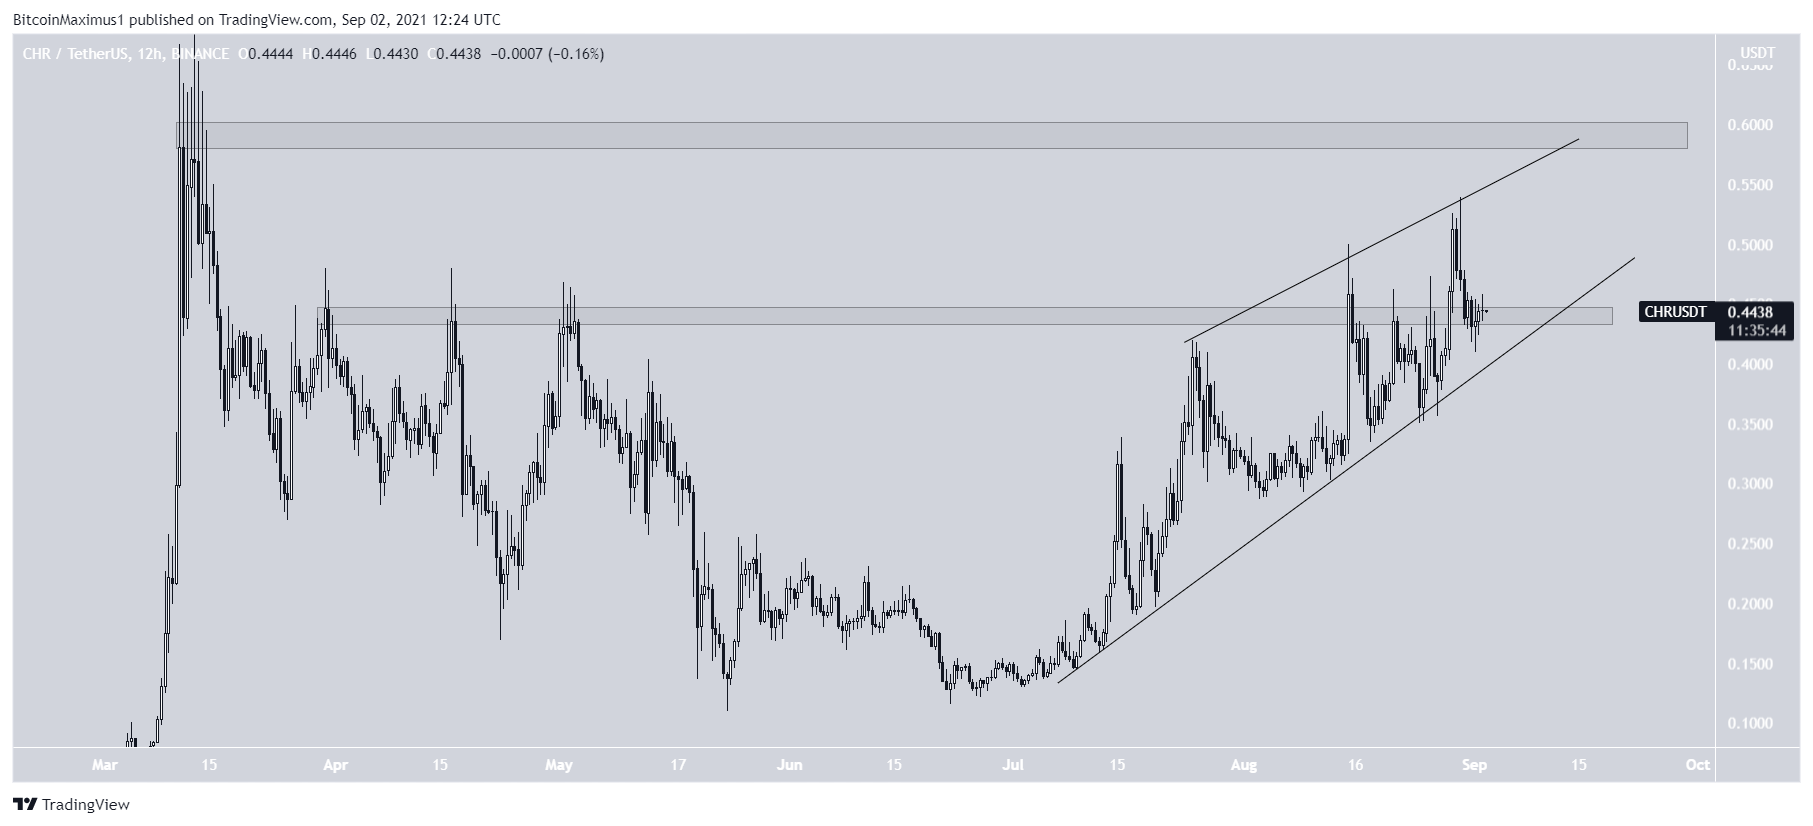
CHR
CHR has been increasing since July 8. However, it’s trading inside an ascending wedge formation, which is normally considered a bearish pattern.
In addition to this, the resistance line of the wedge coincides with the $0.60 horizontal resistance area.
Therefore, while CHR could increase and reach this resistance, a breakout at the current time seems unlikely.
For BeInCrypto’s latest Bitcoin (BTC) analysis, click here.
Trusted
Disclaimer
In line with the Trust Project guidelines, this price analysis article is for informational purposes only and should not be considered financial or investment advice. BeInCrypto is committed to accurate, unbiased reporting, but market conditions are subject to change without notice. Always conduct your own research and consult with a professional before making any financial decisions. Please note that our Terms and Conditions, Privacy Policy, and Disclaimers have been updated.
