

Bitcoin (BTC) and Ethereum (ETH) have been increasing since breaking out from short-term resistance lines on March 1, 2021.
XRP (XRP) is trading in a range between $0.36 – $0.63, currently being very close to the former.
EOS (EOS) has broken out from a horizontal resistance area before returning to it, potentially validating it as support. However, it has yet to initiate a bounce.
TRON (TRX) and Dash (DASH) have broken out from long-term resistance areas at $0.043 and $185 respectively and validated them as support after.
Similarly, Litecoin (LTC) is in the process of validating the $170 area as support.
Bitcoin (BTC)
On March 1, 2021, Bitcoin broke out from a descending wedge and has been moving upwards since. So far, BTC has reached a local high of $50,200 before decreasing slightly.
The MACD and RSI are both bullish. The former has nearly crossed into positive territory while the latter has already moved above 50.
The main resistance area is found between $50,659-$52,485. A breakout above this range would confirm that the trend is bullish.

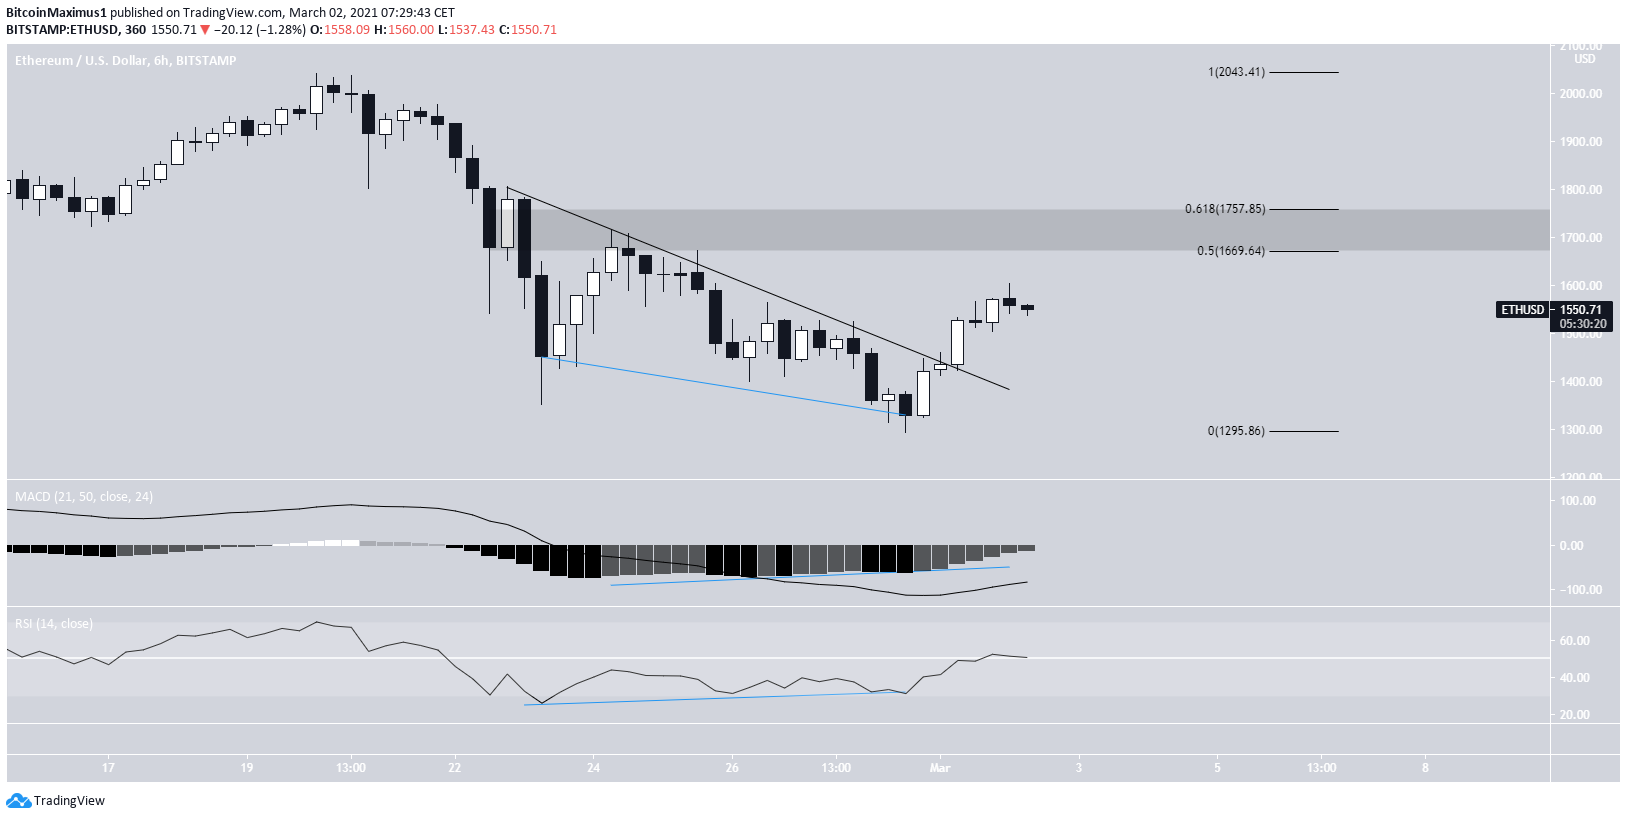
Ethereum (ETH)
Similar to BTC, ETH broke out from a short-term descending resistance line on March 1 and has been moving upwards since.
The breakout was preceded by considerable bullish divergence in both the RSI and MACD.
Nevertheless, ETH has yet to reach the main resistance area found between the 0.5-0.618 Fib retracement levels at $1,600-$1,750.
Until ETH breaks out above the area and validates it as support, we cannot consider the short-term trend bullish.
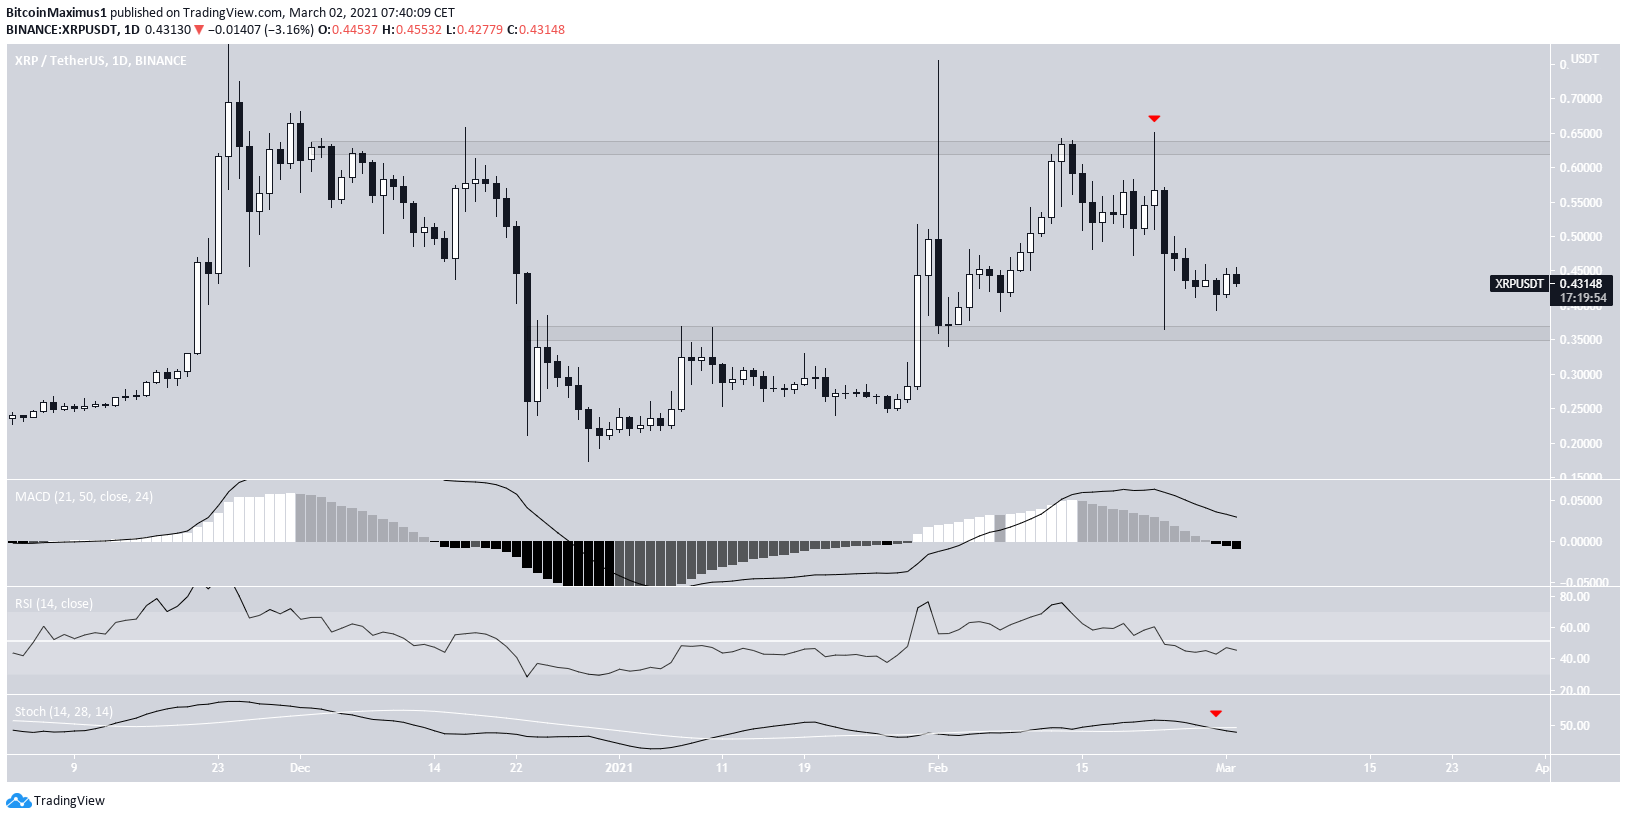
XRP (XRP)
XRP has been decreasing since being rejected by the $0.63 resistance area on Feb. 22. XRP reached an actual high of $0.65 but created a long upper wick and has been moving downwards since.
At the time of press, XRP was approaching the $0.36 support area.
Technical indicators are bearish, as evidenced by the bearish cross in the Stochastic oscillator and the RSI decrease below 50.
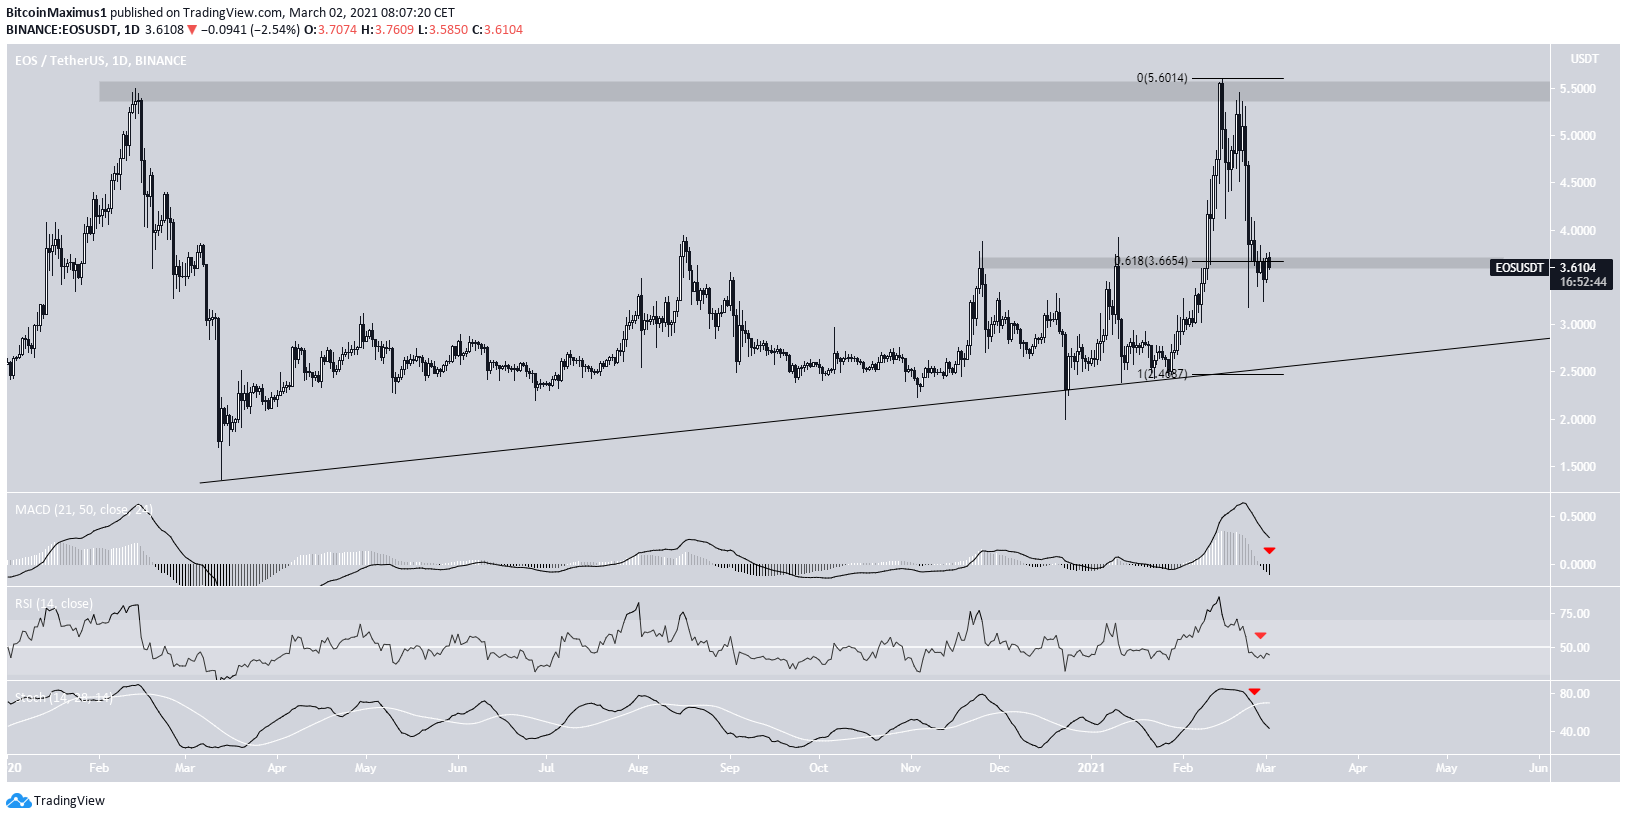
EOS (EOS)
EOS has been decreasing since it was rejected by the long-term $5.50 resistance area on Feb. 14.
The decrease has taken it all the way to the $3.65 area, which previously acted as resistance and is now expected to act as support. The area is also the 0.618 Fib retracement level of the most recent upward move.
Despite being at support, EOS has failed to initiate a bounce. Furthermore, technical indicators are bearish and fail to confirm a reversal.
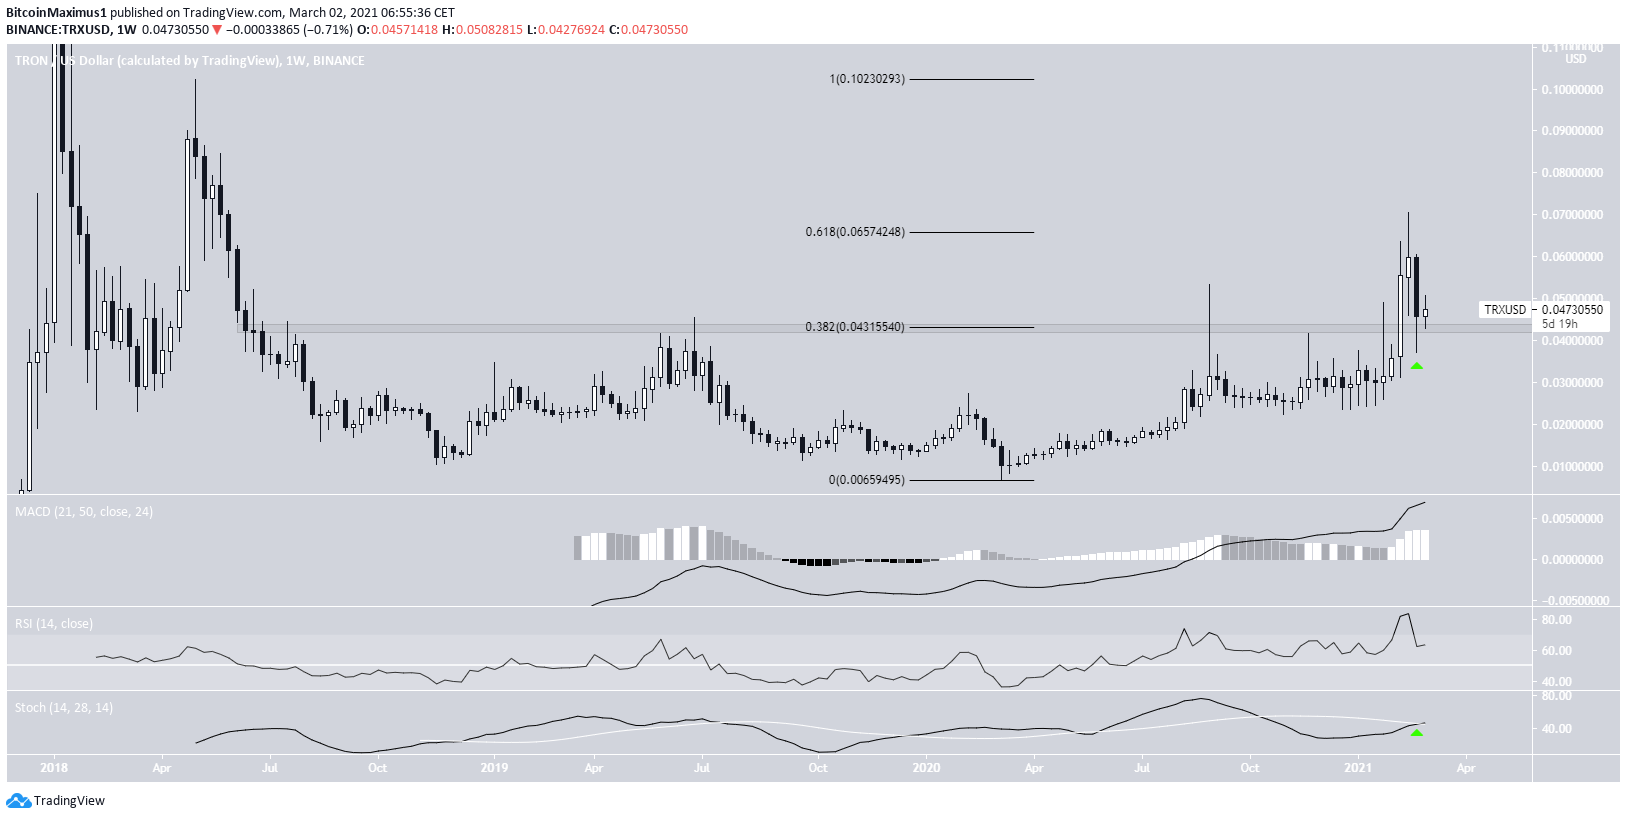
TRON (TRX)
TRX has been decreasing since Feb. 19, when it reached a local high of $0.045. The drop took it to a local low of $0.038 on Feb. 23.
Despite the significant decrease, TRX has created a lower wick in higher time-frames and managed to hold on above the $0.043 area.
The area previously acted as resistance for more than two years but has now been validated as support. As long as TRX is trading above this level, the trend is considered bullish.
Technical indicators support this scenario. The MACD, RSI, and Stochastic oscillator are all increasing.
If TRX manages to clear the $0.065 resistance area (0.618 Fib retracement level), the next resistance would be found at $0.10.
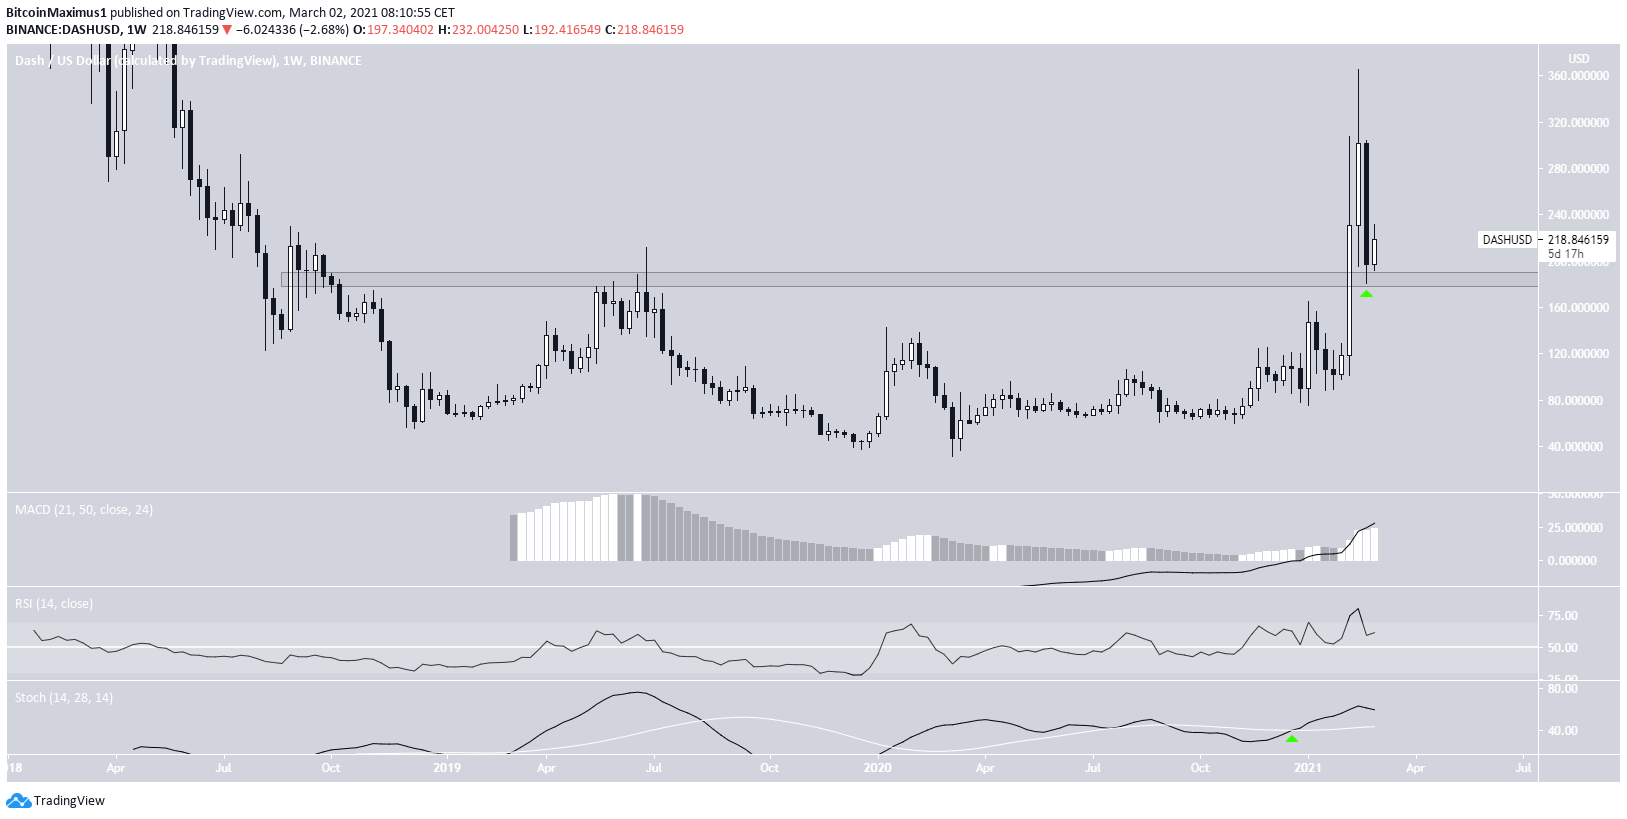
Dash (DASH)
DASH has been decreasing since reaching a high of $365 on Feb. 19. The drop has taken it back to the $185 area. This had previously been a resistance level since September 2018 until DASH finally broke out at the beginning of February 2020.
Therefore, the current drop looks like a validation of this level as support.
As long as DASH is trading above this level, the trend is considered bullish. This scenario is also supported by technical indicators, as evidenced by the bullish cross in the Stochastic oscillator
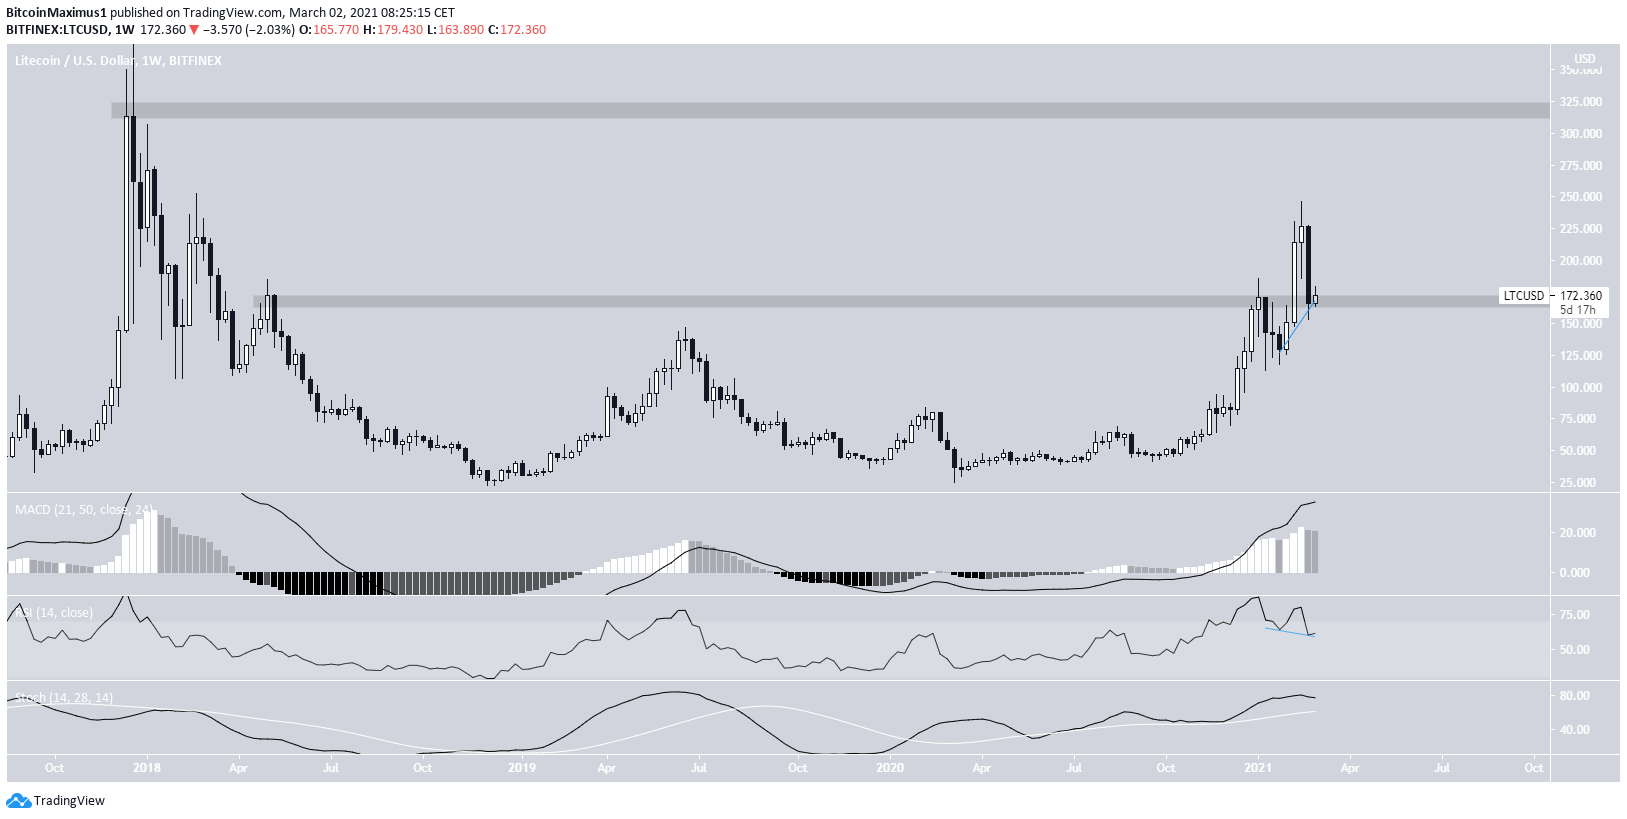
Litecoin (LTC)
LTC has been decreasing since a high of $246 was reached on Feb. 18. The drop has taken it all the way to the $170 area, which previously acted as a resistance. LTC is in the process of validating the area as support.
The MACD and Stochastic oscillator are increasing, and there is a hidden bullish divergence in the weekly RSI — a strong sign of trend continuation.
As long as LTC is trading above this level, it’s expected to continue increasing towards the previous high at $246 and potentially the all-time high resistance area at $315.
For BeInCrypto’s latest Bitcoin (BTC) analysis, click here.
Trusted
Disclaimer
In line with the Trust Project guidelines, this price analysis article is for informational purposes only and should not be considered financial or investment advice. BeInCrypto is committed to accurate, unbiased reporting, but market conditions are subject to change without notice. Always conduct your own research and consult with a professional before making any financial decisions. Please note that our Terms and Conditions, Privacy Policy, and Disclaimers have been updated.
