BTC is trading inside a range between $31,300 and $40,550.
XRP, BNB, and EGLD have broken out from descending resistance lines.
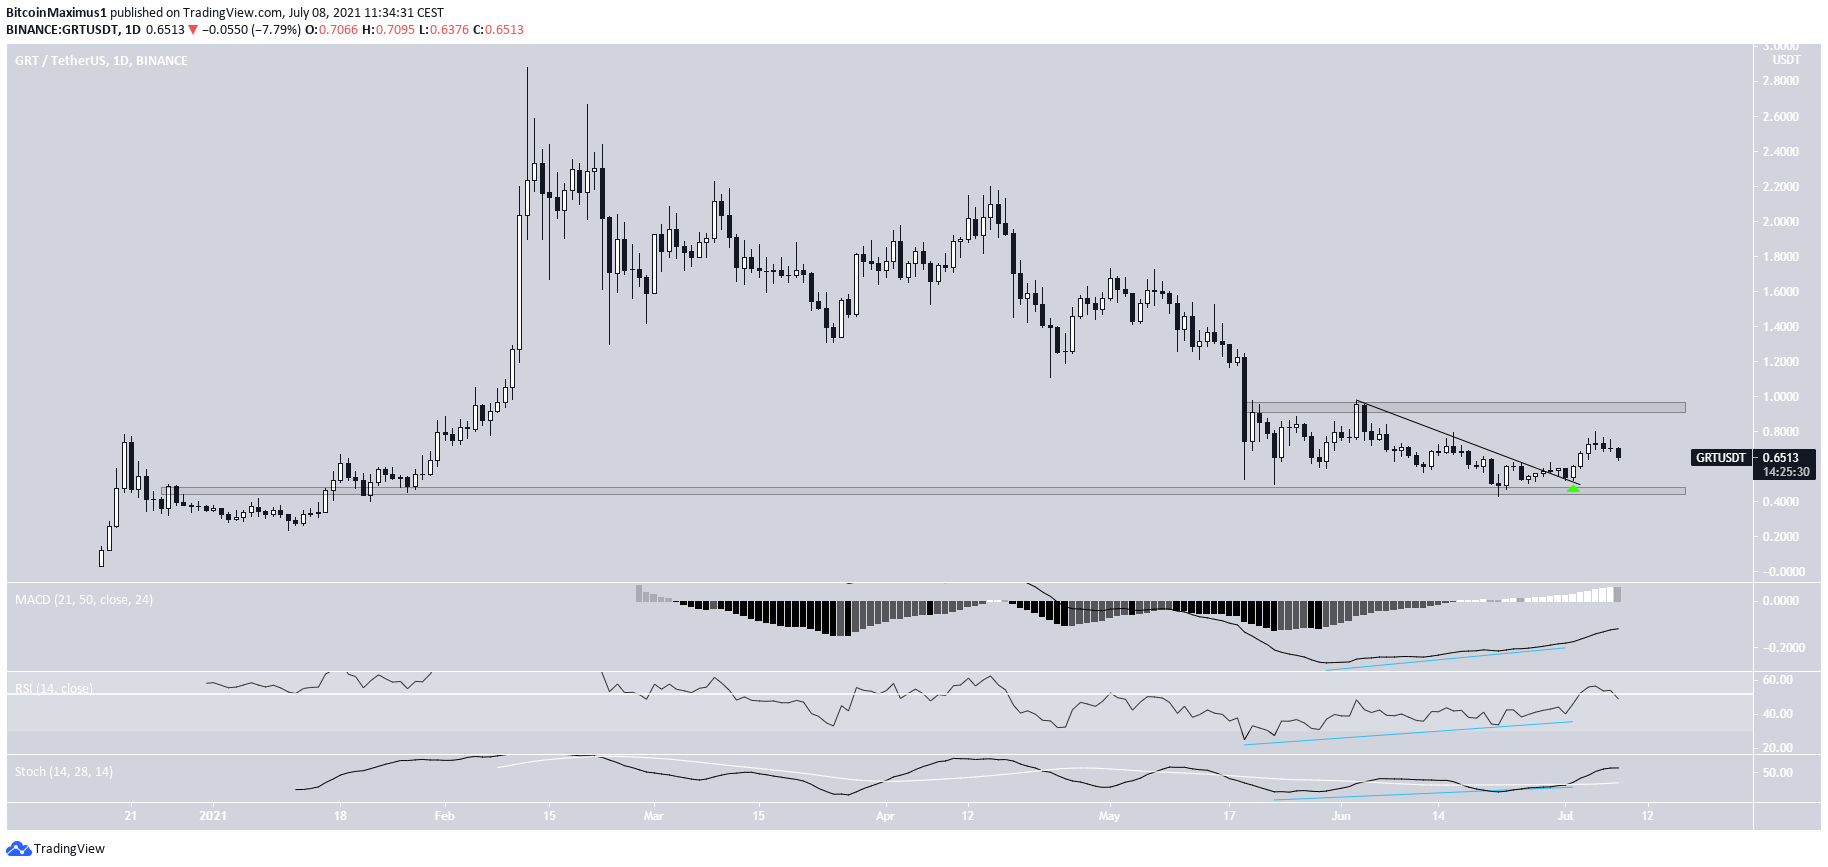
GRT has bounced at the long-term horizontal support area at $0.45.
promo
Bitcoin (BTC) is trading inside a range between $31,300 and $40,550.
Ethereum (ETH) is approaching the $1,982-$2,064 support area.
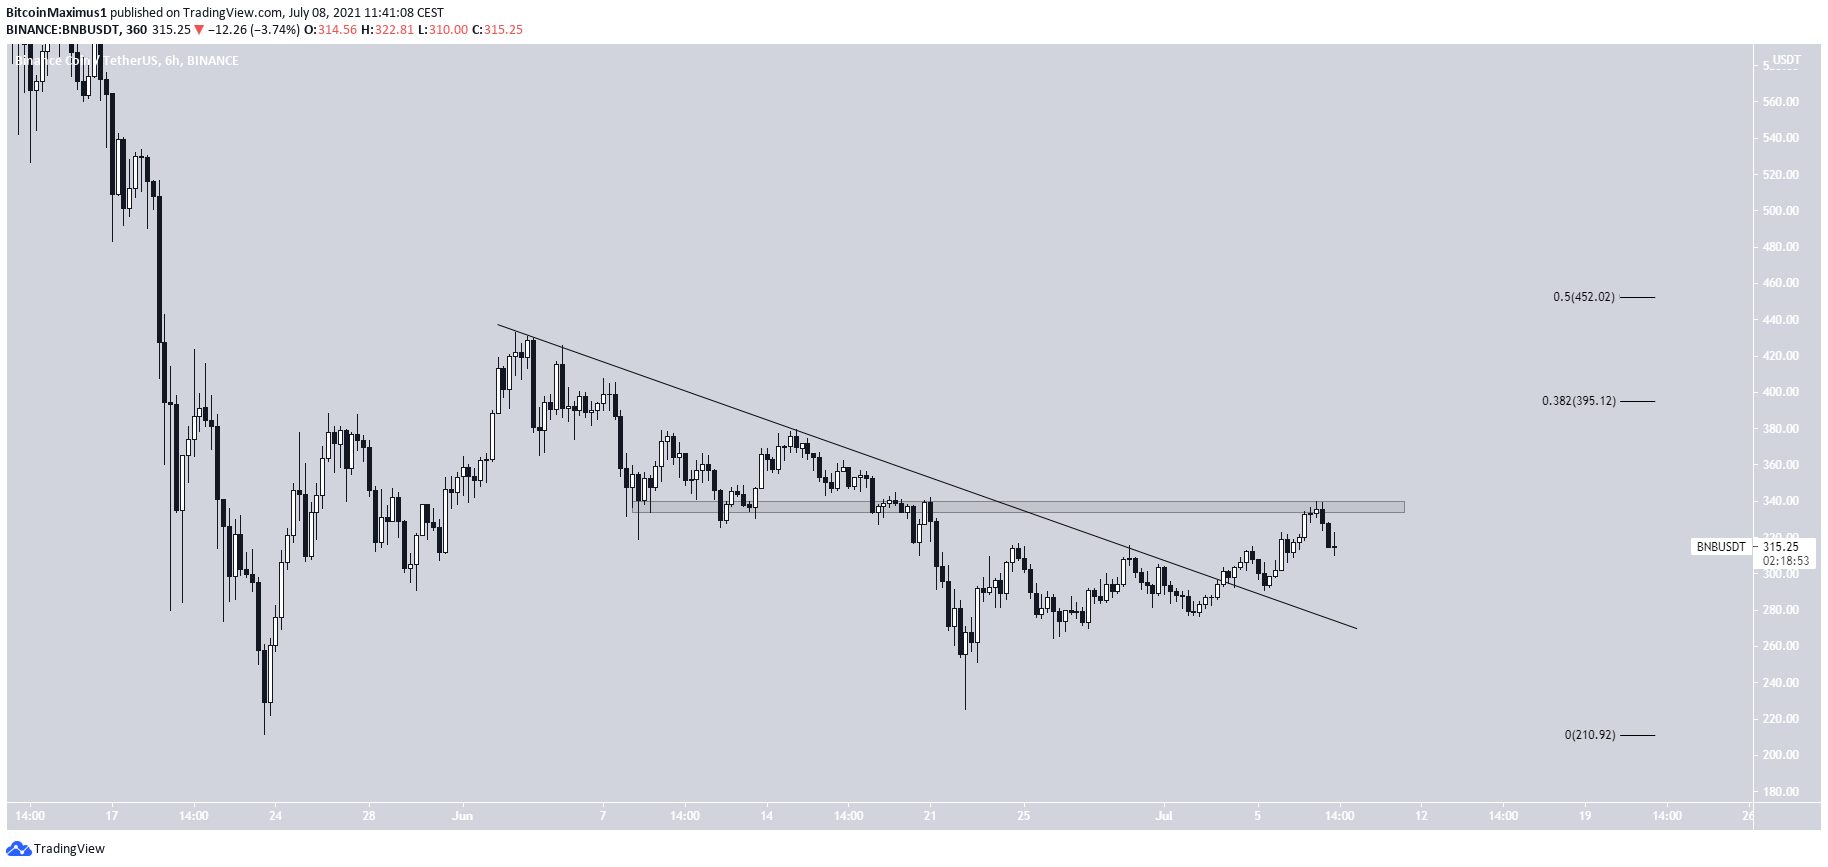
XRP (XRP), Binance Coin (BNB), and Elrond (EGLD) have broken out from descending resistance lines.
The Graph (GRT) has bounced at the long-term $0.45 horizontal support area.
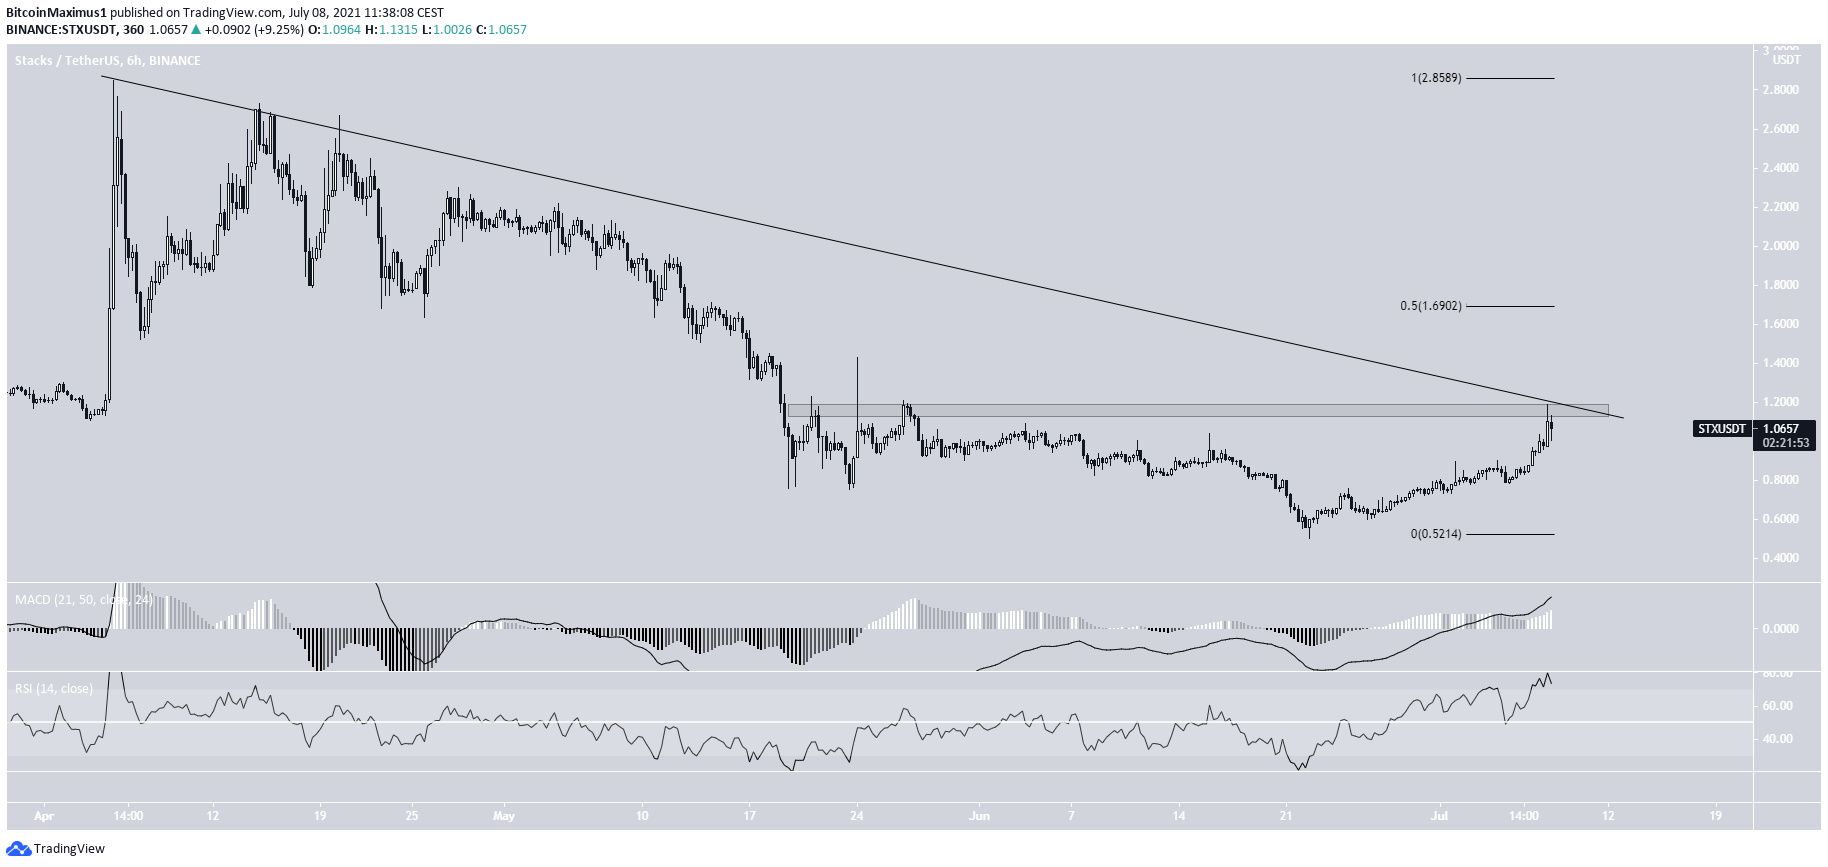
Stacks (STX) is attempting to break out from the $1.16 resistance area.
BTC
After another failed attempt at moving upwards on July 8, BTC created another long upper wick. It’s currently decreasing and has reached a daily low of $32,231.
BTC is still trading inside the same long-term range between $31,300 and $40,500. The upper part of the range is also the 0.382 Fib retracement resistance level.
The direction of the trend and short-term movement are undecided.
BTC Chart By TradingView
ETH
ETH has been increasing since June 22 after reaching a low of $1,700. The upward movement continued until a high of $2,410 was reached on July 7.
There is support between $1,982 and $2,064. These are the 0.5-0.618 Fib retracement support levels and a horizontal support area.
Short-term indicators provide a mixed outlook. The RSI is moving above and below the 50-line and the MACD line is close to 0.
There is long-term resistance at $2,725.
ETH Chart By TradingView
XRP
XRP had been following a descending resistance line since June 1 and managed to break out on July 4.
However, it has returned to the line to validate it as support. So far, it has touched the line twice (green icons), but has yet to begin moving upwards.
The closest resistance level is found between $0.80-$0.87. These targets are the 0.5-0.618 Fib retracement resistance levels.
Similar to ETH, technical indicators are undecided.
XRP Chart By TradingView
EGLD
EGLD reached a low of $53.41 on June 22. It broke out from a descending resistance line shortly after and proceeded to reach a high of $107.81 on July 5. EGLD has been moving downwards since.
The most likely support area is found at $80.50. This is the 0.5 Fib retracement support level and an ascending support line.
Conversely, the closest resistance is found at $120.
EGLD Chart By TradingView
GRT
On June 22, GRT reached a low of $0.428. This validated the $0.45 horizontal area as support and it began an upward move shortly after.
The upward movement was preceded by bullish divergences in the MACD signal line, RSI, and Stochastic oscillator.
GRT broke out from a descending resistance line and created a higher low on July 2 (green icon).
The closest resistance area is found at $0.94.
GRT Chart By TradingView
STX
STX has been increasing since June 22, after reaching a low of $0.50. On July 7, it made an attempt at breaking out above the $1.16 horizontal resistance area but was rejected. The area also coincides with a descending resistance line that has been in place since the April 2021 all-time high.
Both the MACD and RSI are bullish, even though they show an overbought rally.
If a breakout occurs, the next resistance would be found at $1.69.
STX Chart By TradingView
BNB
BNB has been moving upwards since June 22, after reaching a low of $225.42. It broke out from a descending resistance line on July 4.
BNB was rejected by the minor resistance area of $330 and is currently attempting to find support.
The next resistances levels are found at $395 and $452.
BNB Chart By TradingViewFor BeInCrypto’s latest bitcoin (BTC) analysis, click here.
In line with the Trust Project guidelines, this price analysis article is for informational purposes only and should not be considered financial or investment advice. BeInCrypto is committed to accurate, unbiased reporting, but market conditions are subject to change without notice. Always conduct your own research and consult with a professional before making any financial decisions. Please note that our Terms and Conditions, Privacy Policy, and Disclaimers have been updated.
Valdrin discovered cryptocurrencies while he was getting his MSc in Financial Markets from the Barcelona School of Economics. Shortly after graduating, he began writing for several different cryptocurrency related websites as a freelancer before eventually taking on the role of BeInCrypto's Senior Analyst.
(I do not have a discord and will not contact you first there. Beware of scammers)