

Bitcoin (BTC) has broken down from the $44,000 horizontal support area.
Ethereum (ETH) is in the C wave of an A-B-C corrective structure.
XRP (XRP) is following a descending support line.
Chiliz (CHZ) is trading above a confluence of support levels at $0.25.
Monero (XMR) has broken down from an ascending support line.
OMG Network (OMG) has broken out from a symmetrical triangle.
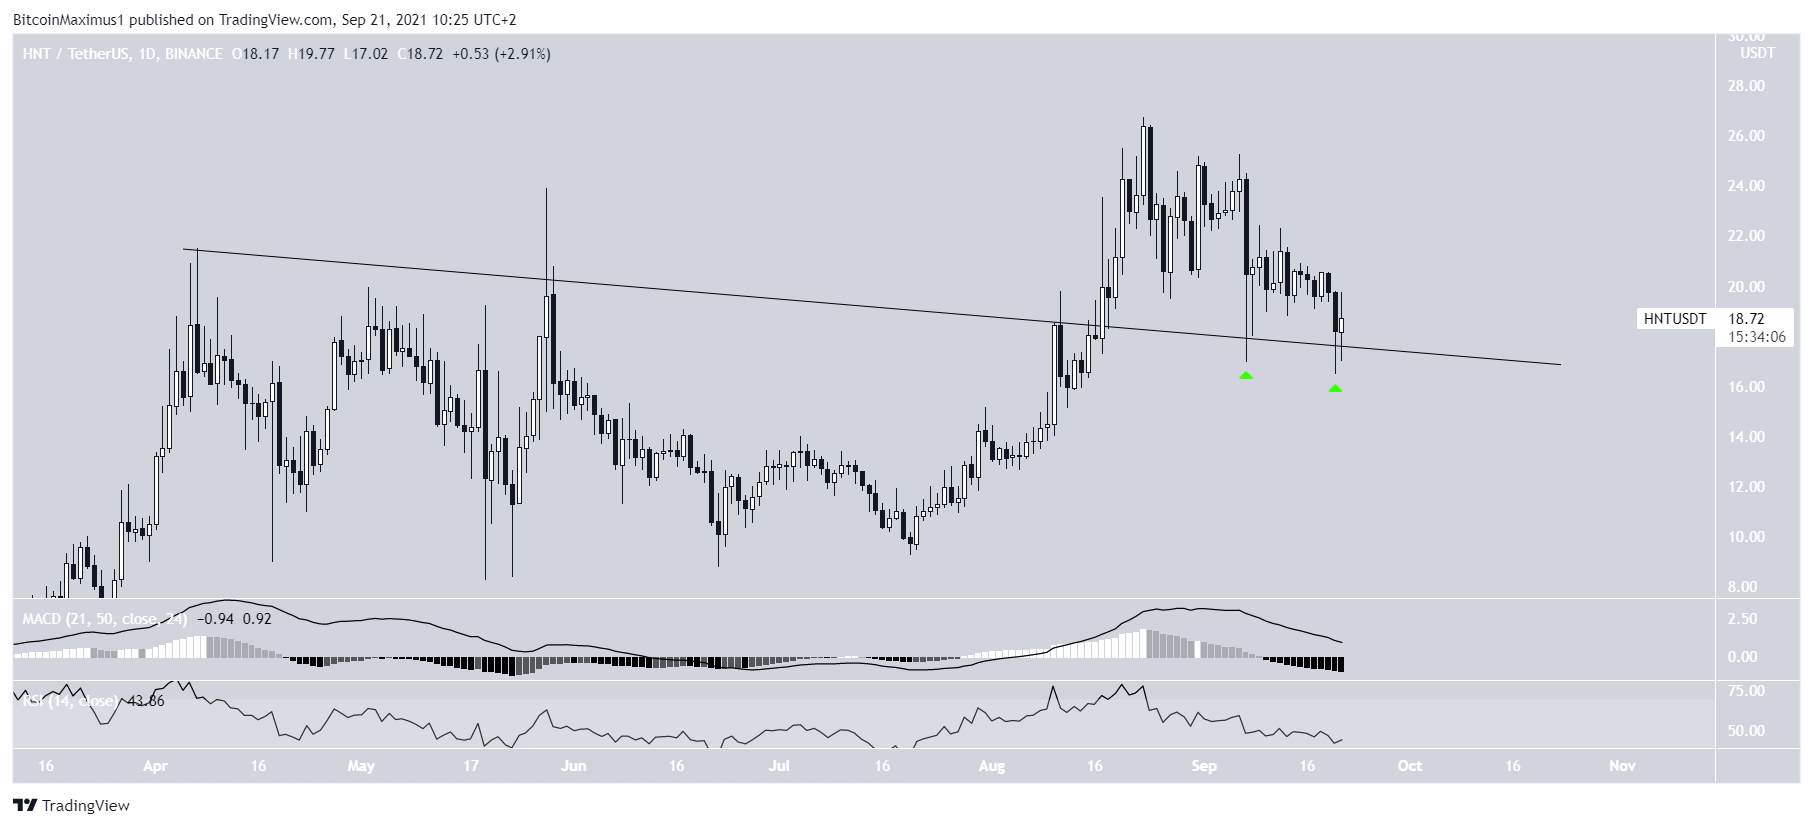
Helium (HNT) has validated a descending resistance line from which it previously broke out above.
BTC
BTC fell considerably on Sept 20, decreasing below the $44,000 support area with a large bearish candlestick. The $44,000 area is now expected to act as resistance.
Technical indicators in the daily time frame are bearish. The RSI and MACD are both decreasing. The former has moved below the 50-line and the Supertrend is bearish (red line).
The two closest support levels are found at $40,800 and $38,000. These are the 0.5 and 0.618 Fib retracement support levels.
So far, BTC has bounced after reaching the first support, creating a long lower wick.

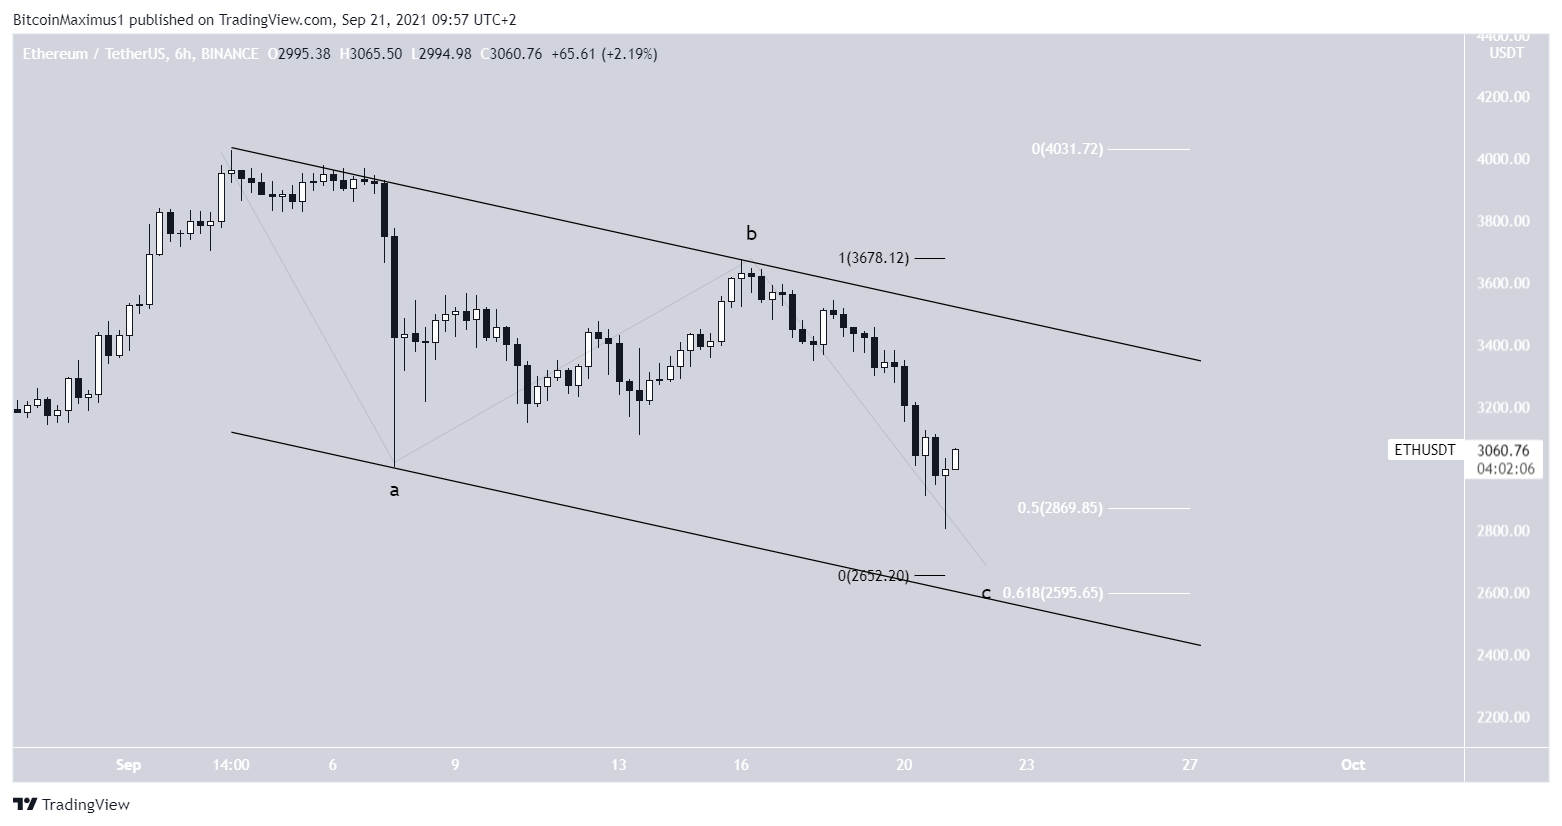
ETH
ETH has been decreasing since Sept 3 after it reached a high of $4,027. The decrease appears to have taken the shape of a descending parallel channel.
On Sept 21, ETH reached a low of $2,807 and bounced, creating a long lower wick. The low was made right at the 0.5 Fib retracement support level (white).
The most likely count suggests that the decrease is part of an A-B-C corrective structure (black), in which ETH is currently in wave C.
The most likely area for the movement to end is between $2,652 and $2,595. This is the 0.618 Fib retracement support level and would give waves A:C a 1:1 ratio.
XRP
XRP has been decreasing since Sept 6 after it reached a high of $1.41. The decrease has been sharp, leading XRP to a local low of $0.86 on Sept 21.
The price then rebounded, validating both a descending support line and the 0.618 Fib retracement support level at $0.85.
Despite the price bouncing back, XRP is facing considerable resistance at $1.05. Until this area is reclaimed, the trend cannot be considered bullish.

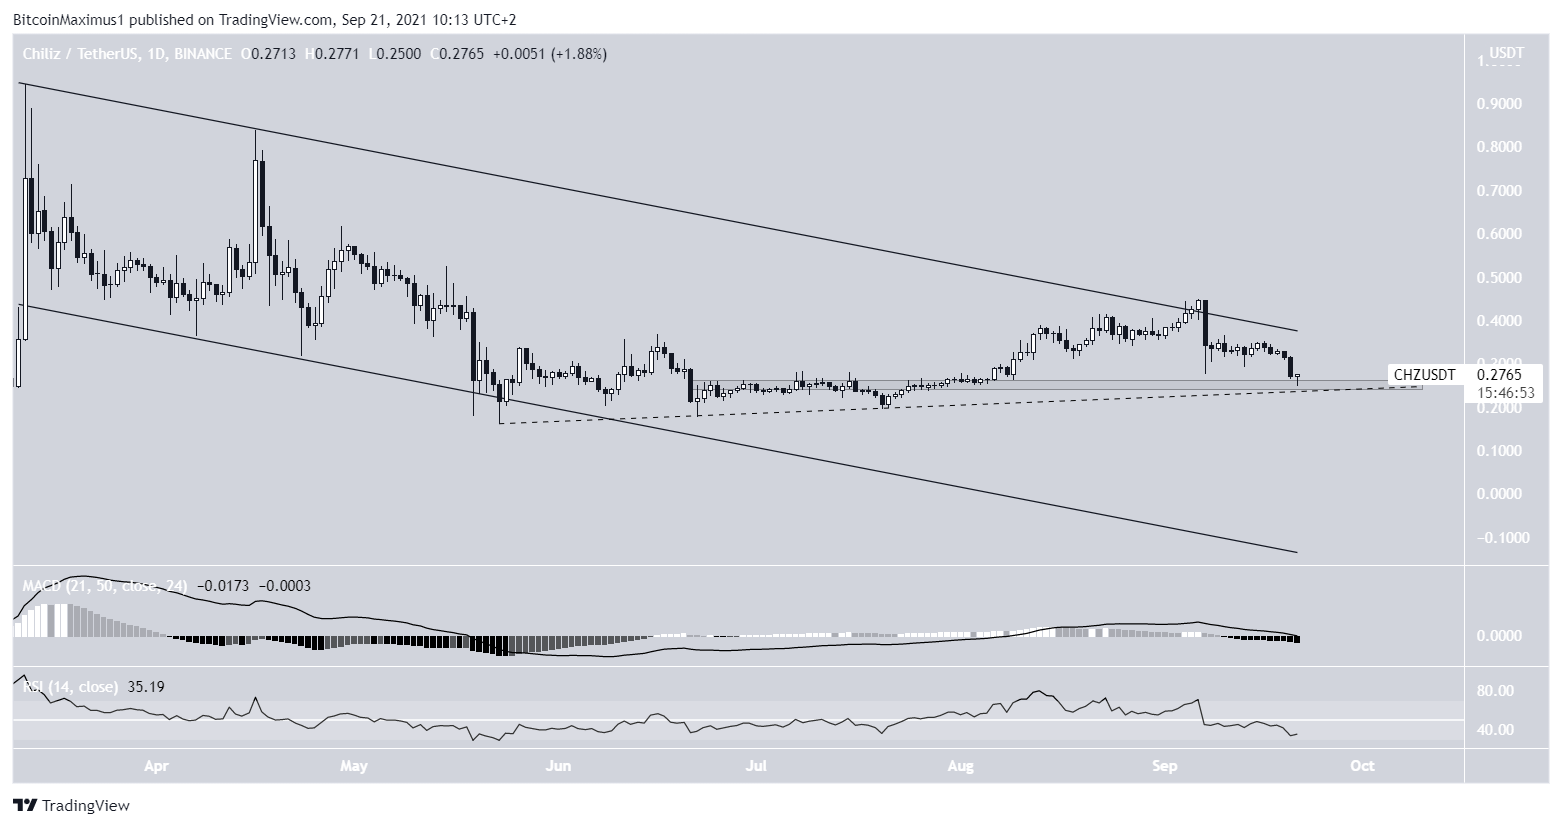
CHZ
CHZ has been trading inside a descending parallel channel since March 12, after an all-time high price of $0.945 was reached.
On Sept 6, CHZ seemingly broke out from this parallel channel. However, the breakout turned out to be only a deviation and CHZ has fallen back inside the channel.
While technical indicators do not show any bullish reversal signs, CHZ is trading right above a confluence of support levels created by the horizontal $0.25 area and an ascending support line.
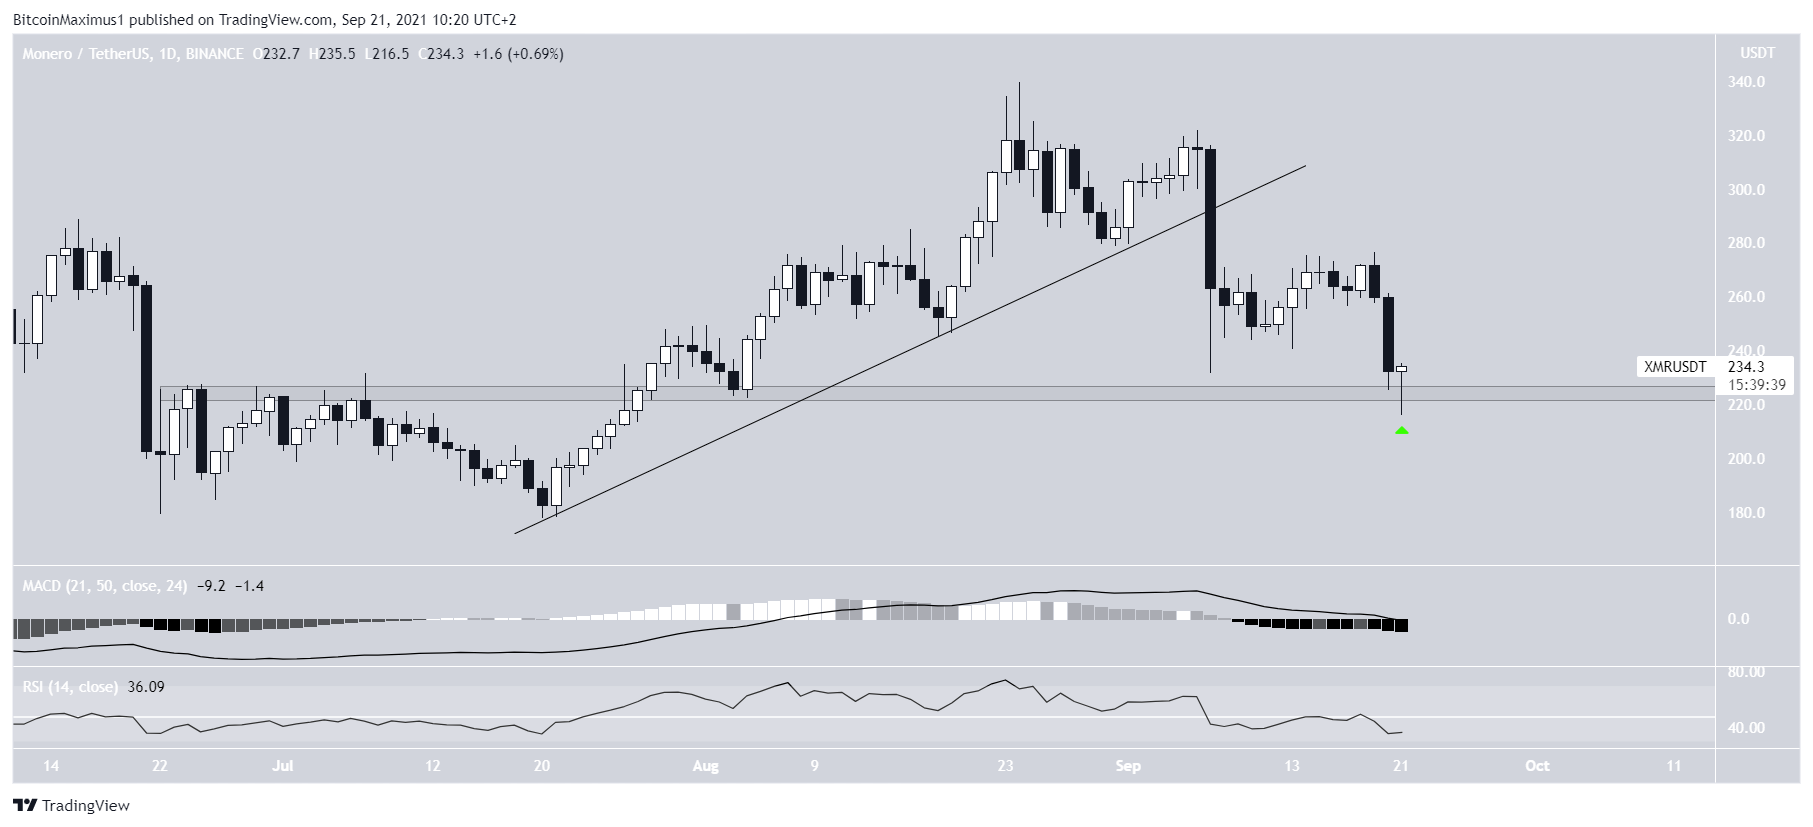
XMR
XMR had been increasing above an ascending support line since July 20. This led to a high of $339.70 on Aug 24.
However, XMR has been moving downwards since and broke down from the ascending support line on Sept 7.
So far, it has reached a low of $216.50 on Sept 21.
This caused a bounce at the $225 horizontal support area and a long lower wick.
However, technical indicators in the daily time frame are still bearish.
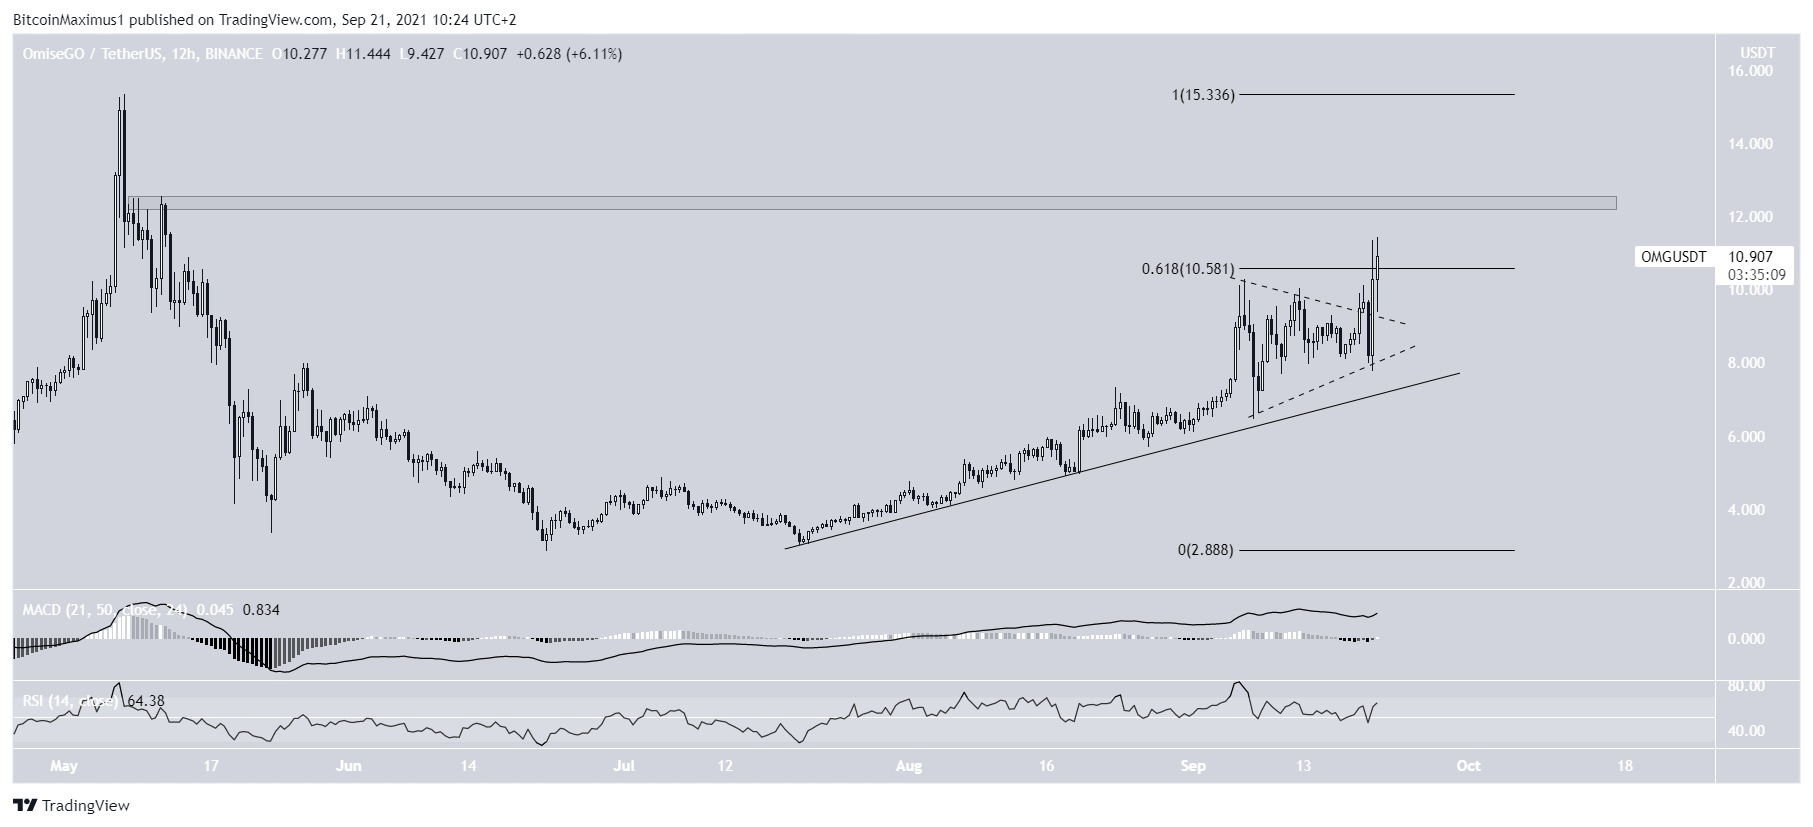
OMG
OMG has been increasing above an ascending support line since July 20.
In the period from Sept 6-19, it created a symmetrical triangle, from which it broke out on Sept 20.
It’s currently attempting to close above the $10.60 resistance area, which is the 0.618 Fib retracement resistance level. If it manages to close above this level, the next support would be found at $12.40.
The increasing MACD and RSI support this increase.
HNT
On Aug 17, HNT broke out from a descending resistance line that had previously been in place since the April 7 all-time high price.
This led to a new all-time high of $26.73 being reached on Aug 23.
While HNT has been decreasing since then, it has twice validated the resistance line as support (green icons).
While technical indicators are still bearish, the price action can be considered bullish as long as HNT is trading above this support line.
For BeInCrypto’s latest Bitcoin (BTC) analysis, click here.
Trusted
Disclaimer
In line with the Trust Project guidelines, this price analysis article is for informational purposes only and should not be considered financial or investment advice. BeInCrypto is committed to accurate, unbiased reporting, but market conditions are subject to change without notice. Always conduct your own research and consult with a professional before making any financial decisions. Please note that our Terms and Conditions, Privacy Policy, and Disclaimers have been updated.
