
The trading pair used in this analysis is USDT/BTC. USDT (₮)—or “Tether”—is theoretically supposed to maintain parity with the dollar. However, since the popularity of stablecoins has grown, this has not been the case. For this reason, the conversion rates between USDT/BTC and USD/BTC are not the same. Assuming that Tether values are the same as dollar values will lead to inaccuracies.
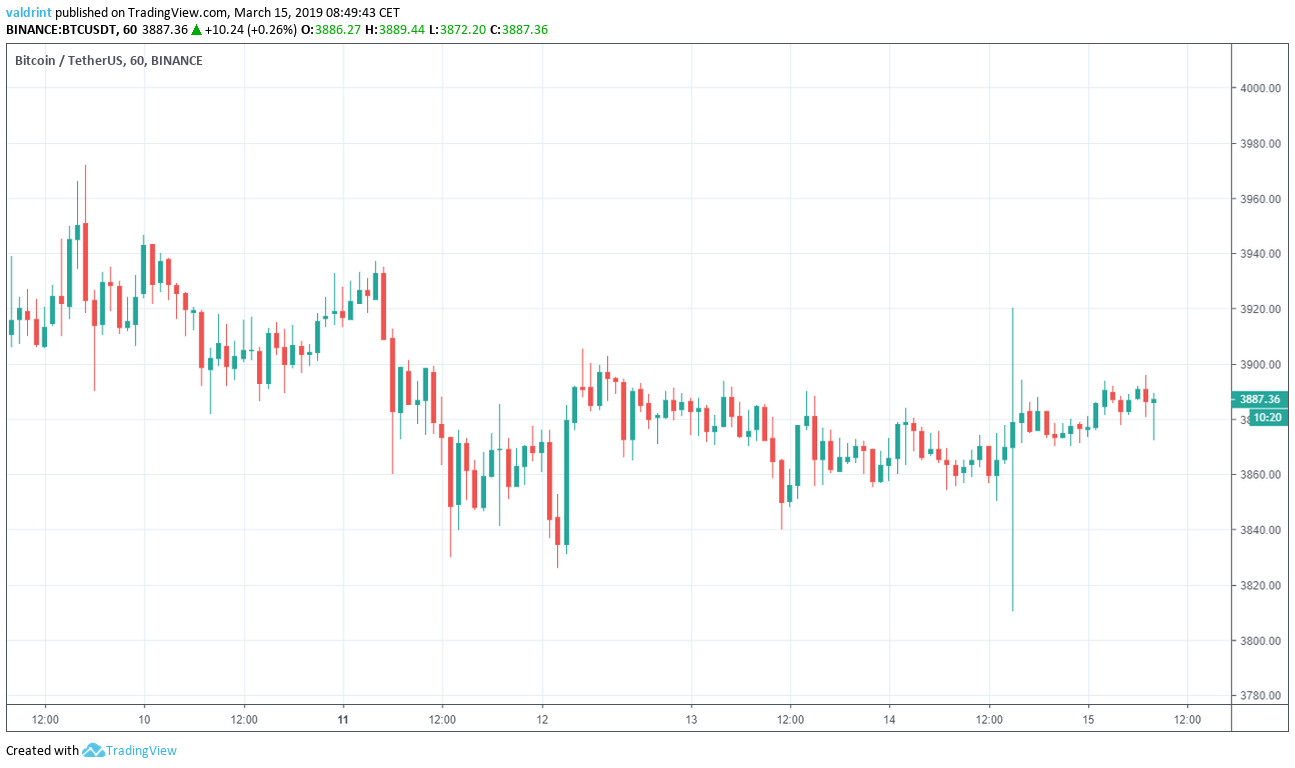
On Mar 9, 2019, Bitcoin (BTC) reached a high of nearly ₮4000. The price has been gradually decreasing since. However, the price is showing signs of strength.
Here’s a look at prices between Mar 9 and Mar 15:
 In our March 14 analysis of Bitcoin, we predicted that the price will not experience significant movement until a breakout occurs. Later that same day, a breakout did occur. Based on today’s analysis, we predict that the price will trade near the current level. Another breakout may then be forthcoming.
Key Highlights For Mar 15
- The price of Bitcoin has been on a downtrend since Mar 9.
- It has broken out of the descending channel and is now trading inside an ascending triangle.
- The MACD and SMAs have triggered a buy signal.
- There are support areas near ₮3840 and ₮3720.
- There are resistance areas near ₮4160 and ₮3970.
Previous Breakout
The price of BTC on Binance is analyzed at one-hour intervals from Mar 9 to Mar 15.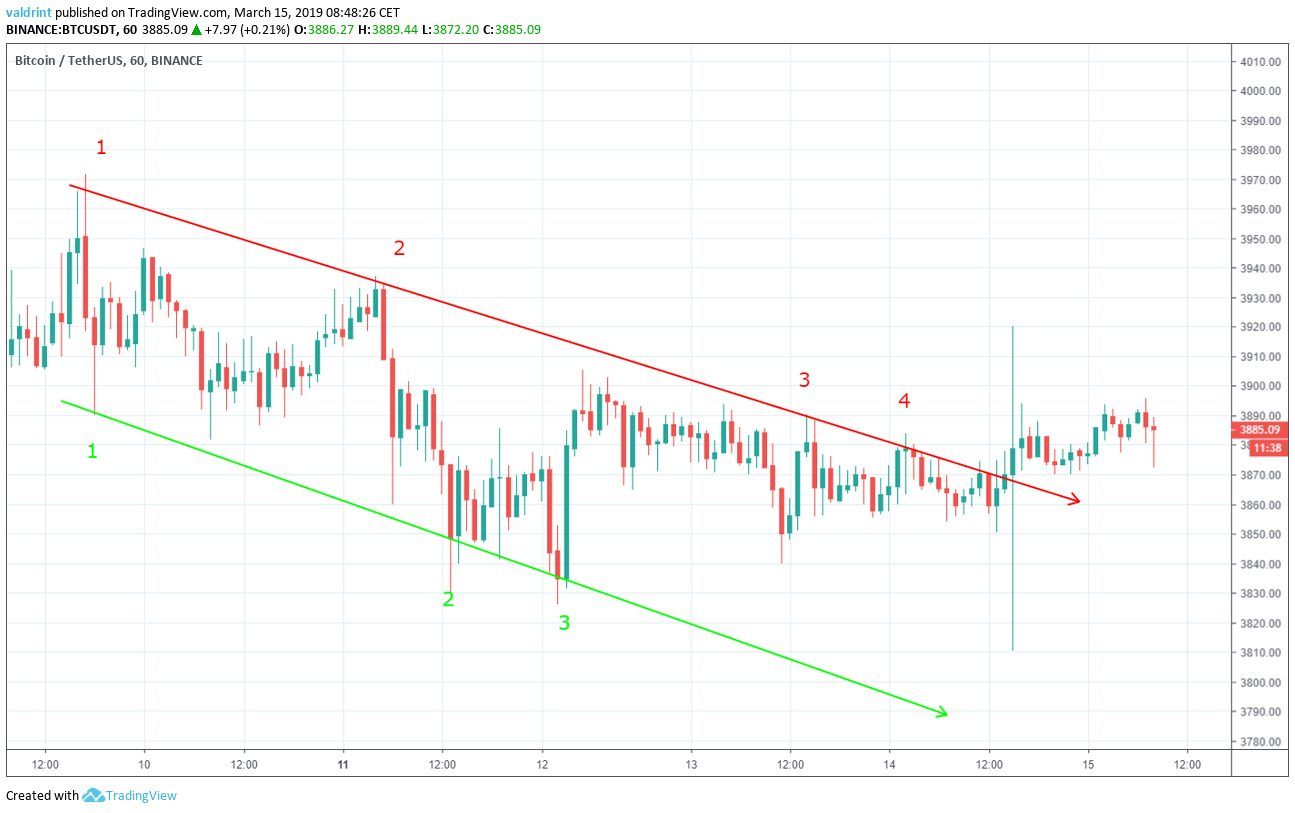 The price of BTC had been trading inside a descending channel since in the period between Mar 9 and Mar 14. As predicted in our previous analysis, a breakout occurred on Mar 14.
New Resistance
The price of BTC on Binance is analyzed at 30-minute intervals from Mar 11 to Mar 15. The price reached a high of ₮3901.46 on Mar 11. Afterward, it initiated a downward move. At the time of writing, it has revisited that same level three times. Tracing these highs gives us a horizontal resistance line.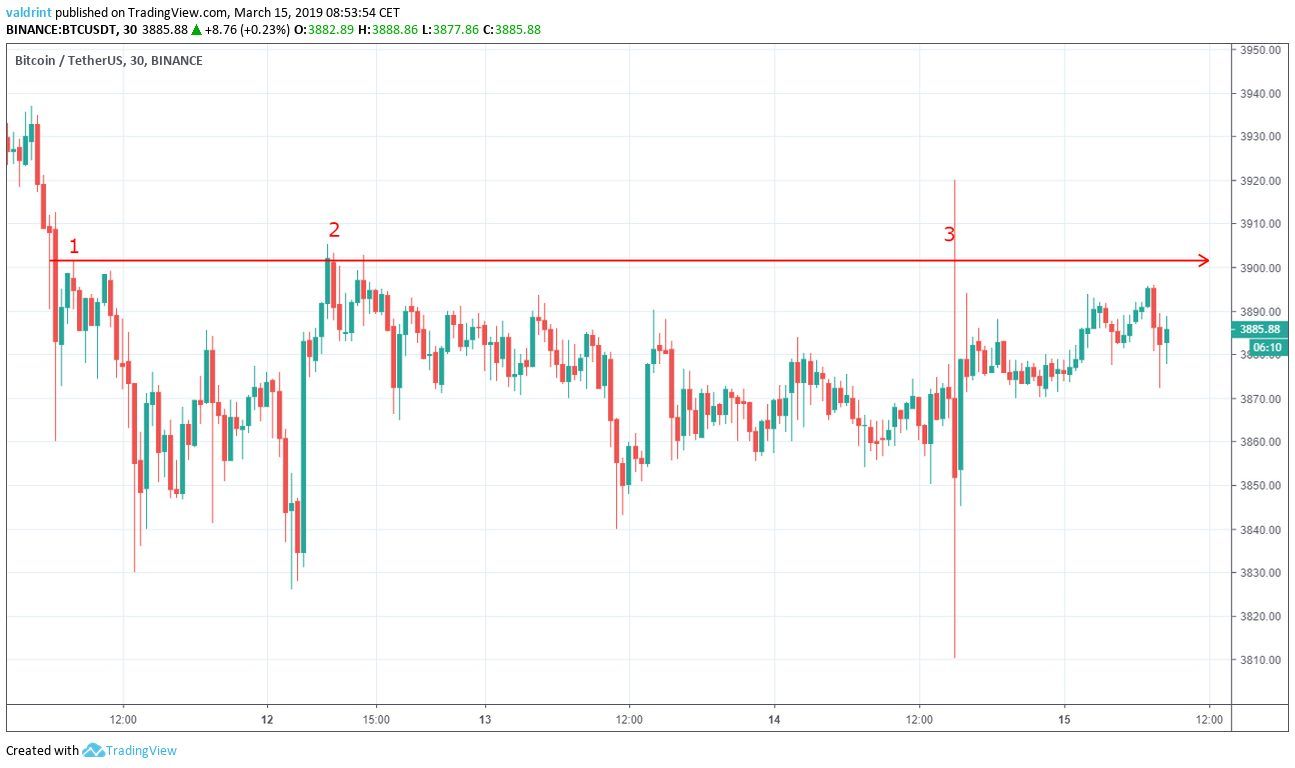 The descending resistance line can act as a ceiling to price, preventing further upward movement. It traces the theoretical upper limits of the price.
Wick breakouts above the line can be considered insignificant if they are not supported by continuous gains. This was the case with a wick high of ₮3920 on Mar 14, after which the price immediately returned and closed below the resistance line.
It is unlikely that the price moves above this line unless a breakout occurs. The resistance line alone is not sufficient in predicting when a breakout will occur.
The descending resistance line can act as a ceiling to price, preventing further upward movement. It traces the theoretical upper limits of the price.
Wick breakouts above the line can be considered insignificant if they are not supported by continuous gains. This was the case with a wick high of ₮3920 on Mar 14, after which the price immediately returned and closed below the resistance line.
It is unlikely that the price moves above this line unless a breakout occurs. The resistance line alone is not sufficient in predicting when a breakout will occur.
Ascending Triangle
The price made a low of ₮3826.06 on Mar 12. A gradual uptrend followed. It has been making higher lows since. Tracing these lows gives us an ascending support line. Similar to the resistance line, the support line prevents the price from moving further downward.
Breakdowns below the line can be considered insignificant if they are not succeeded by continuous price decreases. This was the case with a wick low of ₮3810.43 on Mar 14—since the price immediately moved upward to close above the line.
The resistance and support lines combine to create an ascending triangle, which is a bullish pattern, making a price increase more likely. The triangle is a better predictor of price fluctuations than support or resistance lines alone.
It is likely that the price keeps increasing at the rate predicted by the support line.
Similar to the resistance line, the support line prevents the price from moving further downward.
Breakdowns below the line can be considered insignificant if they are not succeeded by continuous price decreases. This was the case with a wick low of ₮3810.43 on Mar 14—since the price immediately moved upward to close above the line.
The resistance and support lines combine to create an ascending triangle, which is a bullish pattern, making a price increase more likely. The triangle is a better predictor of price fluctuations than support or resistance lines alone.
It is likely that the price keeps increasing at the rate predicted by the support line.
The Beginning of The Uptrend
The moving average convergence divergence (MACD) is a trend indicator that shows the relationship between two moving averages (long and short-term) and the price. It is used to measure the strength of a move. Combined with simple moving averages (SMA), MACD can be used as a trigger for buy and sell signals. Signals are triggered whenever the MACD line is above 0 and the price is above the 21 (red) and 50-period (green) SMAs.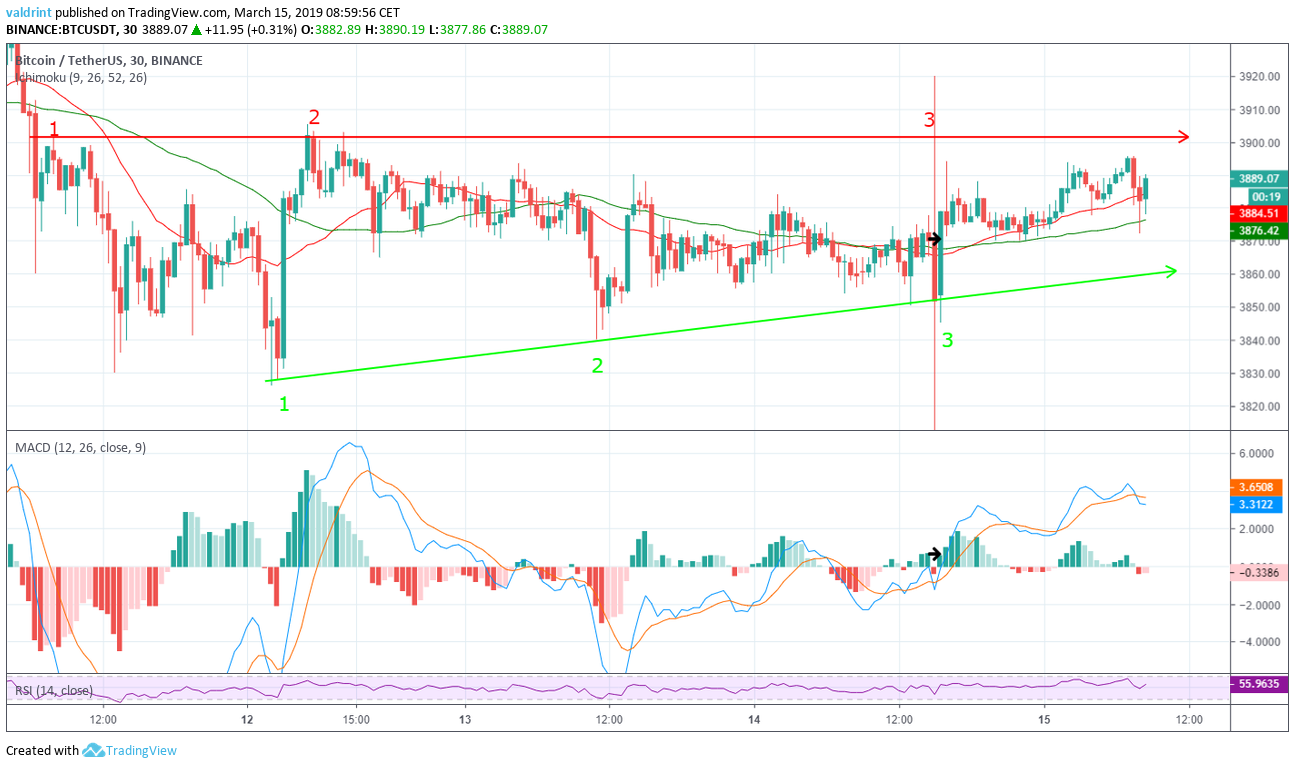 On Mar 14, the price started an upward move which took it above the 21 and 50-period moving averages.
During the same interval, the MACD line made a cross above 0. This would have triggered a buy signal, indicating that the current trend may be over and a new uptrend may begin.
This signal would be invalidated by a price move below the 21 and 50-period SMAs and a MACD line cross below 0.
Using these indicators, it is suggested that price may start an upward movement toward the resistance of the triangle. Since the signal is occurring in a bullish pattern, it is likely that the price eventually breaks out of the triangle.
On Mar 14, the price started an upward move which took it above the 21 and 50-period moving averages.
During the same interval, the MACD line made a cross above 0. This would have triggered a buy signal, indicating that the current trend may be over and a new uptrend may begin.
This signal would be invalidated by a price move below the 21 and 50-period SMAs and a MACD line cross below 0.
Using these indicators, it is suggested that price may start an upward movement toward the resistance of the triangle. Since the signal is occurring in a bullish pattern, it is likely that the price eventually breaks out of the triangle.
Reversal Areas
In order to better determine possible future levels of resistance and support, the price of BTC on Binance is analyzed at four-hour intervals from Feb 18 to Mar 14.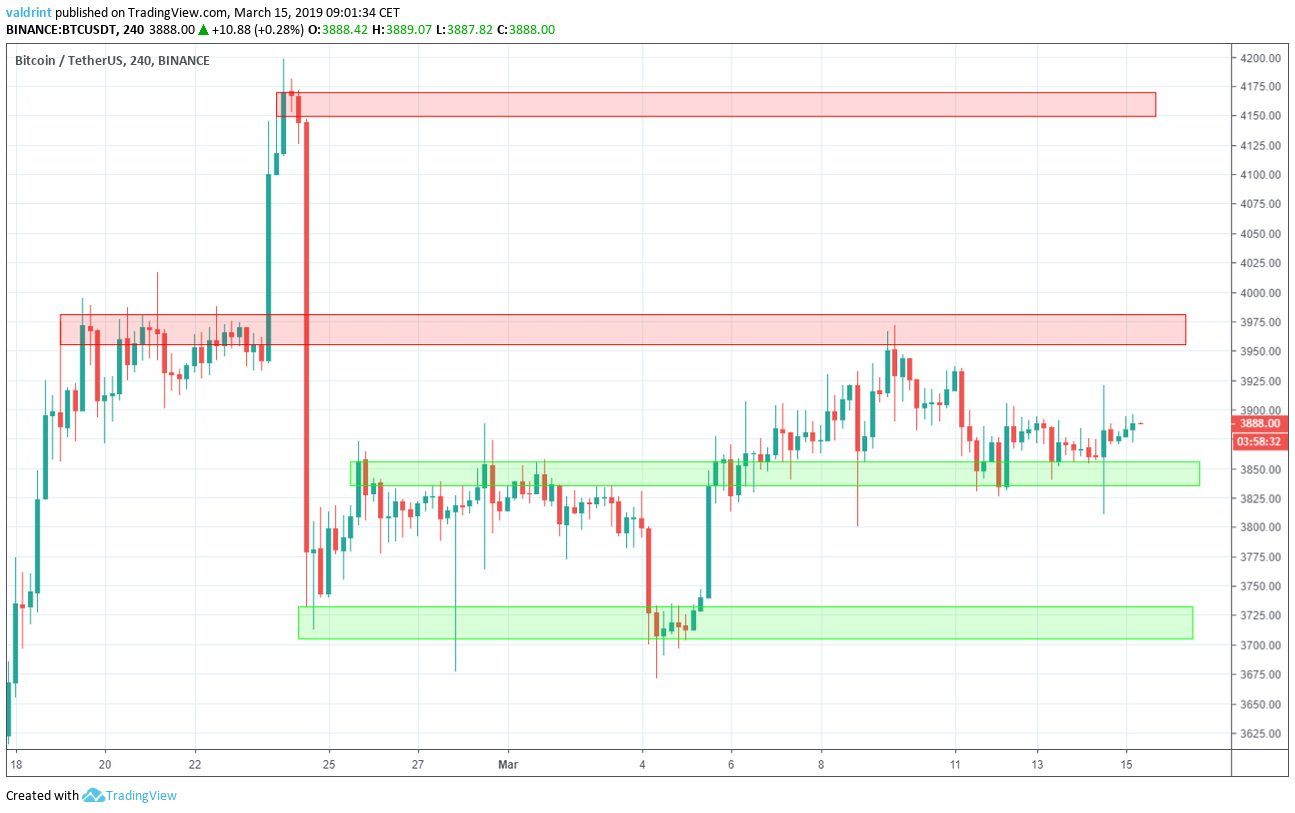 The first support area is found near ₮3840 and the second near ₮3720. We can see that price found support inside the first area on Mar 11. A breakdown below the second support area could lead to rapid price decreases.
Though the price may not reach the first support area again, gradual decreases are possible in the future. We are not currently predicting rapid price decreases to or below ₮3720.
Conversely, the closest resistance area is found near ₮3960. The second one is found near ₮4160. In the case of a breakout above the resistance line of the triangle, a price of ₮3960 might be reached. A break above this level could lead to prices as high as ₮4160. We believe that this scenario is unlikely in the near future.
The first support area is found near ₮3840 and the second near ₮3720. We can see that price found support inside the first area on Mar 11. A breakdown below the second support area could lead to rapid price decreases.
Though the price may not reach the first support area again, gradual decreases are possible in the future. We are not currently predicting rapid price decreases to or below ₮3720.
Conversely, the closest resistance area is found near ₮3960. The second one is found near ₮4160. In the case of a breakout above the resistance line of the triangle, a price of ₮3960 might be reached. A break above this level could lead to prices as high as ₮4160. We believe that this scenario is unlikely in the near future.
Summary of Analysis
Based on this analysis, the price of BTC is likely to move inside the confines of the ascending triangle until a point of convergence occurs. Afterward, it is likely that a breakout will occur. If the price trades inside the ascending triangle, the prediction will be partially validated. If it eventually breaks out, it will be fully validated. Do you think BTC will breakout above the triangle or will price continue to consolidate? Let us know your thoughts in the comments below. Disclaimer: This article is not trading advice and should not be construed as such. Always consult a trained financial professional before investing in cryptocurrencies, as the market is particularly volatile.
Top crypto projects in the US | April 2024
Trusted
Disclaimer
In line with the Trust Project guidelines, this price analysis article is for informational purposes only and should not be considered financial or investment advice. BeInCrypto is committed to accurate, unbiased reporting, but market conditions are subject to change without notice. Always conduct your own research and consult with a professional before making any financial decisions. Please note that our Terms and Conditions, Privacy Policy, and Disclaimers have been updated.

Valdrin Tahiri
Valdrin discovered cryptocurrencies while he was getting his MSc in Financial Markets from the Barcelona School of Economics. Shortly after graduating, he began writing for several different cryptocurrency related websites as a freelancer before eventually taking on the role of BeInCrypto's Senior Analyst.
(I do not have a discord and will not contact you first there. Beware of scammers)
READ FULL BIO
Sponsored
Sponsored