

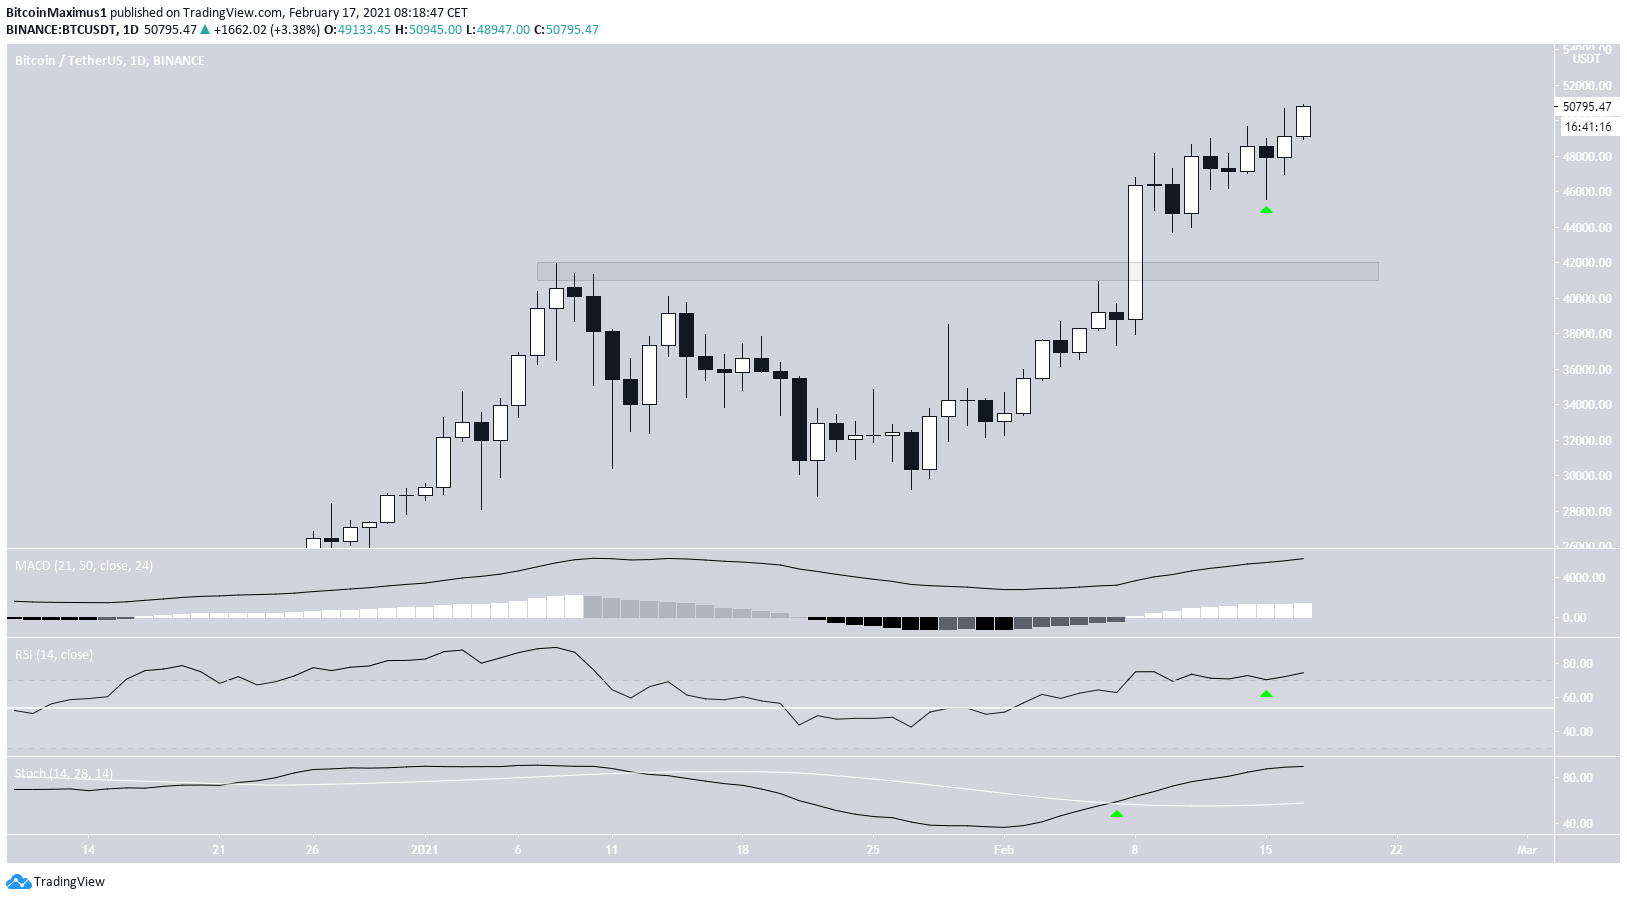
On Feb. 16, Bitcoin finally managed to break out above $50,000 and reached a high of $50,689. BTC has continued its ascent today reaching an all-time high price of $51,280.
While Bitcoin is likely in the final portion of the upward move, it could increase all the way to $55,000 before correcting.
Bitcoin Breaks Through $50,000
On Feb. 15, BTC created a hanging man candlestick, which can be read as a sign of weakness when coming in an upward trend.
However, BTC created a bullish candlestick the next day, reaching a high of $50,689 before decreasing slightly. BTC has begun Feb. 17 with a considerable increase. So far it has reached a new all-time high price of $51,280.
Technical indicators are also bullish. The Stochastic oscillator and MACD have resumed their upward movement while the RSI has bounced above 70.
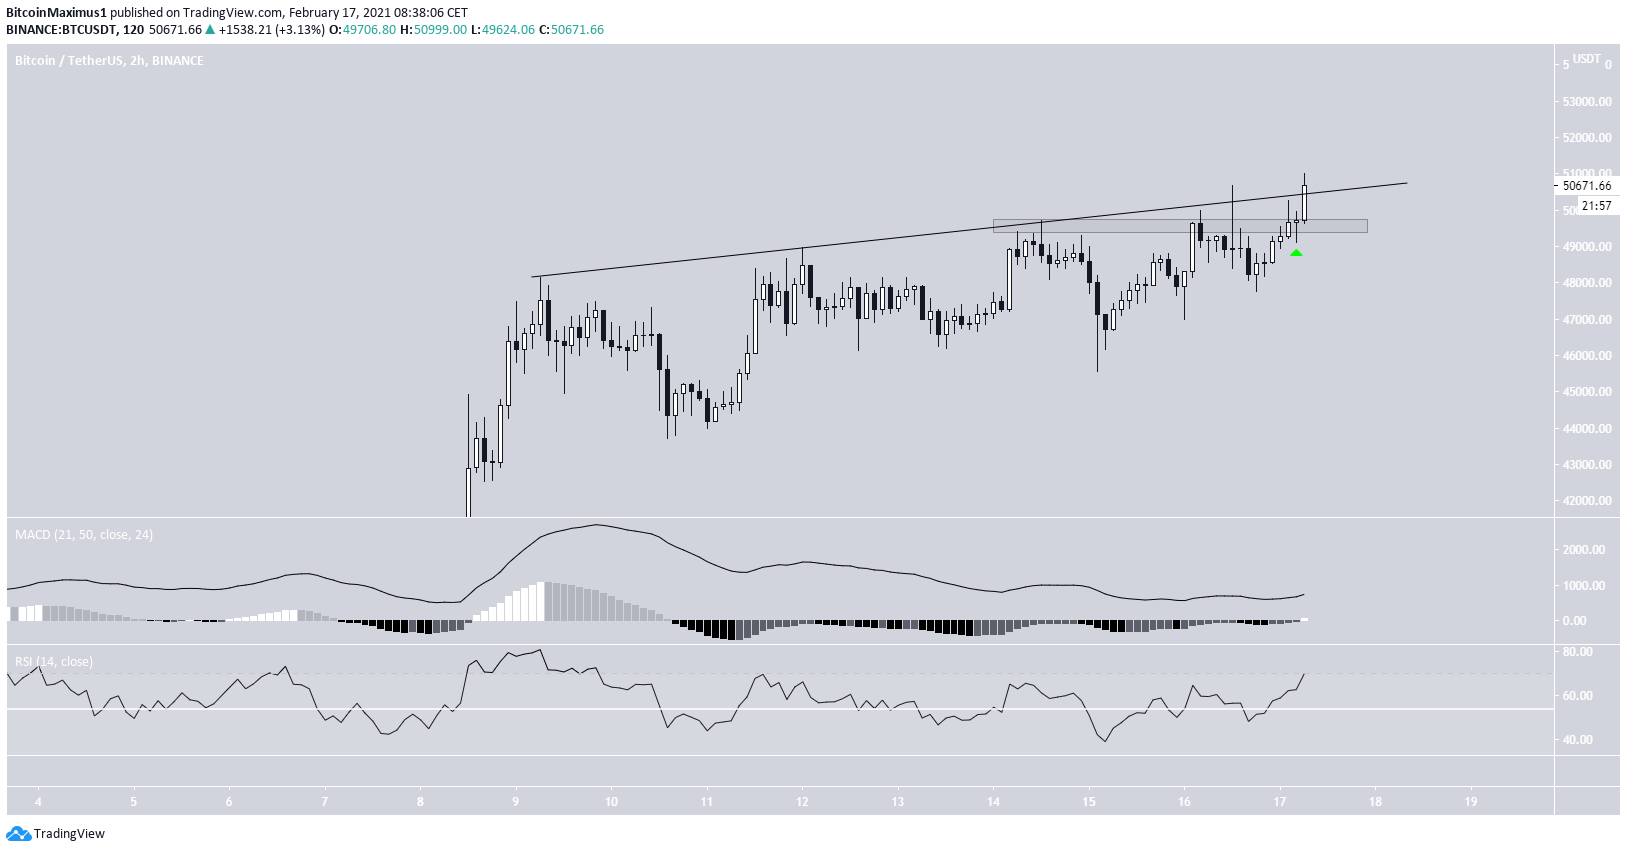
The two-hour chart shows that BTC is in the process of breaking out from an ascending resistance line, which has been in place since Feb. 8.
Furthermore, BTC has broken out from the $49,500 horizontal level and validated it as support after (green arrow).
Both the MACD and RSI support the possibility of a breakout, especially since the former has crossed into positive territory. Therefore, BTC is expected to break out from the ascending resistance line and continue higher.
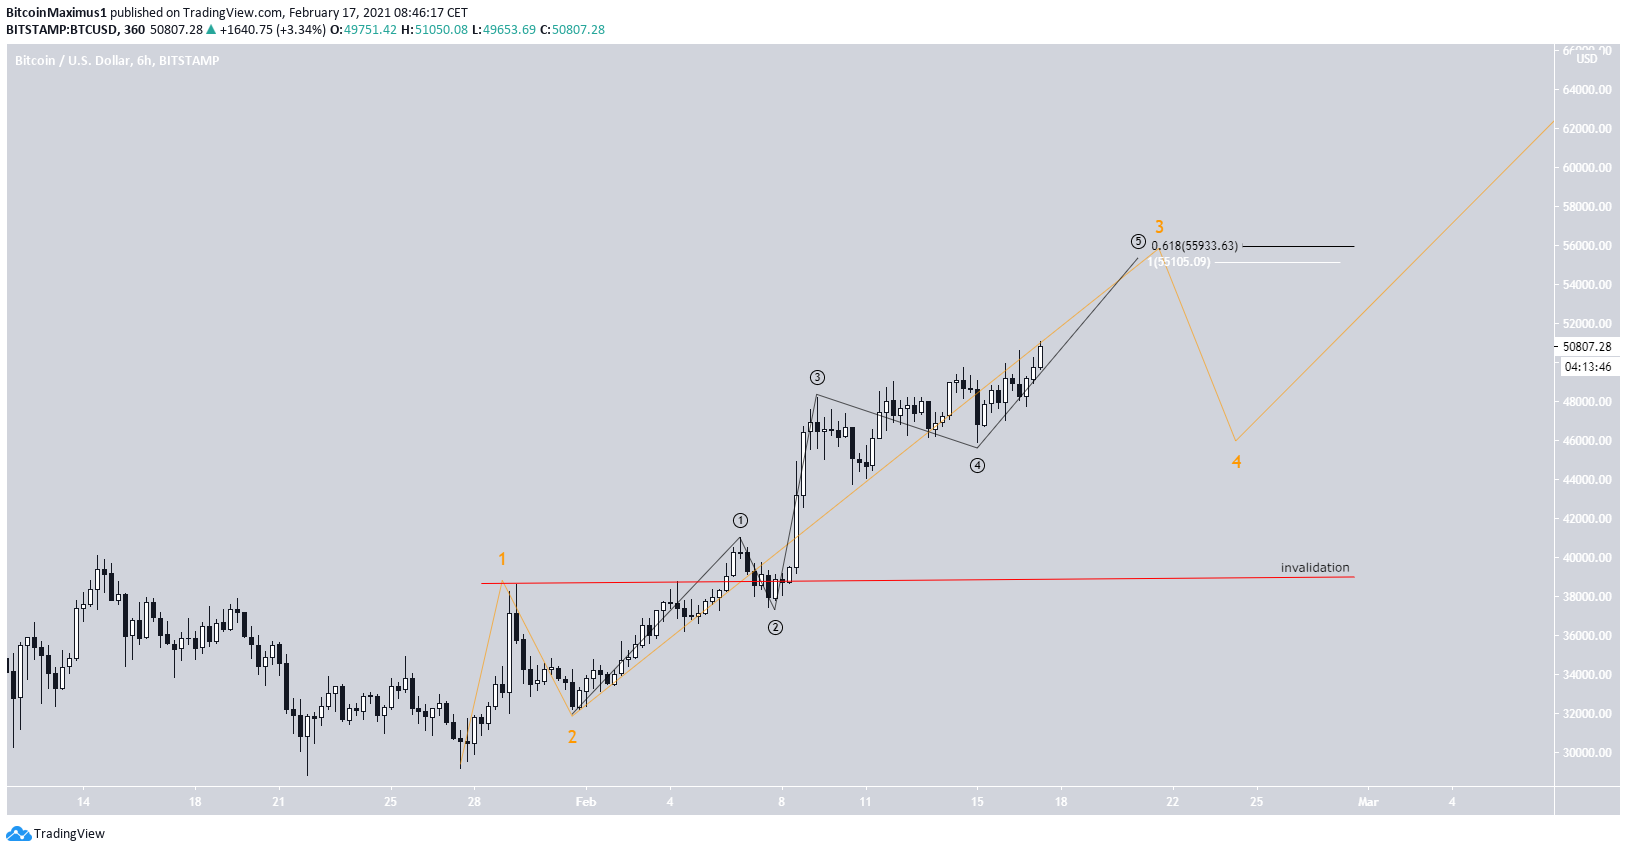
BTC Wave Count
The wave count suggests that BTC is nearing the top of wave three (orange), which has a target between $55,000-$56,000. This range was found by using the length of sub-wave one (black).
Despite this being the most likely target, BTC appears to be in the final portion of the current upward move. It’s not certain that it will reach $55,000 before breaking down and beginning a corrective wave four (orange).
A decrease below the wave one high of $38,640 would invalidate this particular wave count.
For the longer-term wave count, click here.
Conclusion
Bitcoin is expected to continue increasing towards the range of $55,000-$56,000 before potentially breaking down.
For BeInCrypto’s previous Bitcoin (BTC) analysis, click here
Trusted
Disclaimer
In line with the Trust Project guidelines, this price analysis article is for informational purposes only and should not be considered financial or investment advice. BeInCrypto is committed to accurate, unbiased reporting, but market conditions are subject to change without notice. Always conduct your own research and consult with a professional before making any financial decisions. Please note that our Terms and Conditions, Privacy Policy, and Disclaimers have been updated.
