

On April 22, the Bitcoin (BTC) price increased considerably from a low of $6818 to a high of $7158. This created a bullish engulfing candlestick. However, the price failed to move above an important resistance level that would otherwise indicate that the current trend is bullish.
The Bitcoin price is still trading inside its $6650-$7150 range. At the time of writing, it was trading between the midpoint (EQ) and the resistance line — having been rejected by the latter several hours prior.
Bitcoin Fractal
The Bitcoin price has moved above both the 50- and 200-hour moving averages (MAs), which have made a bearish cross. The relation between the MAs and the price gives conflicting signs. While the cross is bearish, the fact that the price is trading above them is bullish. The same cross transpired on April 11. Interestingly, the BTC price acted in the exact same manner. It moved above both MAs shortly after and tagged the resistance line of the range. What followed was a very sharp drop towards the support line of the range. If the same movement occurs this time around and it takes the same amount of time to transpire, the BTC price will break down towards the support line today. On the other hand, a movement above the resistance line of the range would invalidate this fractal.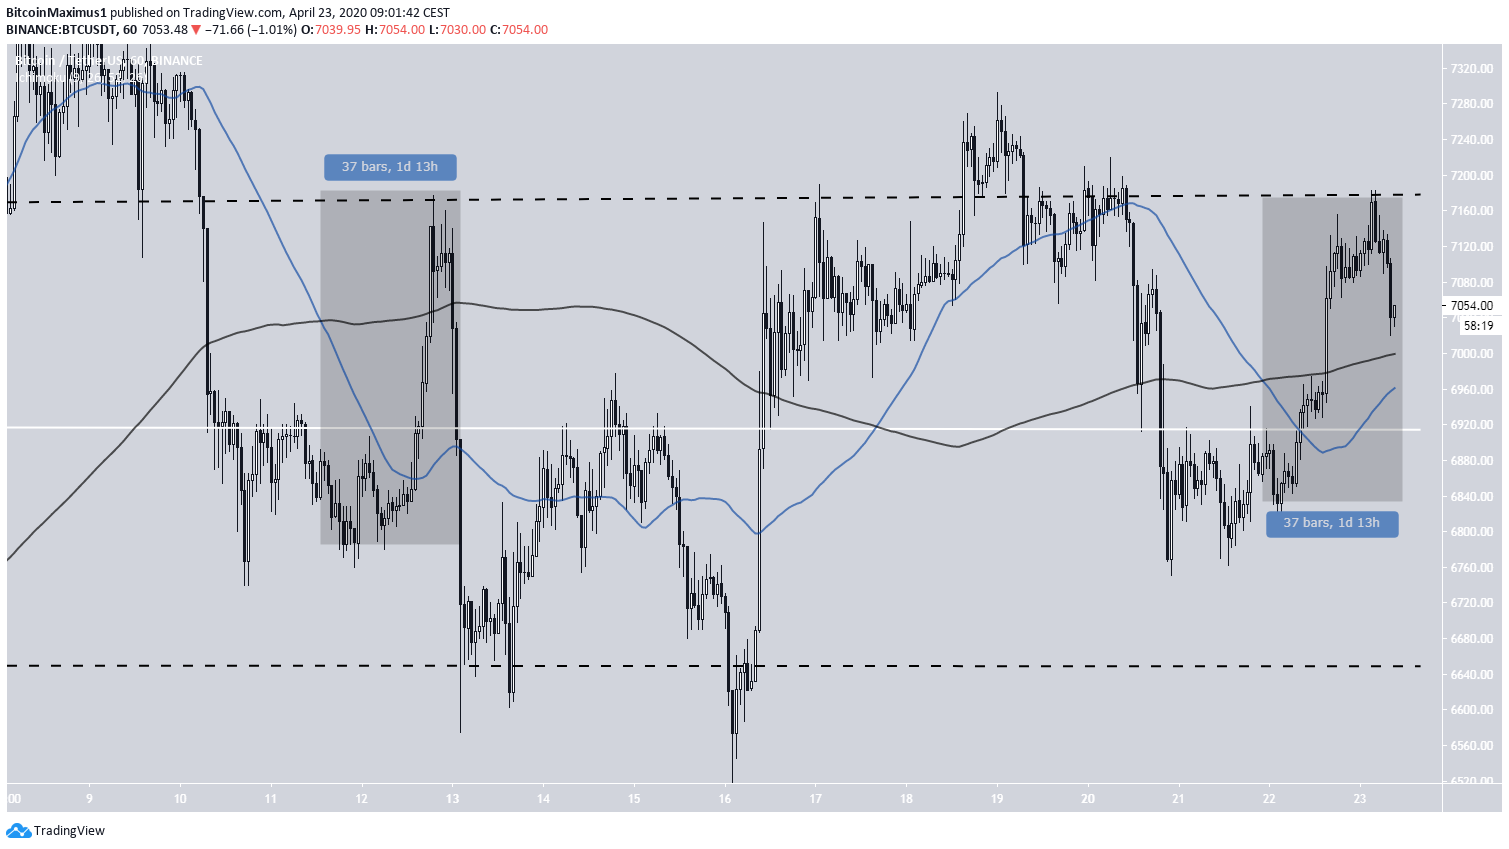
Long-Term Range
The possibility of the fractal being completed is also strengthened by the descending resistance line that the Bitcoin price has been following since reaching a high of $7454 on April 7. Yesterday’s high served to validate this line for the third time while also creating the third successive lower high. If the price continues its downward move while also completing the fractal, it will drop and fall back inside the longer-term $5700-$6900 range. This could have major bearish implications for the price of BTC since it would likely fall towards the EQ of $6300 and then, possibly, towards the support line of $5700.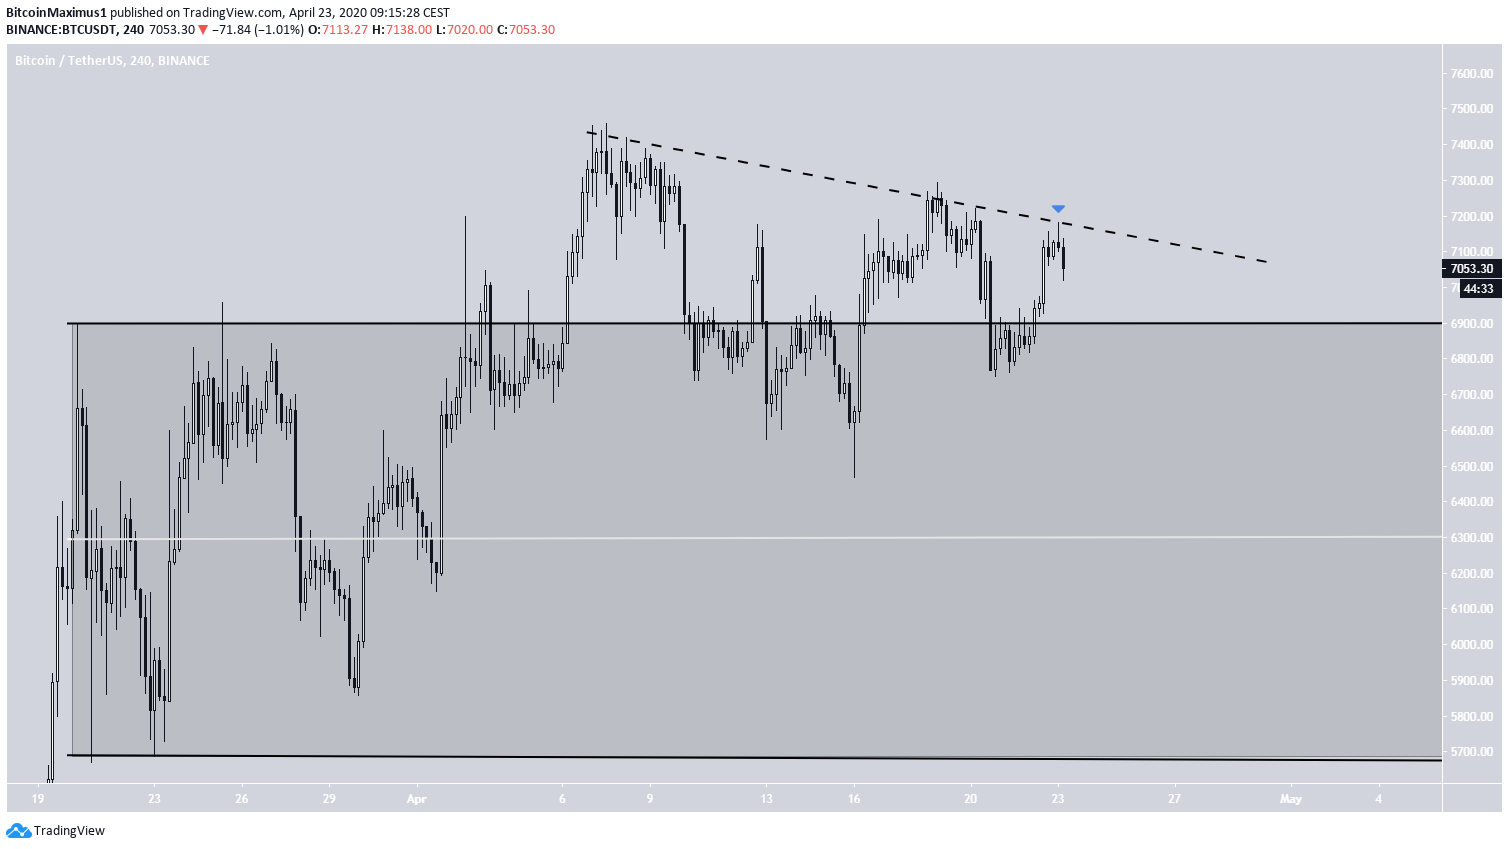
Top crypto projects in the US | April 2024
Trusted
Disclaimer
In line with the Trust Project guidelines, this price analysis article is for informational purposes only and should not be considered financial or investment advice. BeInCrypto is committed to accurate, unbiased reporting, but market conditions are subject to change without notice. Always conduct your own research and consult with a professional before making any financial decisions. Please note that our Terms and Conditions, Privacy Policy, and Disclaimers have been updated.

Valdrin Tahiri
Valdrin discovered cryptocurrencies while he was getting his MSc in Financial Markets from the Barcelona School of Economics. Shortly after graduating, he began writing for several different cryptocurrency related websites as a freelancer before eventually taking on the role of BeInCrypto's Senior Analyst.
(I do not have a discord and will not contact you first there. Beware of scammers)
READ FULL BIO
Sponsored
Sponsored