

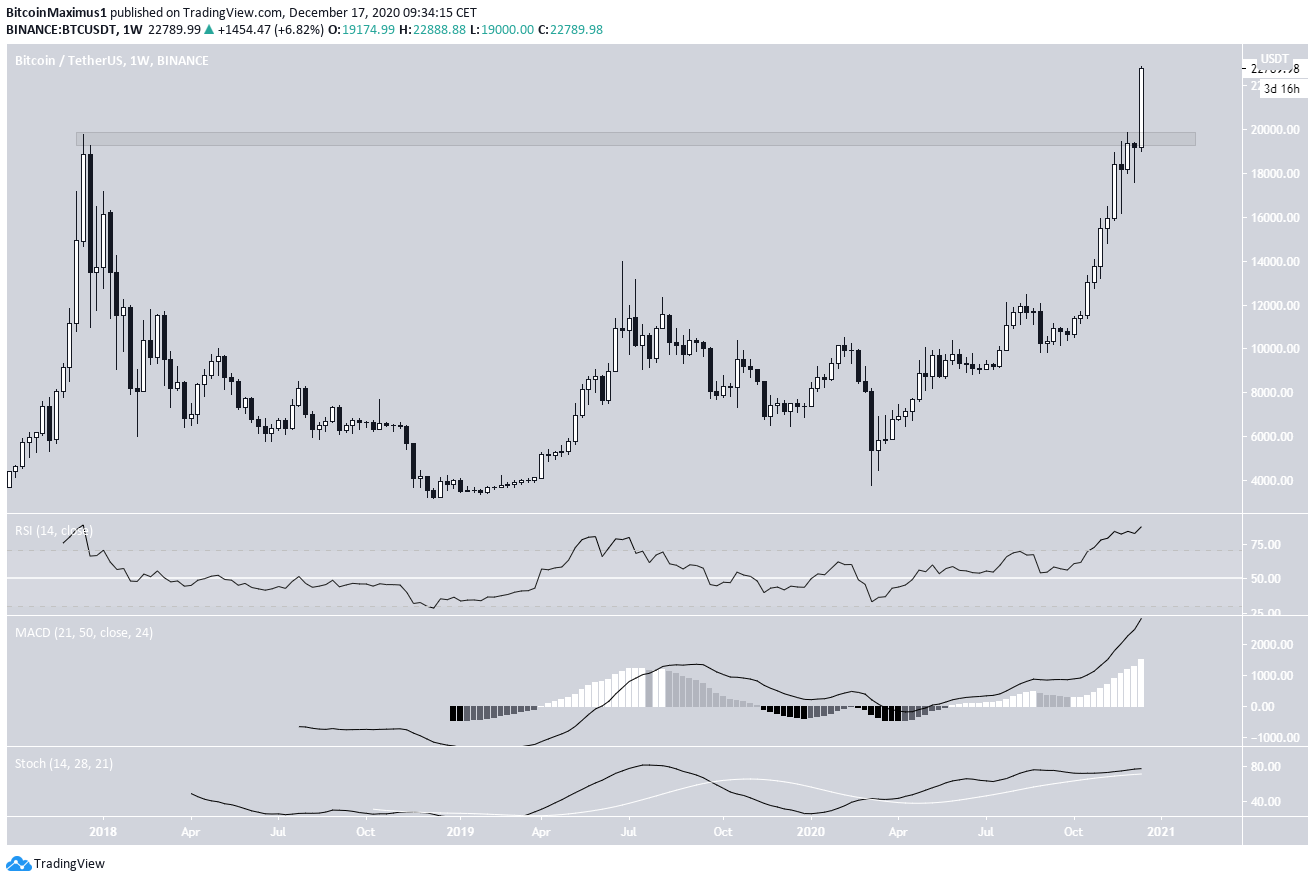
The Bitcoin (BTC) price has broken out above the previous resistance area at $19,450 and proceeded to reach a new all-time high.
This is likely the fifth wave in a bullish impulse which is expected to take Bitcoin to higher targets.
Bitcoin Breakout Leads To All-Time High
Yesterday, the BTC price broke out and has now moved considerably above the $19,450 resistance area. It is currently making new all-time highs, briefly reaching $23,745 before getting knocked back.
Technical indicators are bullish despite the rally being overbought. This suggests that BTC is likely to continue moving higher.
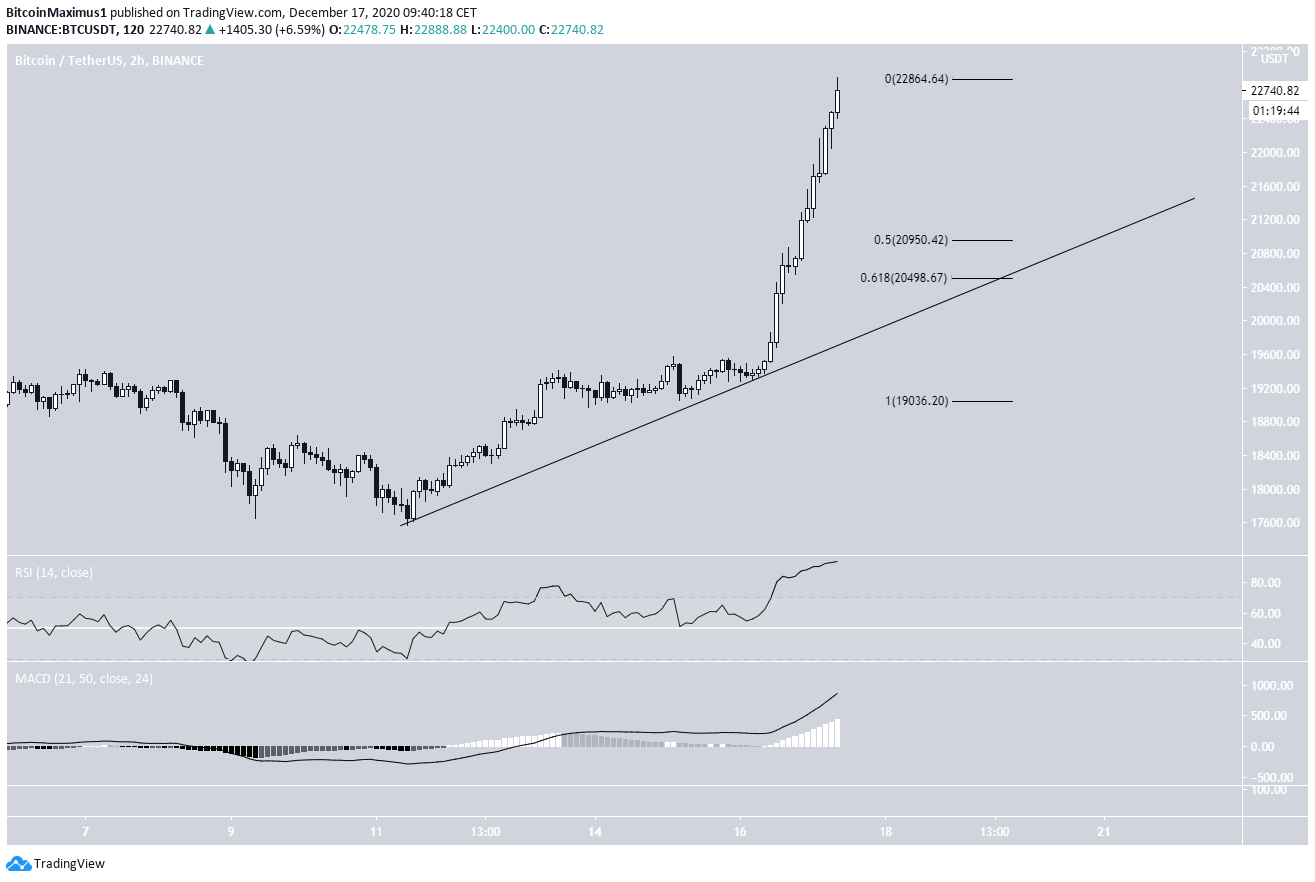
The two-hour chart shows that BTC is following an ascending support line that was validated right before the upward move accelerated yesterday.
The line currently coincides with the 0.5-0.618 Fib retracement of the upward move, so a drop to validate the line would make sense for a healthy correction.
However, technical indicators do not yet show any weakness, indicating that BTC could continue moving upwards.
BTC Wave Count
In BeInCrypto’s wave count article from Tuesday, we stated that:
“Bitcoin is expected to resume its upward movement and eventually reach a high between $25,500-$26,300, which is the most likely region for the fifth wave (blue) to end.”
While the target wave count has been slightly altered, BTC still appears to be in wave five (shown in blue below).
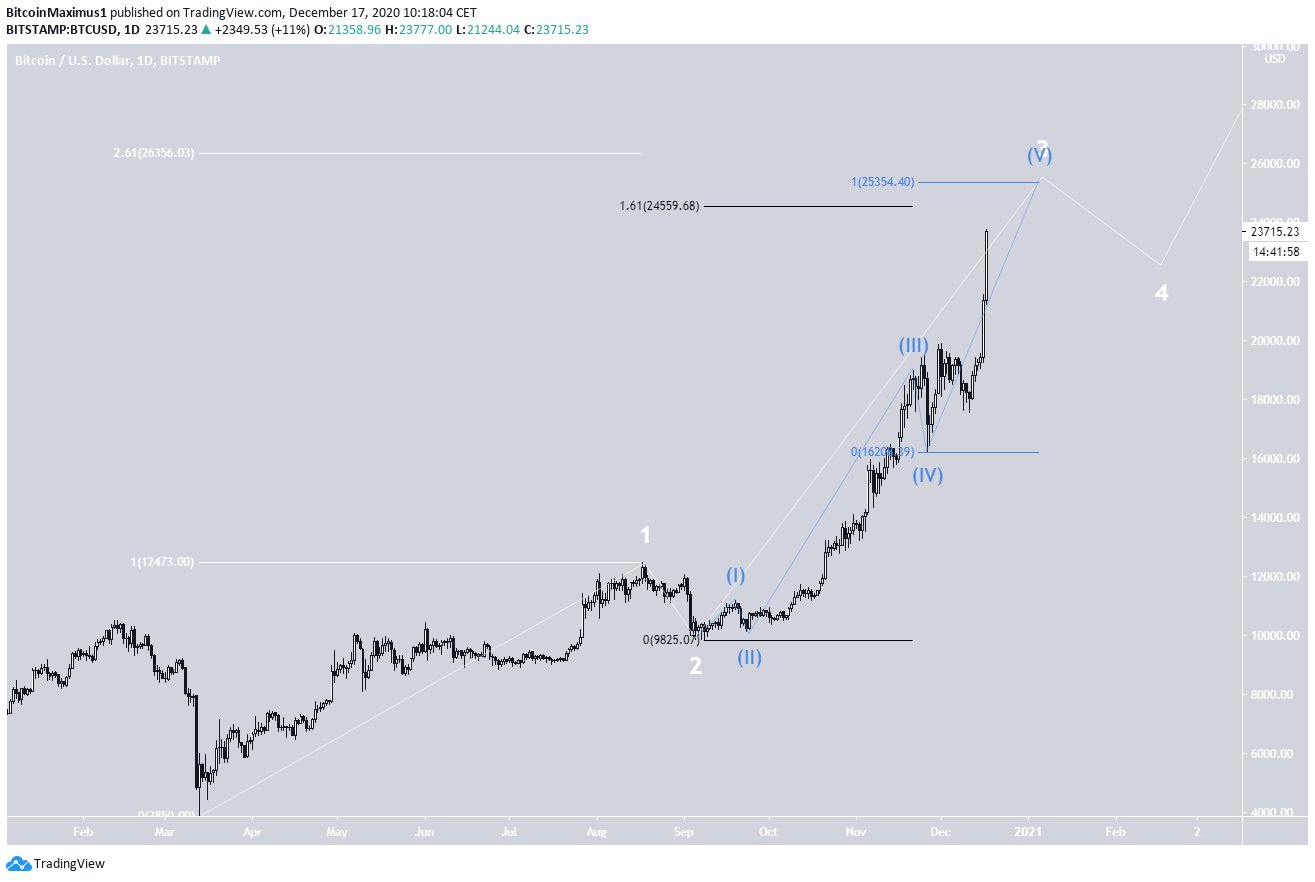
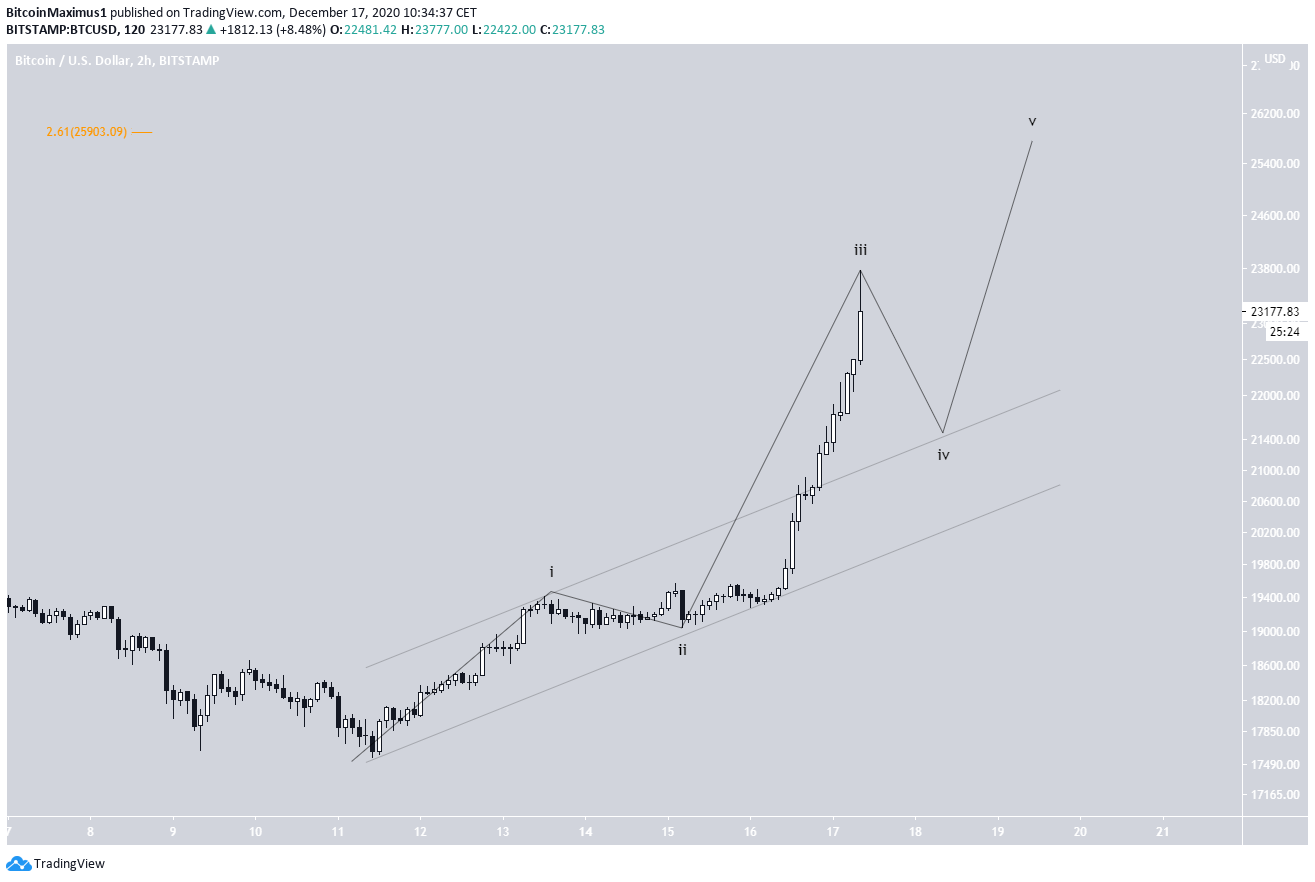
The shorter-term count has more ambiguity to it. BTC seems to be in sub-wave 3 (shown in orange below) of a five sub-wave formation.
The two likeliest targets for sub-wave 3 to end are $23,629 or $25,819. BTC is expected to drop slightly after this, possibly to validate the channel it has broken out from and move upwards one final time in order to complete wave 5.
A decrease below the wave 1 high at $19,918 would invalidate this particular wave count.
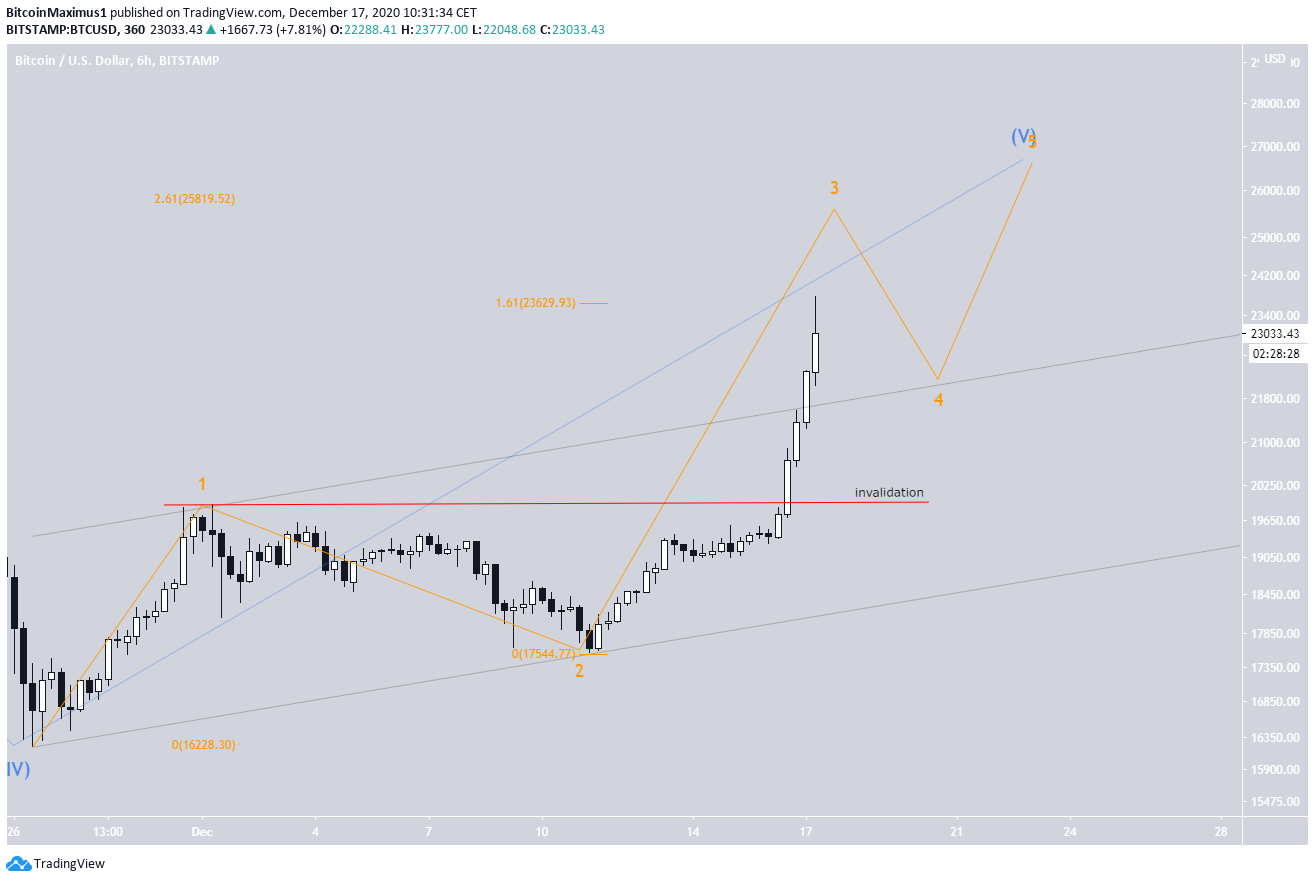
The two-hour chart shows the minor sub-wave count (shown in black below) for sub-wave 3, which suggests BTC has another upward move before it completes sub-wave 3.
Conclusion
The Bitcoin price is expected to continue increasing at least until it reaches the range near $26,000.
For BeInCrypto’s previous Bitcoin (BTC) analysis, click here!
Disclaimer: Cryptocurrency trading carries a high level of risk and may not be suitable for all investors. The views expressed in this article do not reflect those of BeInCrypto.
Trusted
Disclaimer
In line with the Trust Project guidelines, this price analysis article is for informational purposes only and should not be considered financial or investment advice. BeInCrypto is committed to accurate, unbiased reporting, but market conditions are subject to change without notice. Always conduct your own research and consult with a professional before making any financial decisions. Please note that our Terms and Conditions, Privacy Policy, and Disclaimers have been updated.
