In today’s long-term bitcoin (BTC) analysis, BeInCrypto looks at the structure of historical BTC cycles in relation to logarithmic regression bands and macro Fibonacci levels. The aim of the analysis is to determine the potential range of bitcoin prices for the end of the current cycle and the possible time frame for reaching them.
Many analysts, who pay most attention to four-year halving cycles, argue that the peak of the ongoing cycle will be reached in late 2021 or Q1 2022. Our analysis shows a scenario where the peak of the current bull market may indeed be reached at the end of 2022.
Bitcoin cycles
Bitcoin cycles can be measured in very many different ways: from halving to halving, peak to peak, bottom to bottom, etc. In this analysis, we only look at the structure of four bull markets, measuring from absolute low to absolute high. Bear market periods leading from peak to bottom will not be that relevant to us.
It’s worth noting that the mere assumption that bitcoin price action on a macro scale is subject to some cycles is only a hypothesis. One can try to derive verifiable claims about the future of BTC based on it. However, it can also be falsified and rejected in the future.
Measured from the absolute bottom to the absolute peak of a given cycle and taking into account the so-called genesis cycle (cycle 1), most analysts agree that the history of bitcoin so far consists of four cycles. Each is characterized by a certain length (expressed in weeks, blue) and a maximum return on investment (ROI, expressed in percentage, green).
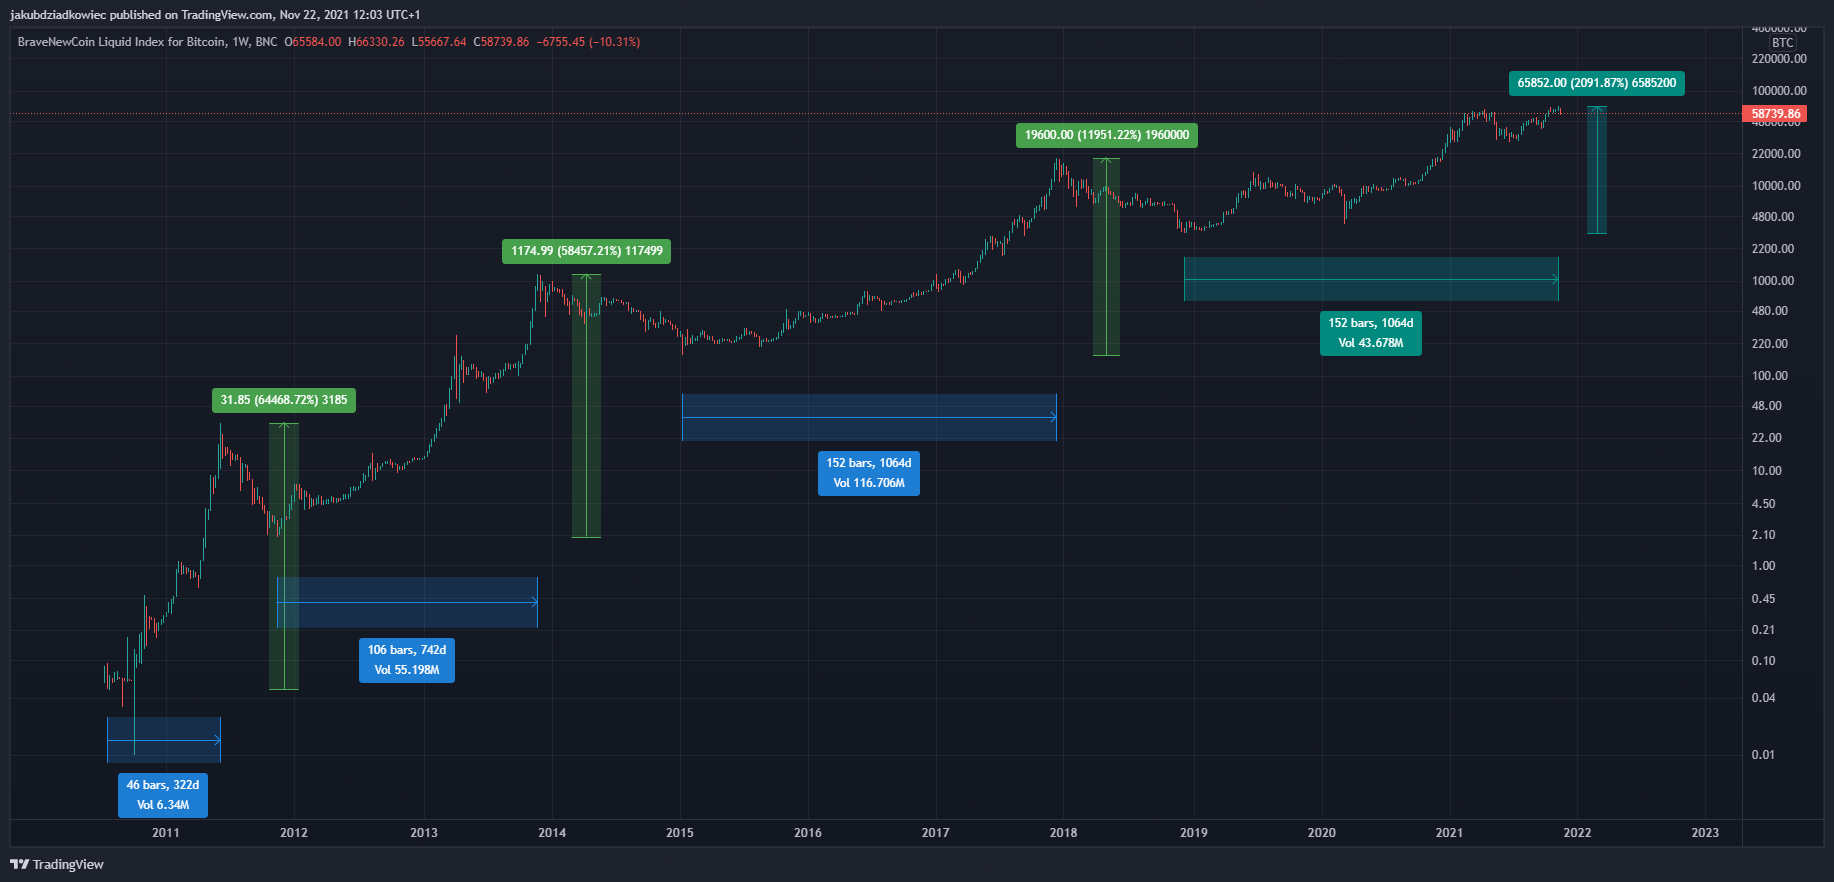
It should be mentioned that the celadon values that mark the current cycle are not yet known, as we do not know whether the cycle has already ended. If the current all-time high (ATH) at $69,000 was the absolute peak of this cycle, then these values will no longer change. However, if bitcoin sets a new ATH relatively soon, then the celadon values can help us estimate where the cycle currently stands.
Is the bitcoin bull cycle over yet?
Let’s look at the numbers and first compare the ROI from bottom to peak for each cycle:
- 1st cycle – 64,468%
- 2nd cycle – 58,457%
- 3rd cycle – 11,951%
- 4th cycle – 2,091% (so far)
Next, let’s compare the duration of the cycles from bottom to peak:
- 1st cycle – 46 weeks
- 2nd cycle – 106 weeks
- 3rd cycle – 152 weeks
- 4th cycle – 152 weeks (so far)
Two simple conclusions, long taught by Benjamin Cowen, immediately come to mind. They were also recently pointed out by Eric Crown in his recent YouTube video. Namely — diminishing ROI and lengthening cycles. However, looking at the ongoing cycle, we see that the decline in ROI is (so far) far greater compared to previous cycles, and the duration is (so far) the same as the previous cycle.
Historically we would expect a higher ROI, by around 100-150%, and a more extended cycle, by around 20-40%. If indeed this were to happen, then the current cycle should deliver a maximum ROI of 4,000%-5000% and should last 182-212 weeks.
This gives us the first indication that cycle 4 is not yet over.
Logarithmic bands
Logarithmic regression bands are a neat tool to illustrate the range of long-term price action for bitcoin. The bottom band (green) is calculated based on the “fair value” of bitcoin, i.e. based on the average price over the entire history of BTC. Its structure is the best defined and determines the periods in which it was most profitable to invest in BTC.
The upper band (red) actually refers only to the 3 narrow price ranges when BTC peaked in the following cycles: 2011, 2013, and 2017. Thus, the degree of accuracy of the red band is significantly lower than that of the green band. When the BTC price reached the upper band, historically these were the best times to sell.
The middle band (yellow), on the other hand, is the median of the previous two bands and indicates periods when the BTC price rose above its “fair value” but has not yet reached extremes. Despite this, most often a sharp rise to the middle band resulted in a deeper correction. Only after this was completed did the way to the top of the long-term bull market open up.
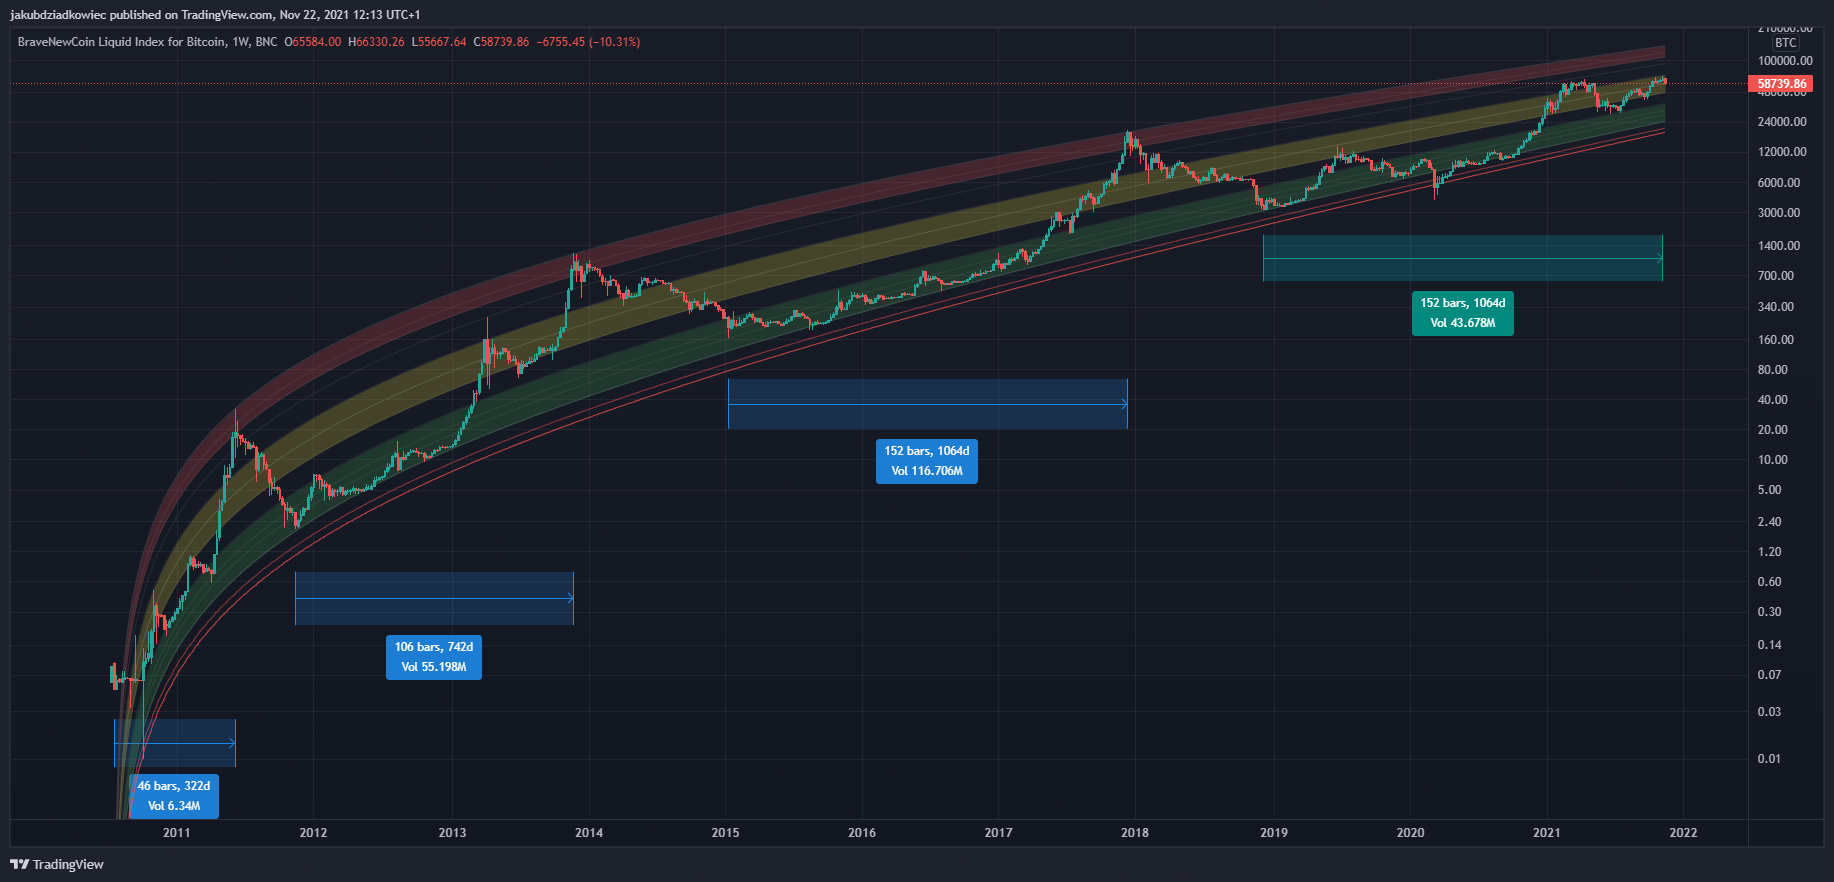
In the ongoing cycle, we observe that between October 2020 and April 2021, the BTC price rose rapidly into the yellow band region. This was followed by a 3-month correction and resumption of the uptrend, which again led to the upper line of the yellow band.
However, the price is still far away from the red band, whose current range is $110,000 – $140,000. Thus, if bitcoin were to end the bull market in the coming weeks, a peak should be sought in this range. However, if we do not experience a parabolic rally soon, higher prices are possible over time as the value of each band increases over time.
On the basis of the long-term analysis of the logarithmic bands, we get a second premise in favor of the thesis that cycle 4 is not over yet.
Fibonacci levels
The third argument of this analysis, which is to suggest that the current cycle may still last for a long time, is an analysis of the long-term Fibonacci (Fib) levels for each cycle. It turns out that the peak of each BTC cycle was reached in the range of external 2.272-2.618 Fib retracement levels measured from the peak of the previous cycle to the bottom of the next cycle.
Extrapolating this range will allow us to estimate where the BTC peak should occur in the ongoing cycle. However, let’s first take a brief look at each cycle.
Cycle 1: Genesis
The first cycle started with a bottom at $0.05 in July 2010 and ended with a peak at $31.90 in June 2011. Of course, the previous ATH cannot be used as a reference point here. Therefore, we take the local peak at $0.49 and the first major consolidation that followed as a reference point.
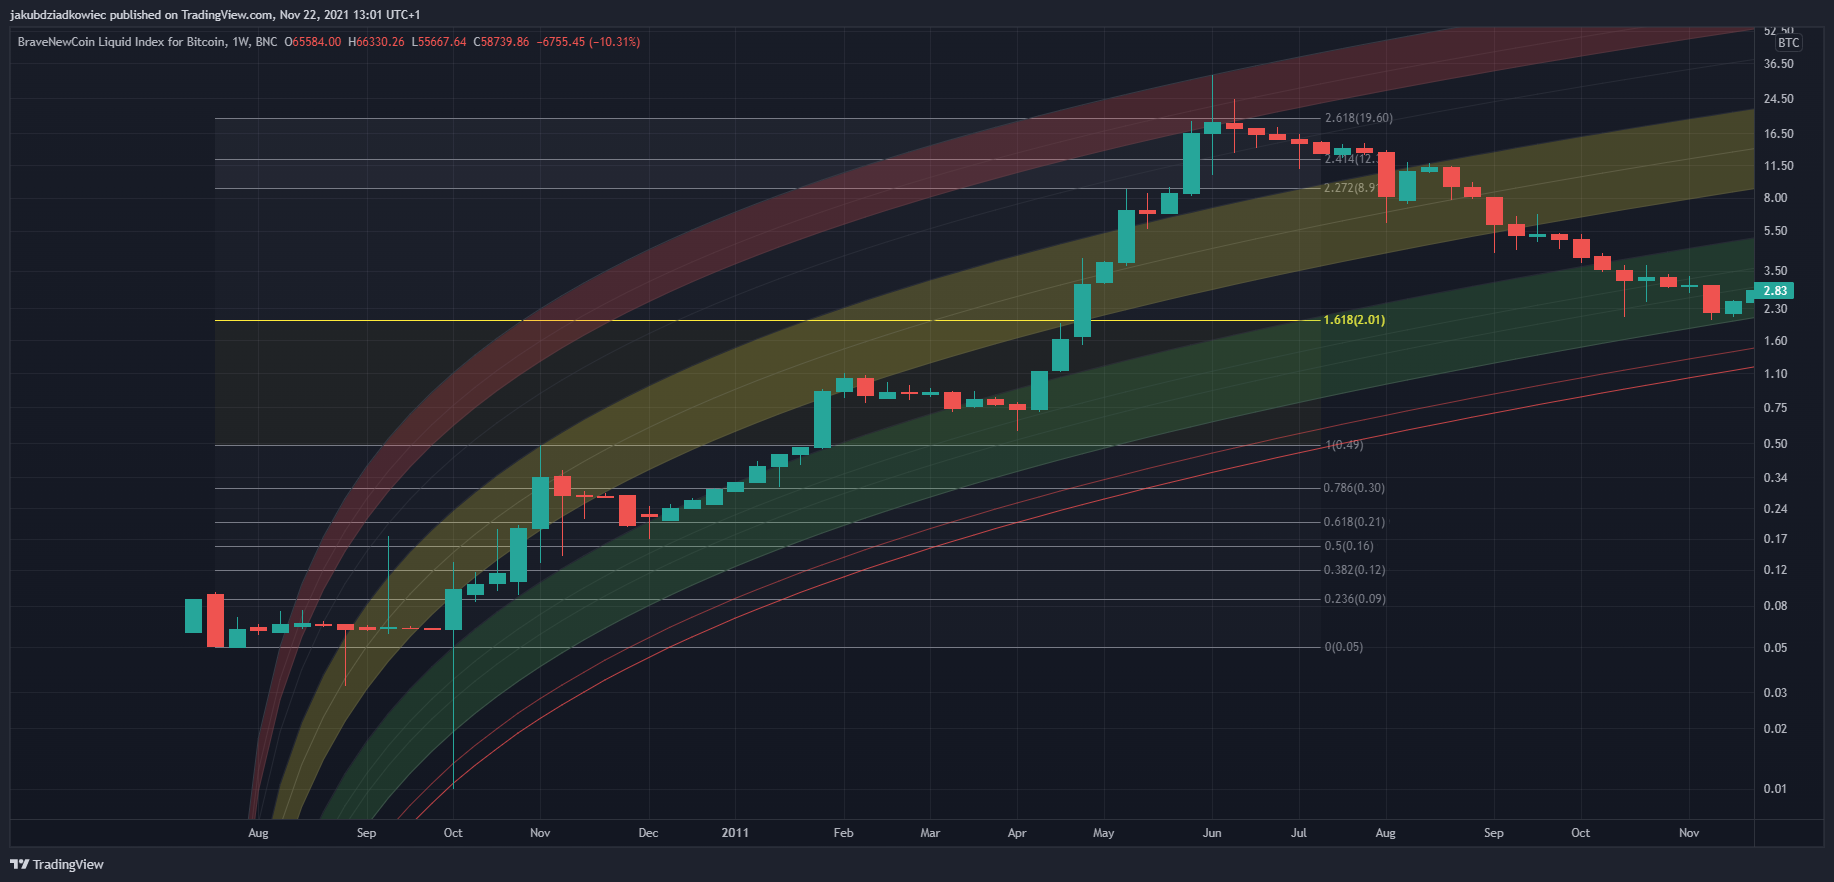
The peak of the first cycle occurred slightly above the 2.618 Fib level in the red band area. In addition, we can see that after the corrections, the level of 1.618 Fib (gold) of $2.01 was broken out, after which the increases became parabolic.
Cycle 2: 2011-2013
The second cycle started with a bottom at $2.01 reached in November 2011 and ended with a peak at $1,177 in November 2013. The peak reached the level of the external 2.272 Fib retracement and the red band area. It’s worth noting the confluence of the 1.618 Fib level of the previous cycle with the bottom of cycle 2 at $2.01.
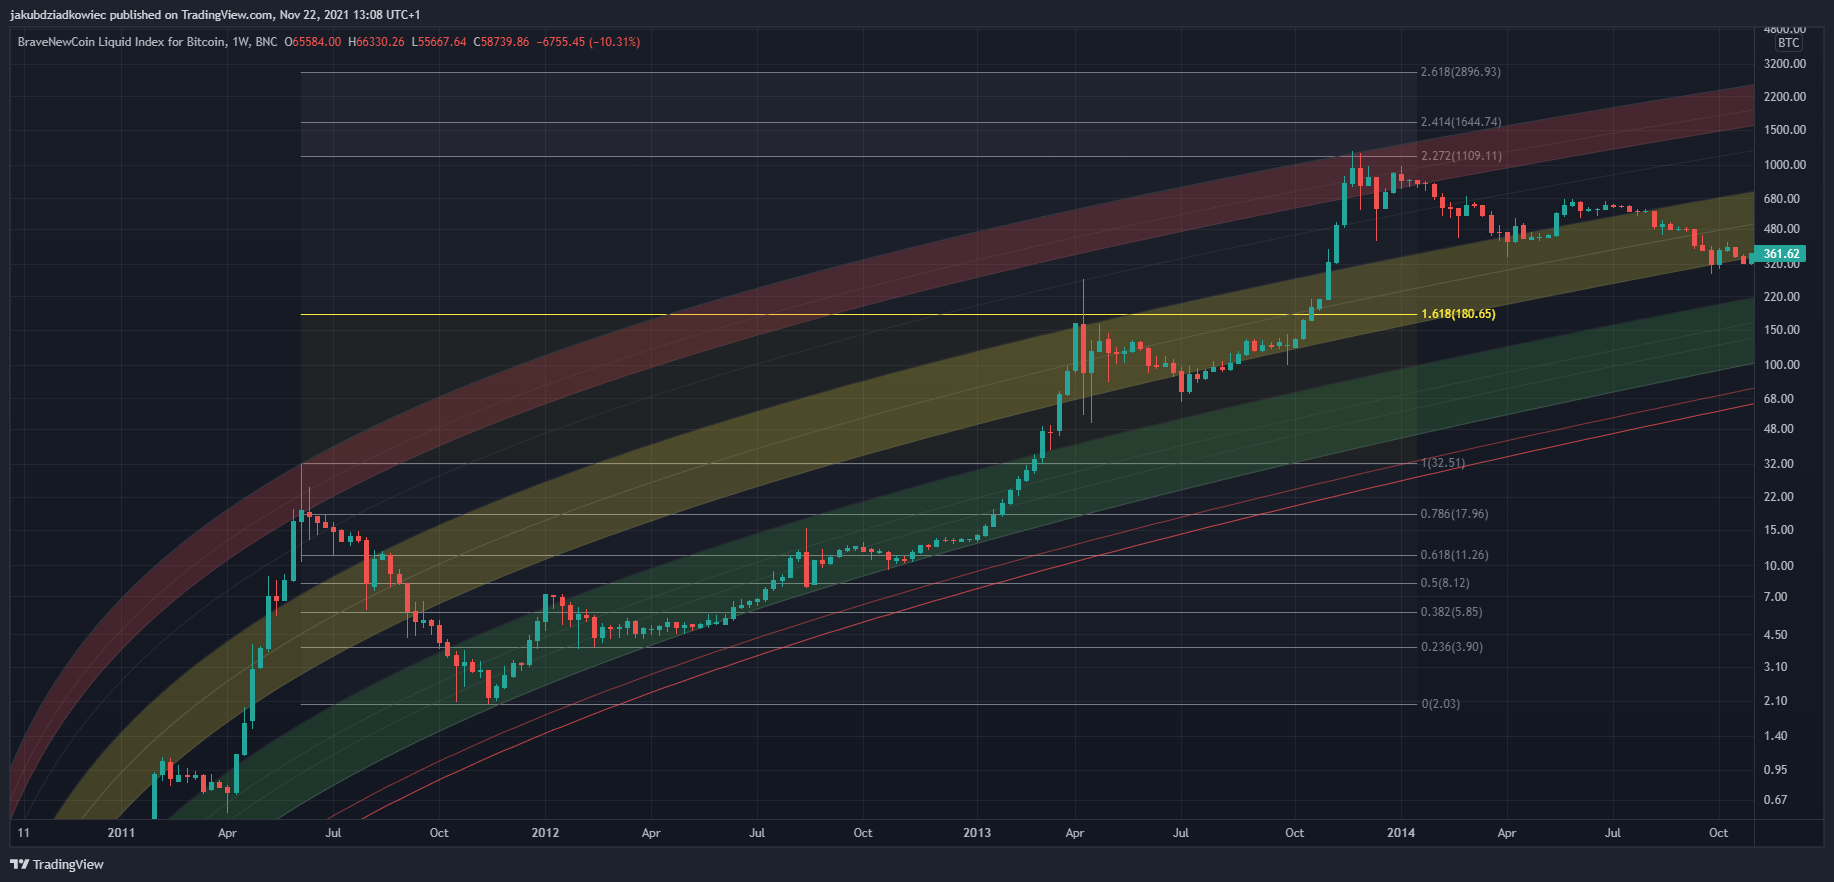
The second cycle is sometimes referred to as the “double peak” cycle. The first peak occurred near the 1.618 Fib retracement, almost perfectly in the upper and lower range of the yellow band. Again here, the breakout of the 1,618 Fib level at $180 was followed by a parabolic rise and peak of the second cycle.
Cycle 3: 2015-2017
Bitcoin’s third cycle was initiated by a bottom at $164 in January 2015 and ended with a peak at $19,764 in December 2017. The peak came at the external 2.414 Fib retracement level and of course at the top of the red band.
Here we also see the confluence of the 1.618 Fib level of the previous cycle with the low at $164.
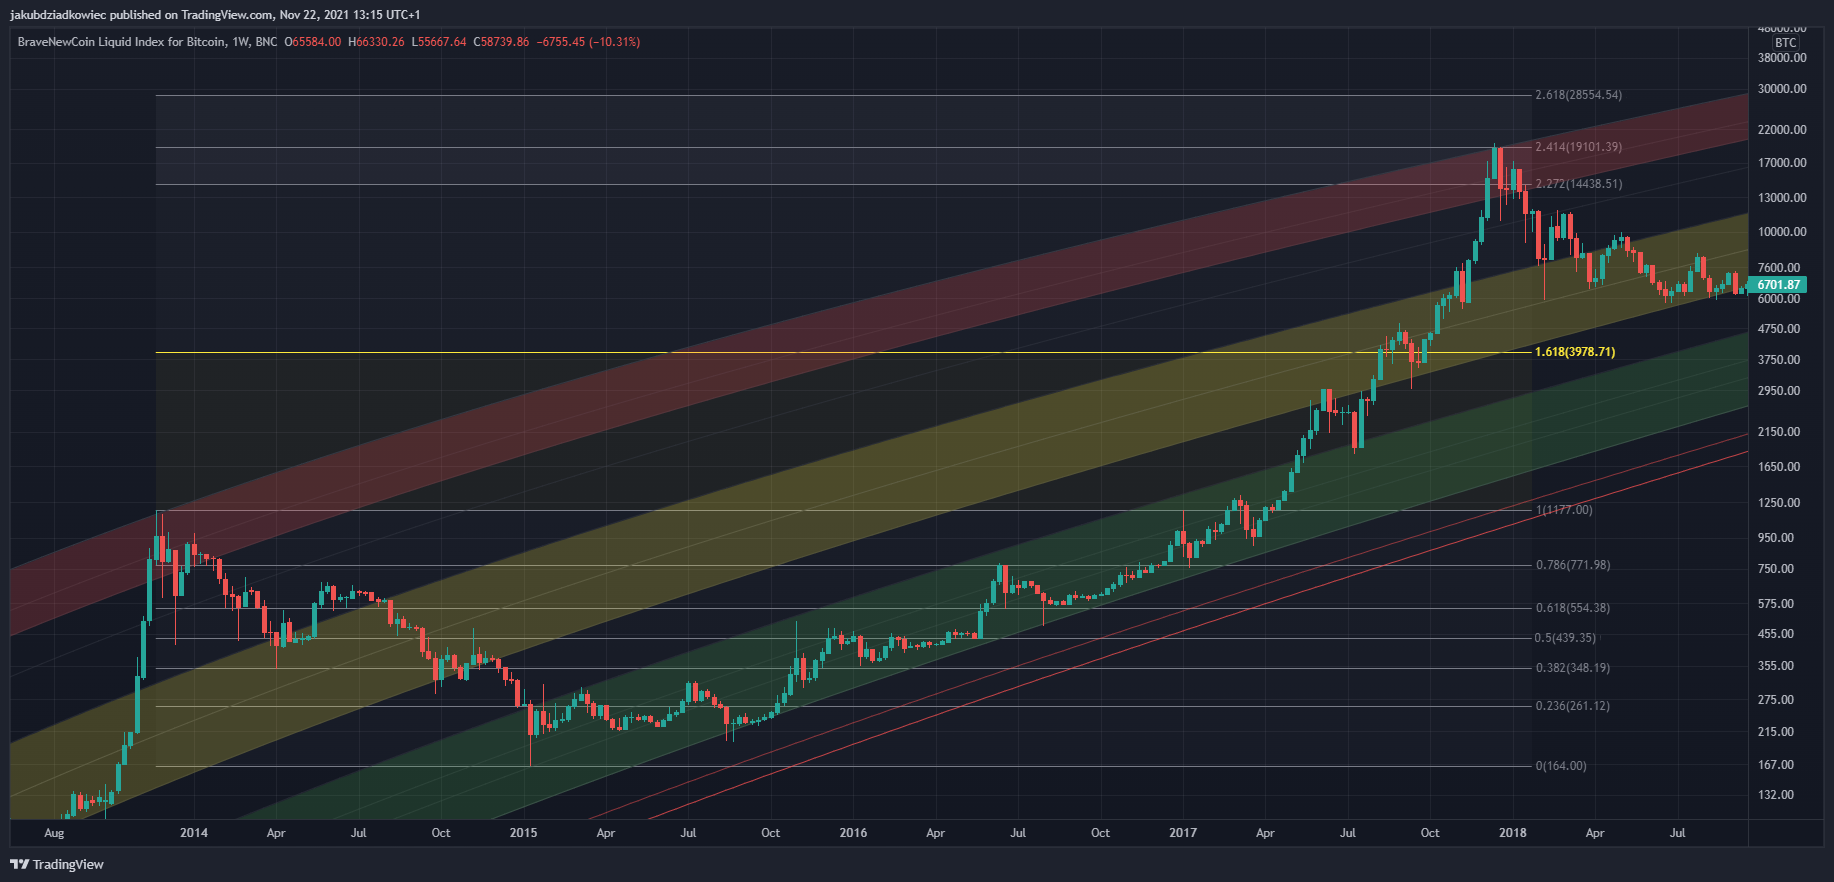
The rise of the previous cycle was much more stable than in previous cases. However, here too we see a certain period of consolidation in the yellow band area and the 1.618 Fib level at $3978. After its definitive breakout, the last phase of exponential growth took place.
Cycle 4: 2018-now
The current cycle four started with a bottom at $3,148 and has so far managed to establish the ATH at $69,000. The cycle bottom again corresponds with the 1.618 Fib level of the previous cycle — a regularity that ties successive cycles together.
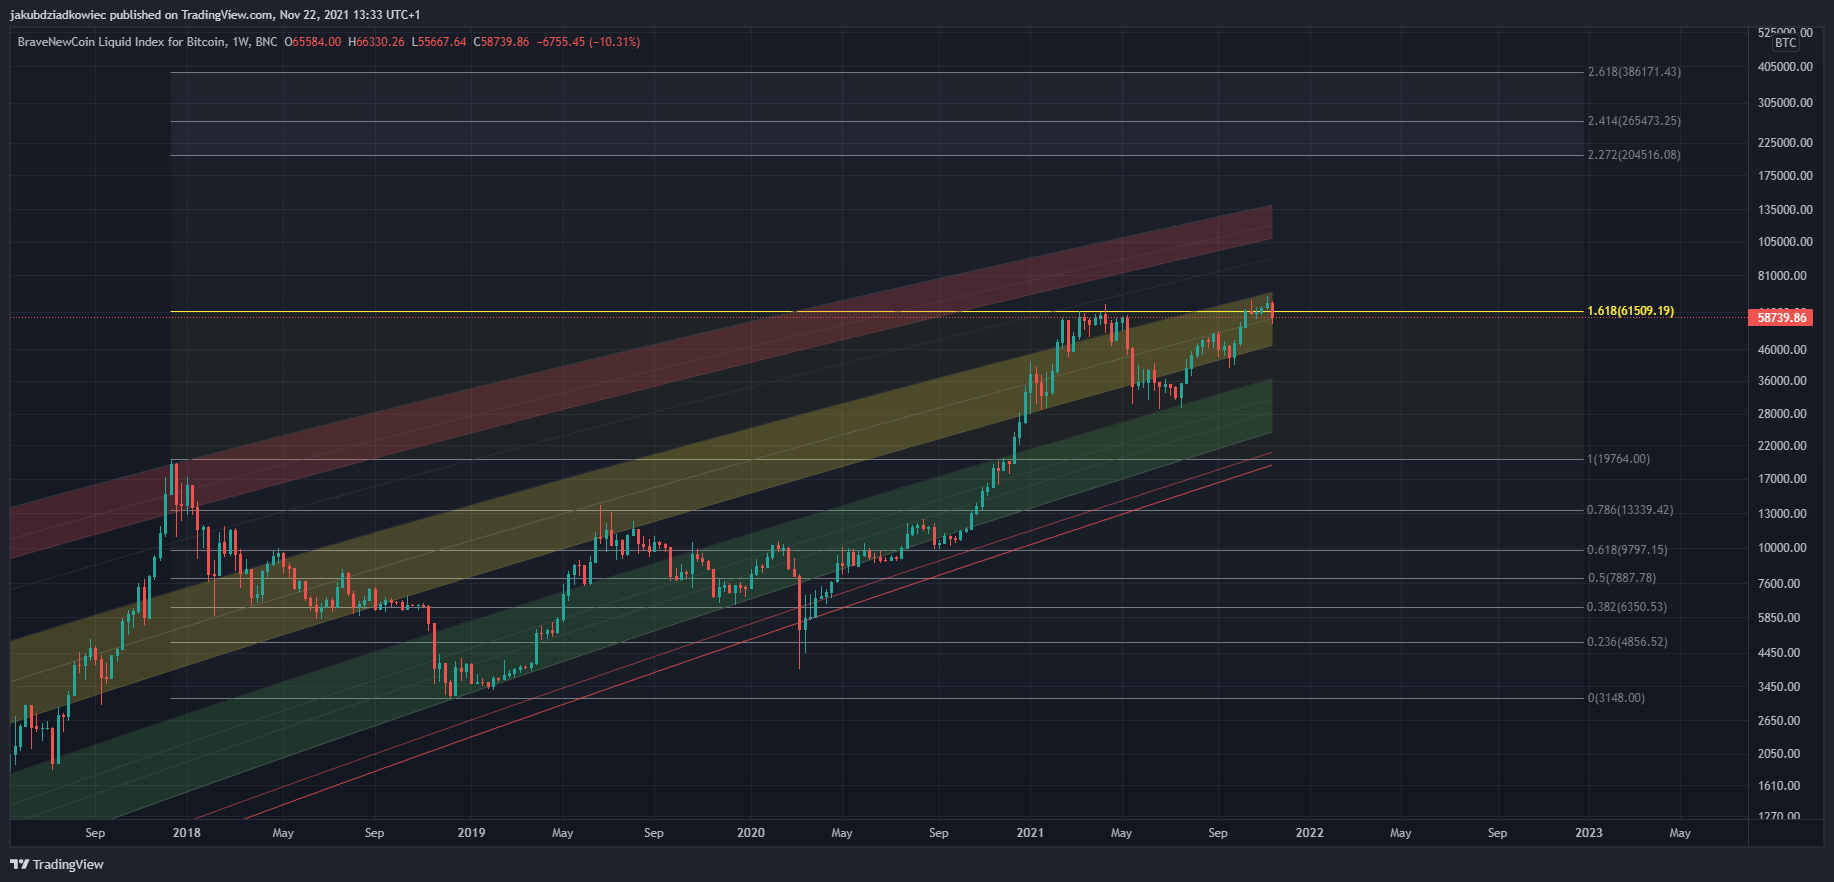
It is extremely interesting to note that the current price action and the historical ATH in April 2021 at $64,840 are located at the external 1.618 Fib retracement level of this cycle. This level served as resistance in April, which was followed by a correction.
Today, as bitcoin oscillates around $60,000 attempts are underway to break through this Fib level and begin the next phase of the uptrend. Historically, we know that this can be the most violent phase that historically yields the greatest ROI.
Conclusion: Where and when will Bitcoin peak?
Bitcoin is struggling to break through the critical 1.618 Fib level in the current cycle. This area is located in the yellow band and has never served as a historical long-term bull market peak. If history were to repeat itself then the peak should be sought somewhere in the 2.272-2.618 Fib range. This corresponds to a range of $205,000-$386,000.
Extrapolating the trajectory of the red band, we can see that it enters this range over time. However, the amount of time needed to reach these values implies that the bull market will still last between 38 and 58 weeks (blue lines). Thus, it could even end in late 2022 or early 2023.
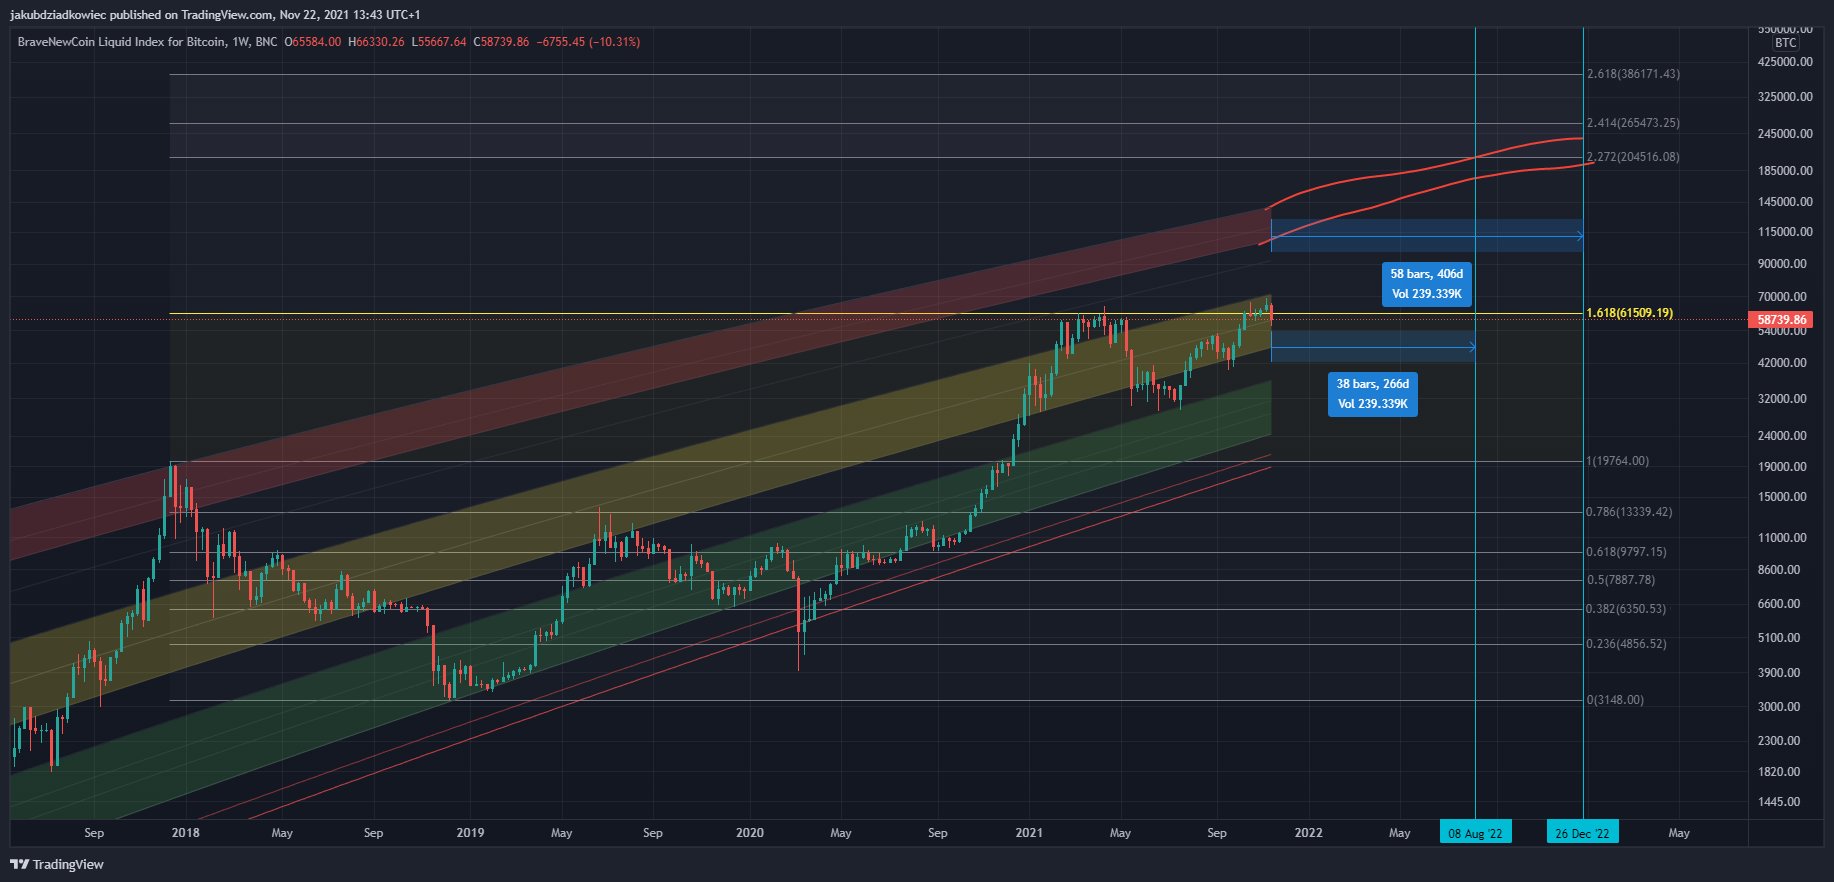
These values are in some confluence with our estimates in the second section. This is because they would assume a cycle extension of 20-40% relative to the previous one and an ROI that does not decrease so sharply. Indeed, the maximum ROI would still be lower than in the previous cycle, but nevertheless higher than the current 2,091%.
For BeInCrypto’s latest Bitcoin (BTC) analysis, click here.
Trusted
Disclaimer
In line with the Trust Project guidelines, this price analysis article is for informational purposes only and should not be considered financial or investment advice. BeInCrypto is committed to accurate, unbiased reporting, but market conditions are subject to change without notice. Always conduct your own research and consult with a professional before making any financial decisions. Please note that our Terms and Conditions, Privacy Policy, and Disclaimers have been updated.