

On August 20, 2019, the Bitcoin price reached a high of $10,993. A gradual decrease followed and the cryptocurrency market leader made a lower high of $10,892 on the next day. A rapid decrease ensued and the BTC price decreased by more than seven percent in roughly seven hours. Since then, it has been gradually decreasing.
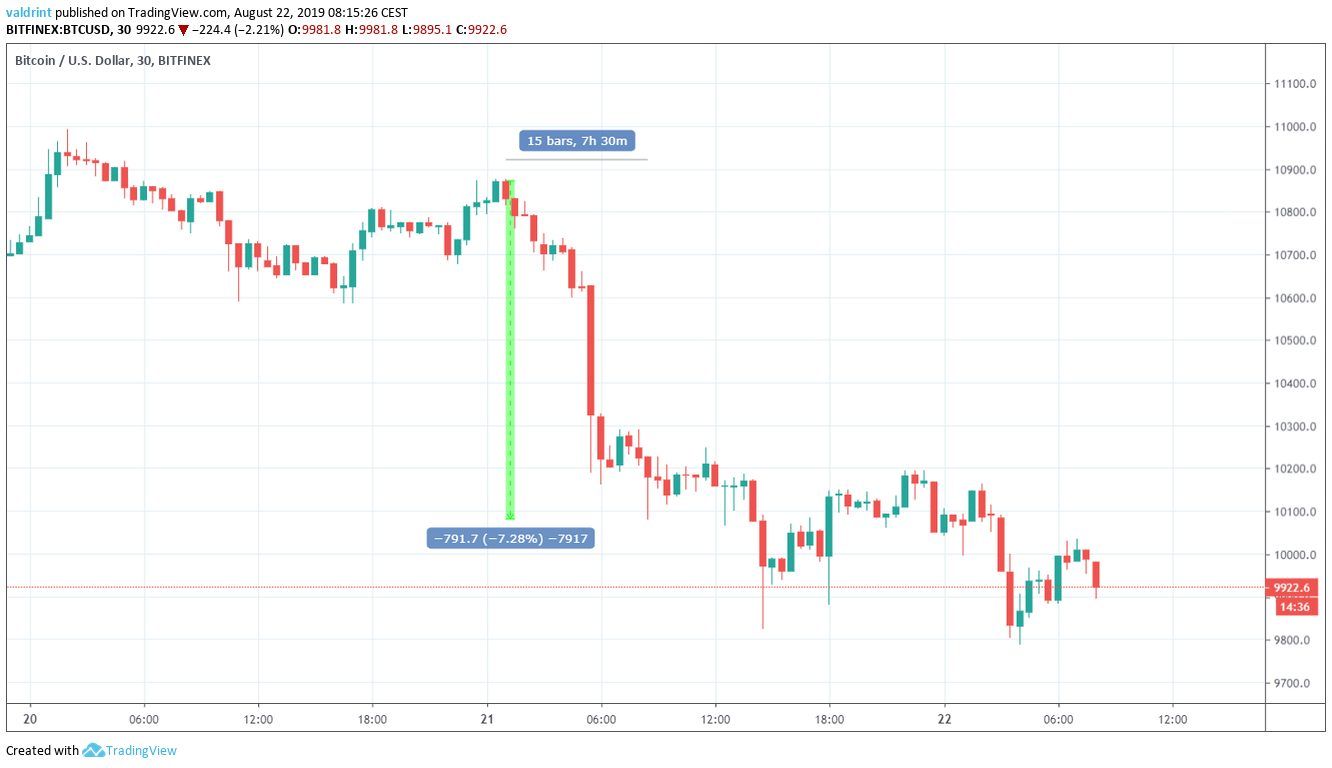 At the time of writing, it was trading close to $9900.
Where will the BTC price make a bottom? Continue reading if you want to find out.
For our previous analysis, click here.
If you are interested in trading Bitcoin (BTC) and other cryptocurrencies with a multiplier of up to 100x on our new partner exchange with the lowest fees, follow this link to get a free StormGain account!
At the time of writing, it was trading close to $9900.
Where will the BTC price make a bottom? Continue reading if you want to find out.
For our previous analysis, click here.
If you are interested in trading Bitcoin (BTC) and other cryptocurrencies with a multiplier of up to 100x on our new partner exchange with the lowest fees, follow this link to get a free StormGain account!

Bitcoin Price: Trends and Highlights for August 22
- BTC/USD is trading inside a descending triangle.
- It is following an ascending support line within the triangle.
- BTC has found support above the 100-day moving average.
- It has completed a flat and an A-B-C correction.
- The final wave will either be a triangle or a zigzag.
Ascending BTC Price Support Line
A look at the six-hour time-frame shows that BTC has been trading inside a descending triangle since June 24.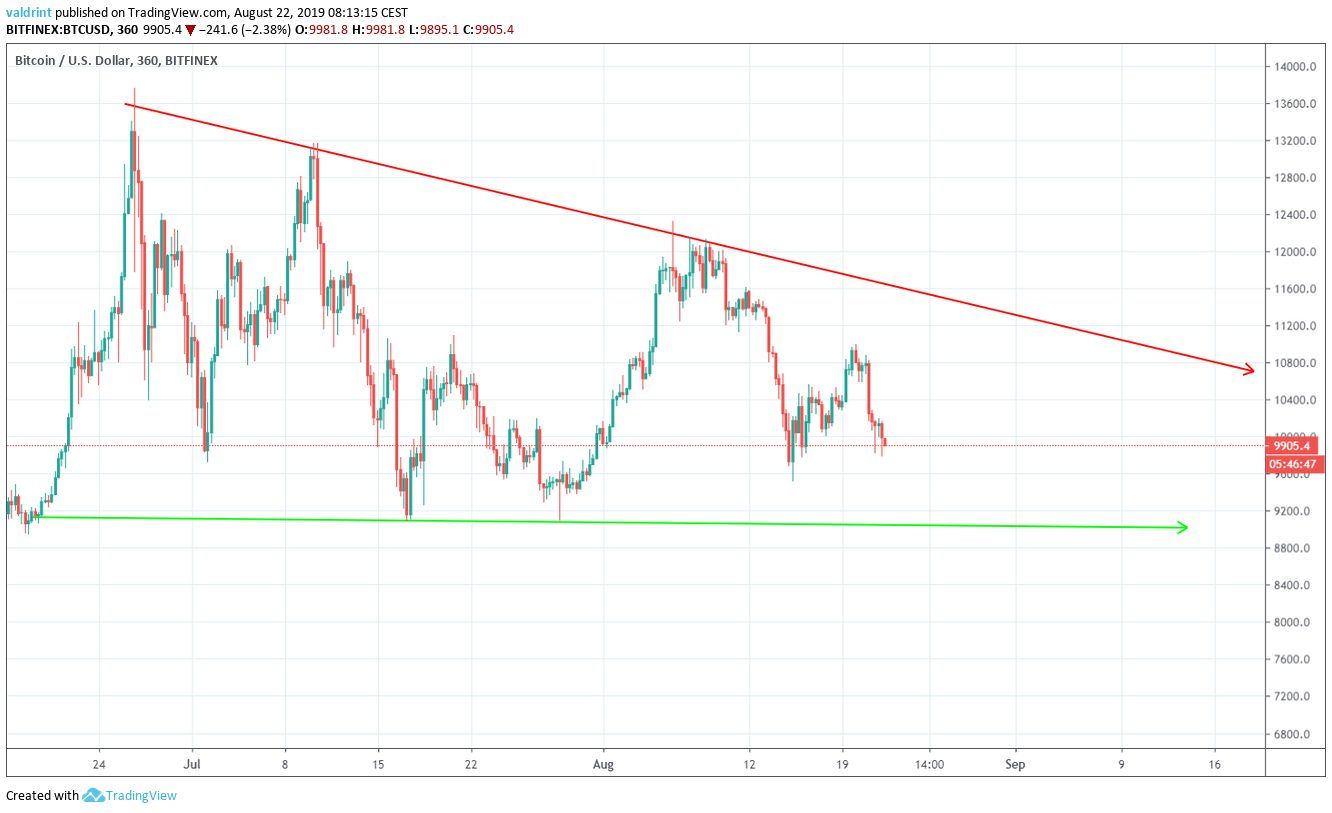 The descending triangle is considered a bearish pattern, making a price breakdown more likely.
However, recent price movement — most notably the creation of higher lows with long lower wicks on July 28 and August 15 — show us a possible ascending support line that the price has been following:
The descending triangle is considered a bearish pattern, making a price breakdown more likely.
However, recent price movement — most notably the creation of higher lows with long lower wicks on July 28 and August 15 — show us a possible ascending support line that the price has been following:
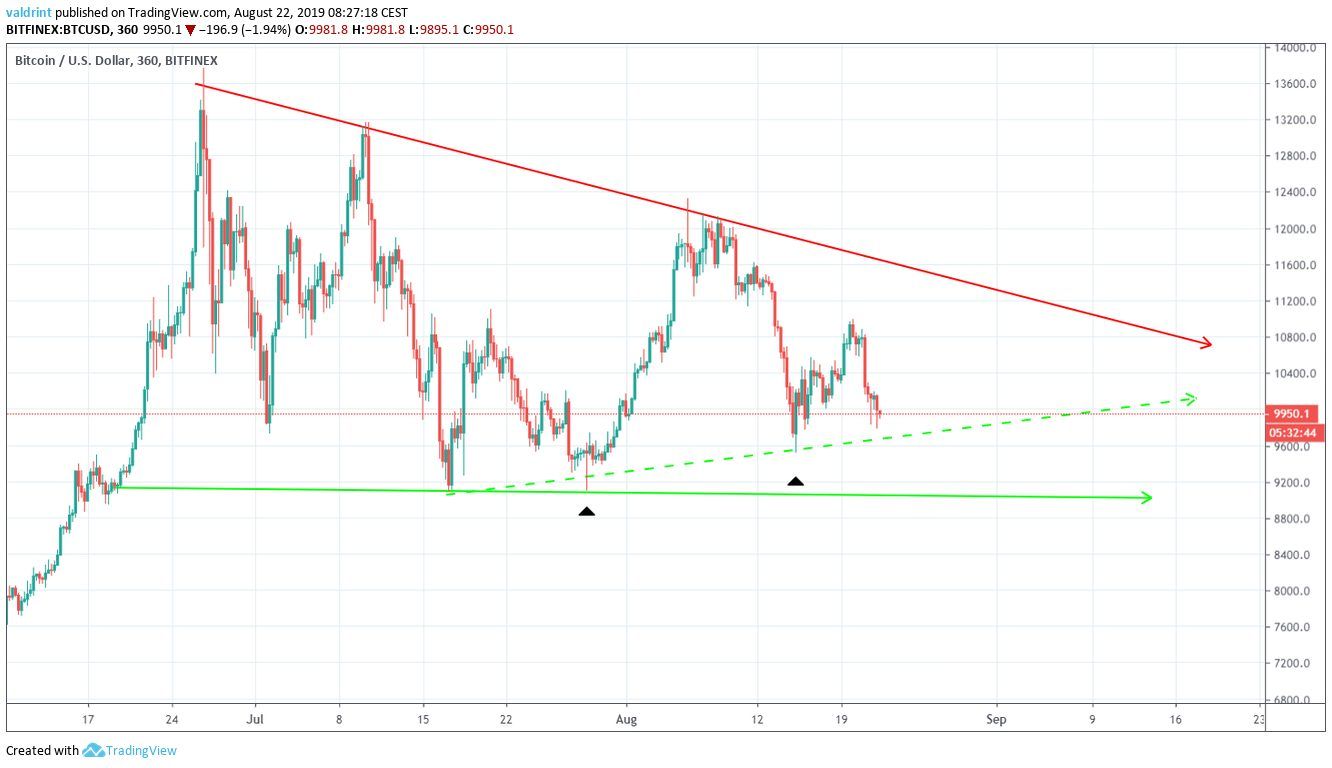 Since the price has not touched the original support line since July 28 (July 15 if we discount the wick on July 28), the new support line is worth considering as a possibility.
If the Bitcoin price continues following it, it would create a symmetrical triangle.
This view is supported by the 100-day moving average (MA).
Since the price has not touched the original support line since July 28 (July 15 if we discount the wick on July 28), the new support line is worth considering as a possibility.
If the Bitcoin price continues following it, it would create a symmetrical triangle.
This view is supported by the 100-day moving average (MA).
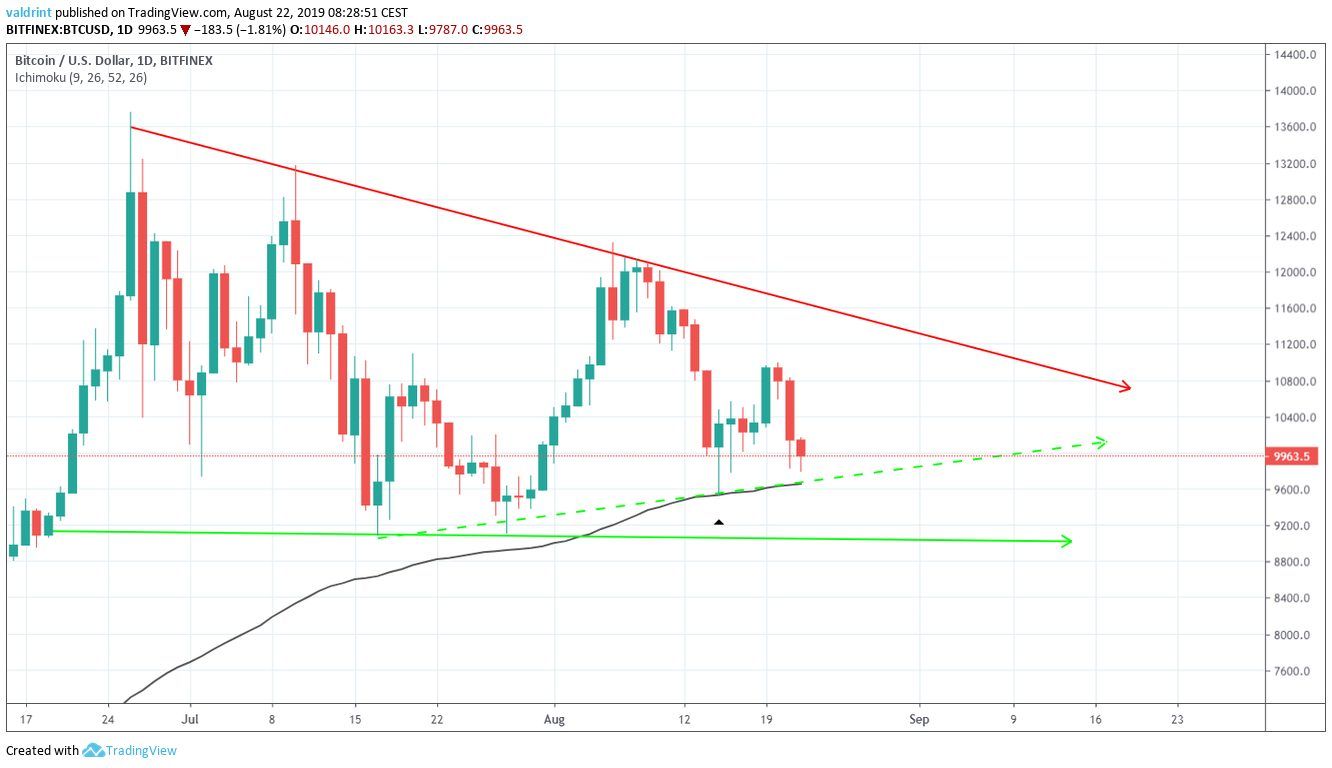 The Bitcoin price has seemingly found support above it.
Most notably, it bounced on it on August 15, creating a bullish reversal candlestick.
I think the 100-day MA can serve as a satisfactory gauge of whether the price is in a bullish or bearish market.
As long as BTC stays above it, we can still consider it bullish in medium-term time-frames.
The Bitcoin price has seemingly found support above it.
Most notably, it bounced on it on August 15, creating a bullish reversal candlestick.
I think the 100-day MA can serve as a satisfactory gauge of whether the price is in a bullish or bearish market.
As long as BTC stays above it, we can still consider it bullish in medium-term time-frames.
Correction Waves
Until now, we have had two corrective waves that lasted approximately 20 days.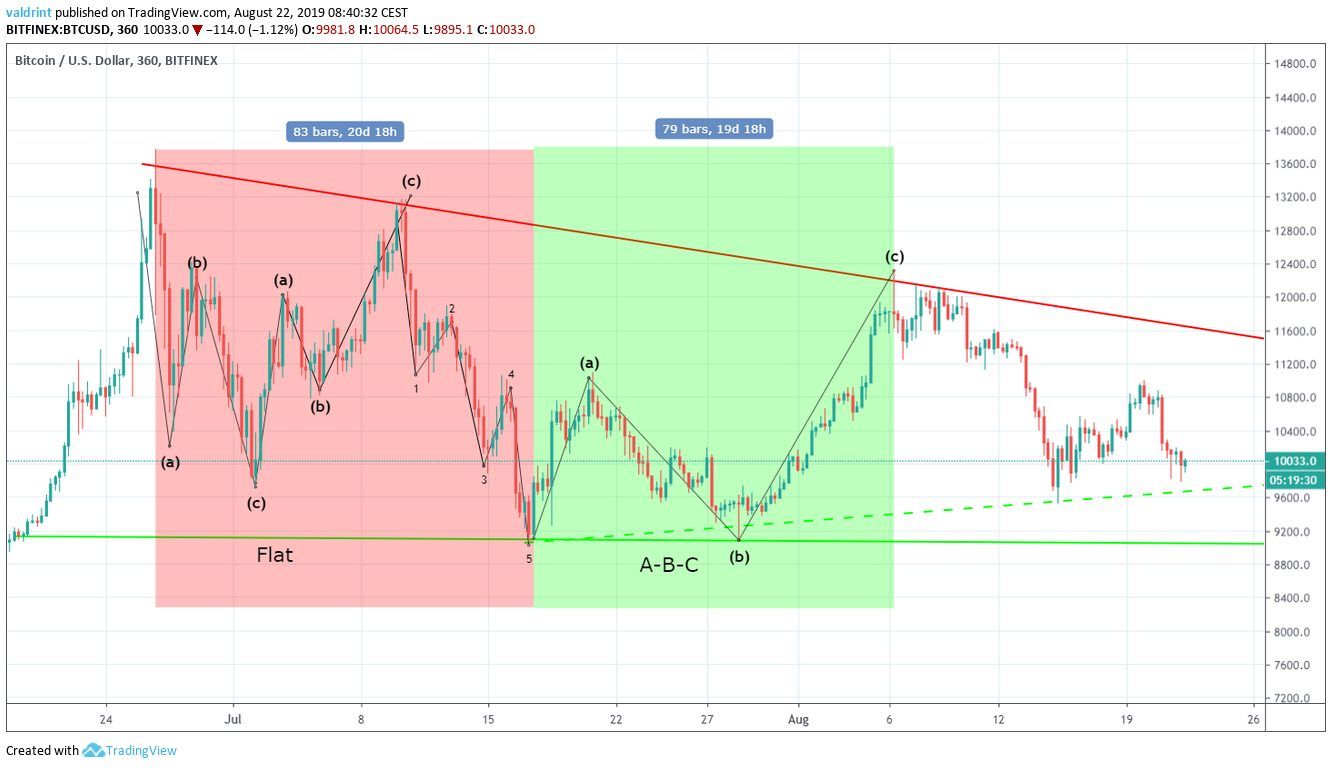 The first one was a flat correction (3-3-5), causing the Bitcoin price to decrease from $13,764 to $9084.
The second one was an A-B-C correction, that caused BTC to reach a high of $12,325.
The first one was a flat correction (3-3-5), causing the Bitcoin price to decrease from $13,764 to $9084.
The second one was an A-B-C correction, that caused BTC to reach a high of $12,325.
Final Wave
If BTC continues to follow the ascending support line, the final wave will likely be a symmetrical triangle.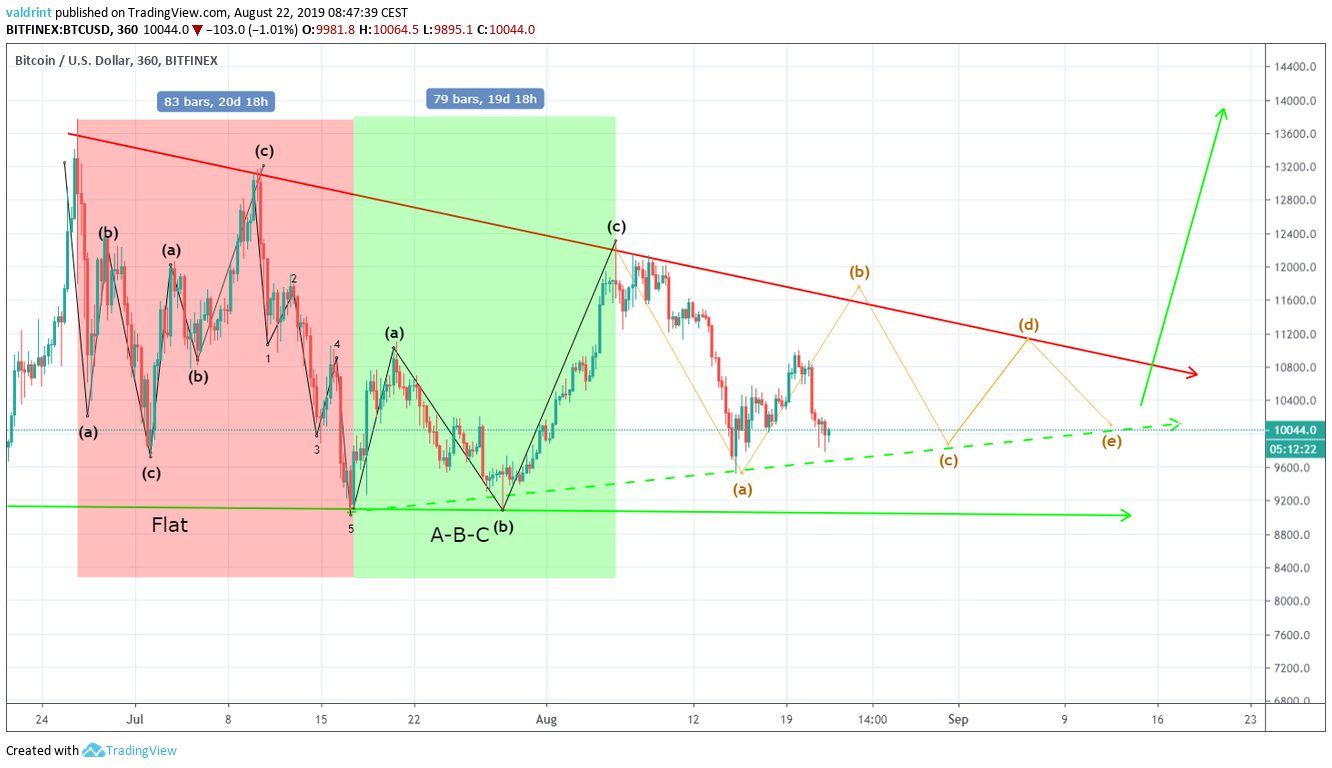 While recent price movement makes this possibility likely, we need to keep in mind that this since this is a bullish correction — in this scenario we have already reached our local bottom.
The long-term divergence and overall bearish outlook make us skeptical about it.
Instead, the Bitcoin price is likely to follow a zigzag correction:
While recent price movement makes this possibility likely, we need to keep in mind that this since this is a bullish correction — in this scenario we have already reached our local bottom.
The long-term divergence and overall bearish outlook make us skeptical about it.
Instead, the Bitcoin price is likely to follow a zigzag correction:
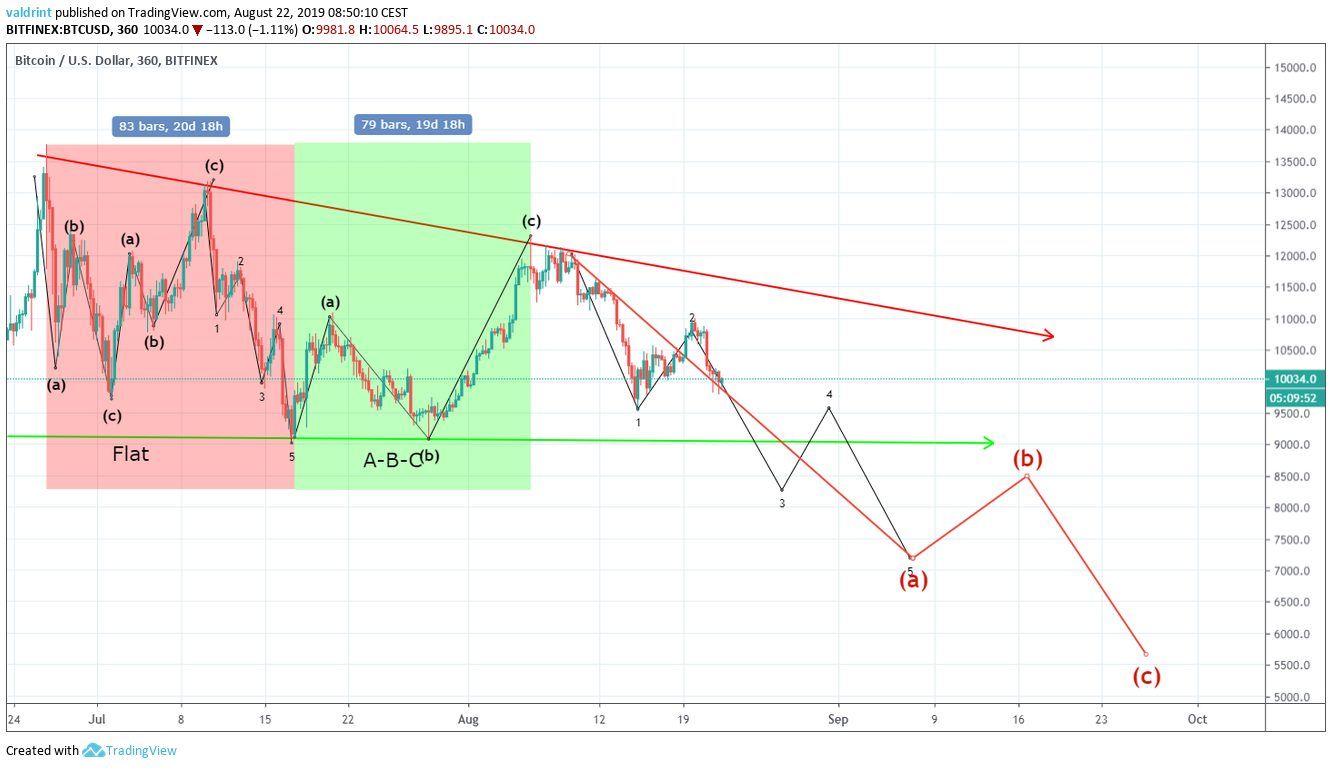 While we believe this possibility to be more likely, we can use the 100-day MA as an indicator of the market outlook.
As long as we stay above the MA, the triangle correction is more likely.
A breakdown below it would likely mean that BTC will complete a zigzag correction.
While we believe this possibility to be more likely, we can use the 100-day MA as an indicator of the market outlook.
As long as we stay above the MA, the triangle correction is more likely.
A breakdown below it would likely mean that BTC will complete a zigzag correction.
Bitcoin Price Prediction
The Bitcoin price is likely in the final wave of either a triangle or zigzag correction. As long as it stays above the 100-day MA, we will assume it is following a triangle pattern. For trading purposes, this looks like a suitable level to initiate long scalps toward the resistance line, with the 100-day MA acting as our stop-loss level. Do you think the Bitcoin price will complete a triangle or a zigzag correction? Let us know in the comments below.
Disclaimer: This article is not trading advice and should not be construed as such. Always consult a trained financial professional before investing in cryptocurrencies, as the market is particularly volatile. Images are courtesy of Shutterstock, TradingView.
Top crypto projects in the US | April 2024
Trusted
Disclaimer
In line with the Trust Project guidelines, this price analysis article is for informational purposes only and should not be considered financial or investment advice. BeInCrypto is committed to accurate, unbiased reporting, but market conditions are subject to change without notice. Always conduct your own research and consult with a professional before making any financial decisions. Please note that our Terms and Conditions, Privacy Policy, and Disclaimers have been updated.

Valdrin Tahiri
Valdrin discovered cryptocurrencies while he was getting his MSc in Financial Markets from the Barcelona School of Economics. Shortly after graduating, he began writing for several different cryptocurrency related websites as a freelancer before eventually taking on the role of BeInCrypto's Senior Analyst.
(I do not have a discord and will not contact you first there. Beware of scammers)
READ FULL BIO
Sponsored
Sponsored