

On May 21, Bitcoin (BTC), Litecoin (LTC), and Bitcoin Cash (BCH) were struggling for price gains. Furthermore, A triple top pattern has formed for BTC while LTC is exhibiting a head and shoulders pattern. Both are bearish.
While BCH is free from these bearish patterns, it has exhibited long-term bearish divergence. Thus, we believe each of these three coins may in the near future.
How low will they go? You’ll have to keep reading to find out!
A Triple Top for Bitcoin?
On May 12, the price reached a low of $6858.0. A rapid increase began and the price reached a high of $8194.1 on May 14. Similar highs were reached on May 16 and May 19.
Since then, BTC/USD has been trading inside the ascending triangle outlined in the graph below:
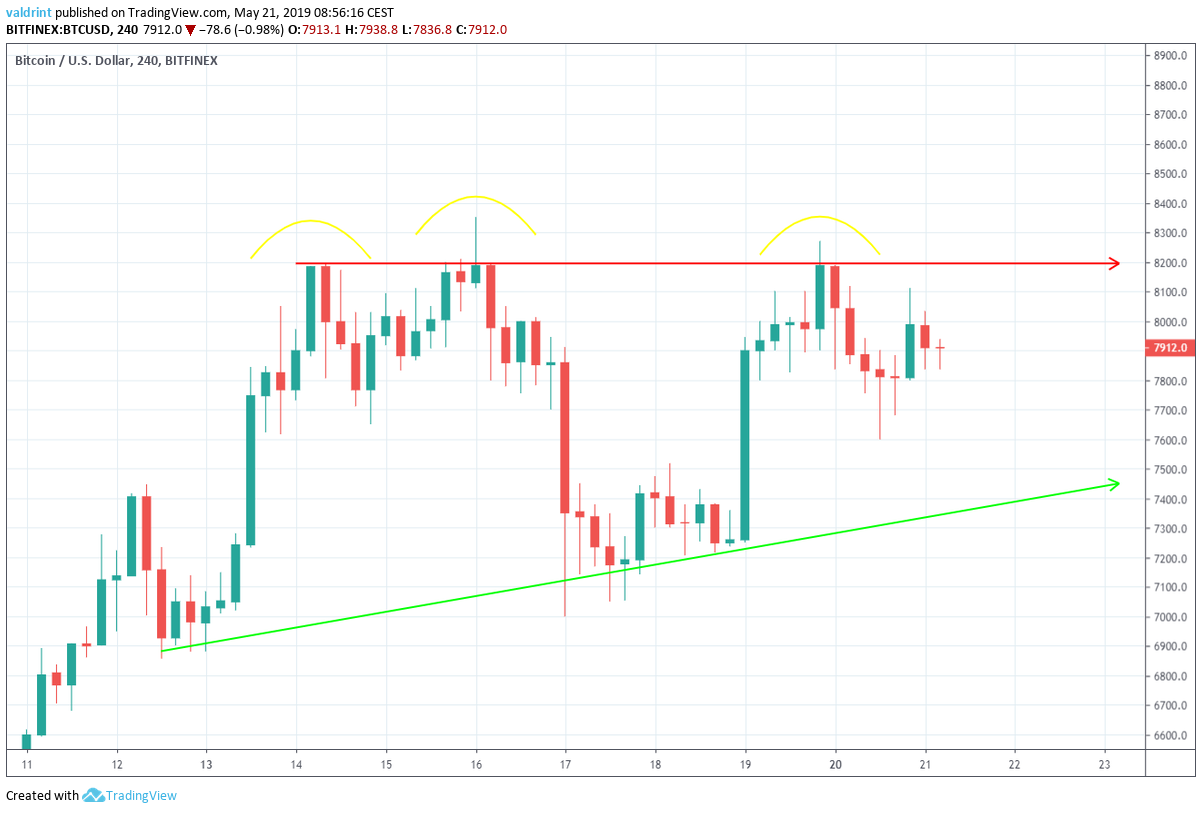
While the triangle is a bullish pattern, it is possible that the price has made a triple top—a bearish pattern. This means that we have two conflicting trends. Price may rise and breakout from the trading pattern or drop toward the support line.
We are unable to determine which is more likely based on the trends alone.
Confirming the Triple Top
Thus, the price of BTC is analyzed at four-hour intervals alongside the RSI and the MACD. We pay special attention to the possible triple top pattern we outlined above.
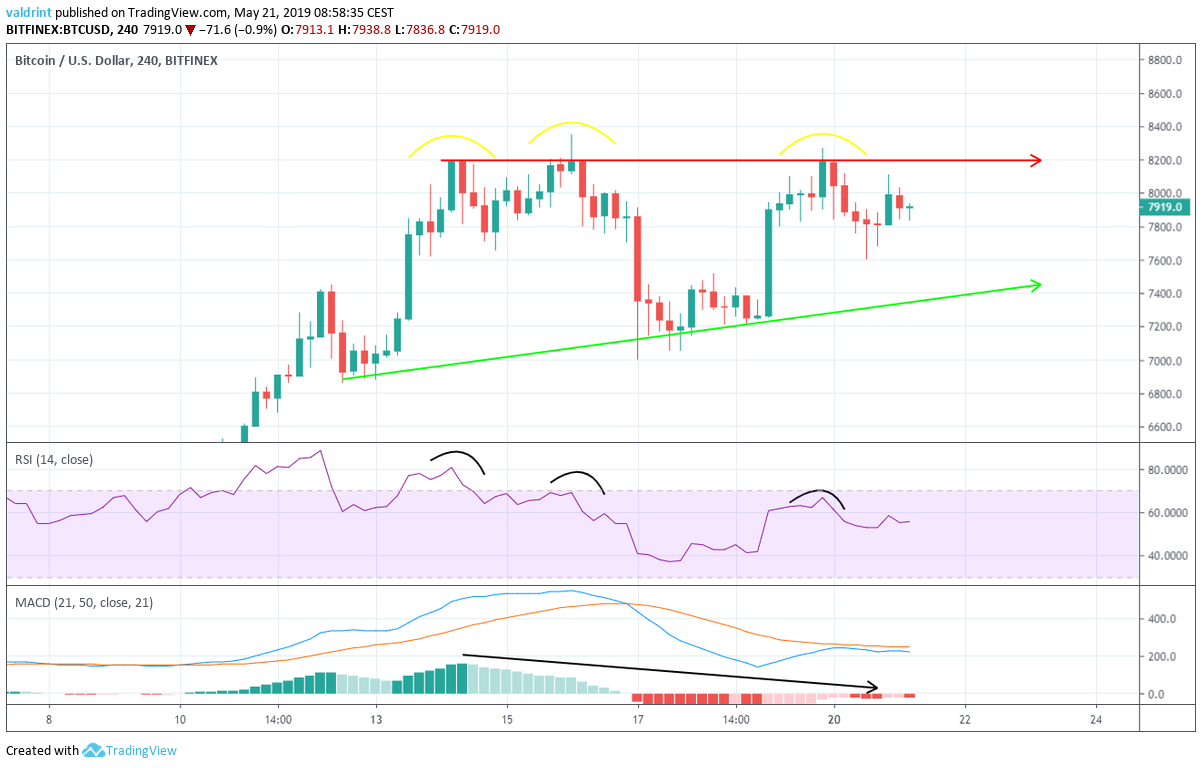
On May 14, the price reached a high of $8194.1. A rapid decrease was followed by a gradual increase. The price reached slightly higher highs of $8352.3 and $8269.2 on May 16 and 19 respectively.
Similarly, the RSI and the MACD reached the first high on May 14. However, they have proceeded to generate lower values since.
Thus, bearish divergence has developed in both the RSI and MACD. Combined with the triple top pattern, these indicators suggest that BTC is poised to fall toward the support line. A breakout appears unlikely.
A Look at Litecoin
The price of LTC/USD made a low of $83.89 on May 12. A gradual increase was followed by a decrease. The price made lows of $85.0 on May 17.
Tracing these lows gives us the ascending support line outlined in the graph below:
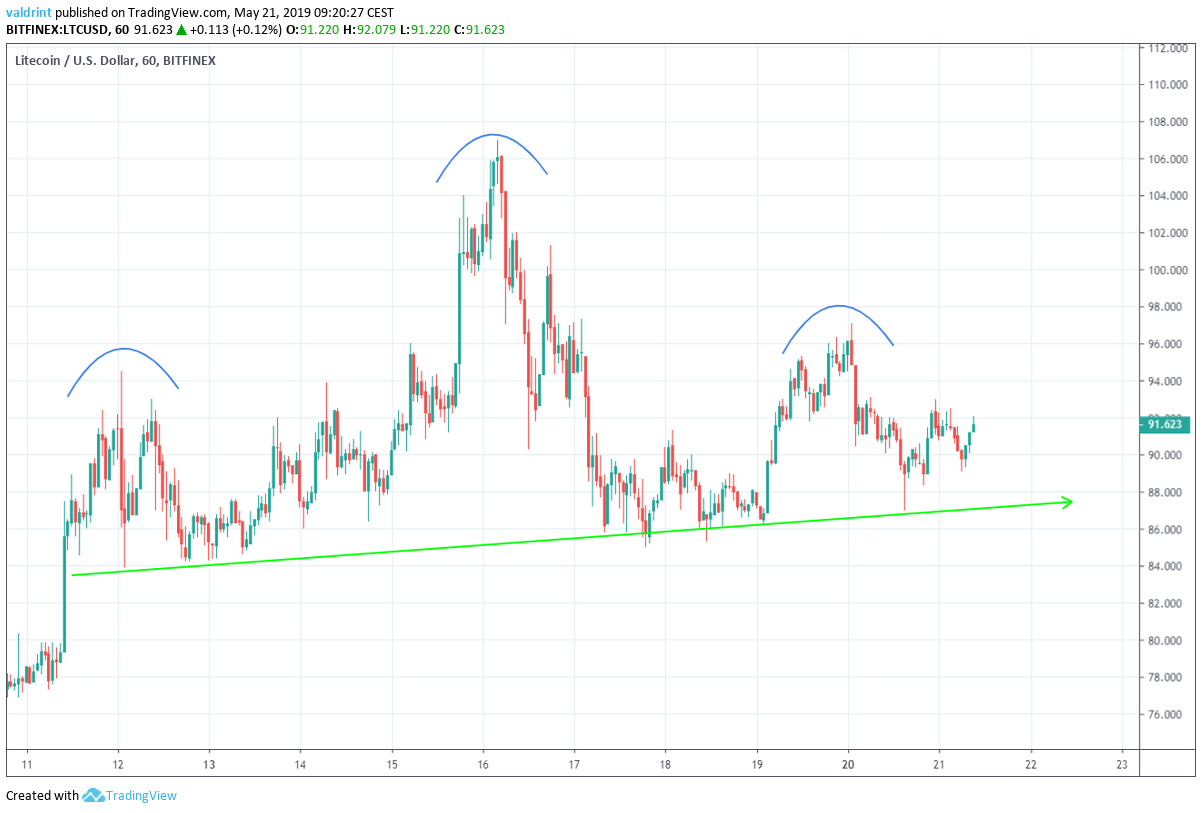
The price is not following any resistance lines. However, it a head and shoulder pattern has appeared.
While the head emerged on May 16 when a high of $108 was reached, the first shoulder emerged four days prior while the second appeared four days later. They are marked by highs near $96 on May 12 and 20. Furthermore, the ascending support line appears to be acting as a neckline.
Possible Breakdown for Litecoin?
To better determine future price fluctuations for LTC, the price is analyzed at daily intervals alongside the RSI and the MACD below: 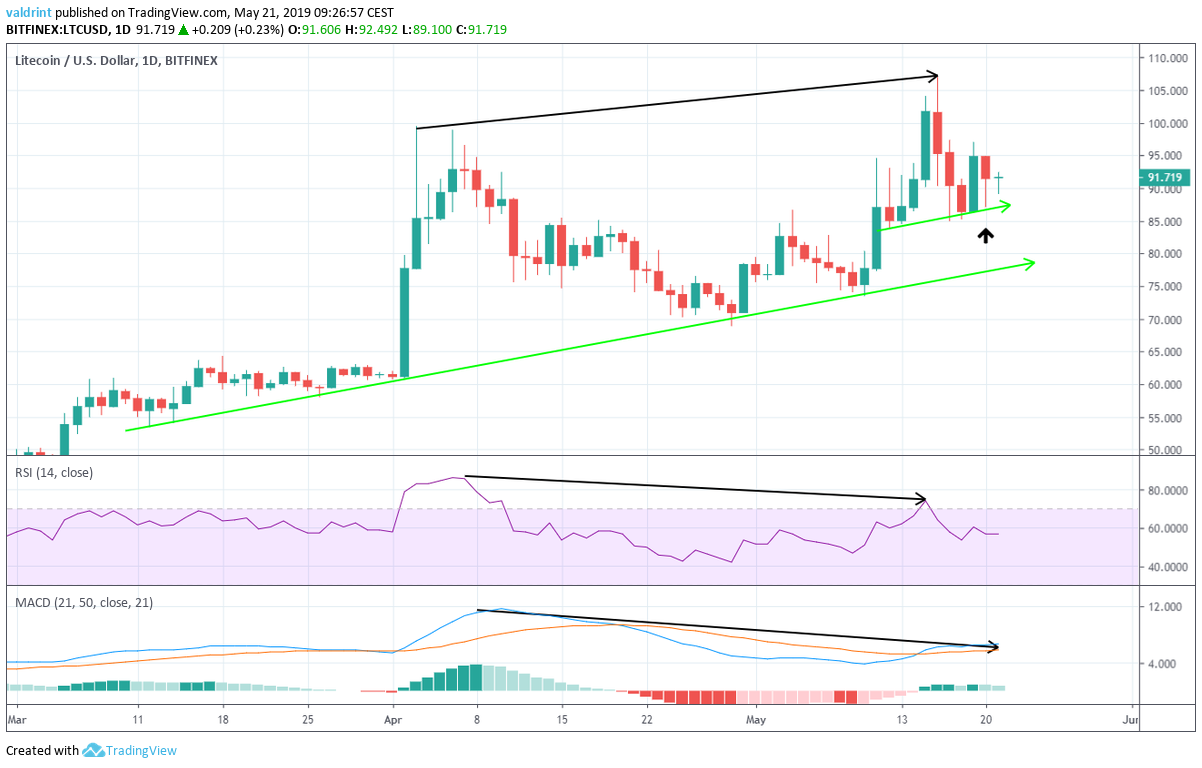 As with BTC, bearish divergence has developed in the RSI and MACD. LTC may soon face price losses.
Yesterday’s prediction remains unchanged:
“We believe that the head and shoulder pattern will be completed. We are likely to see the price breakdown from the first support line and reach the second one near $80.”
However, yesterday’s candle was a hammer. This can be a bullish signal. A close above $95 would likely initiate a short-term reversal. We do not believe this to be likely, but it is worth keeping an eye on.
Bitcoin Cash Close to Resistance
Similar to BTC, the price of BCH/USD has been trading inside a symmetrical triangle. The price made a low of $330.0 on May 12. An increase took it to $452.91 on May 16.
Price movements are outlined in the graph below:
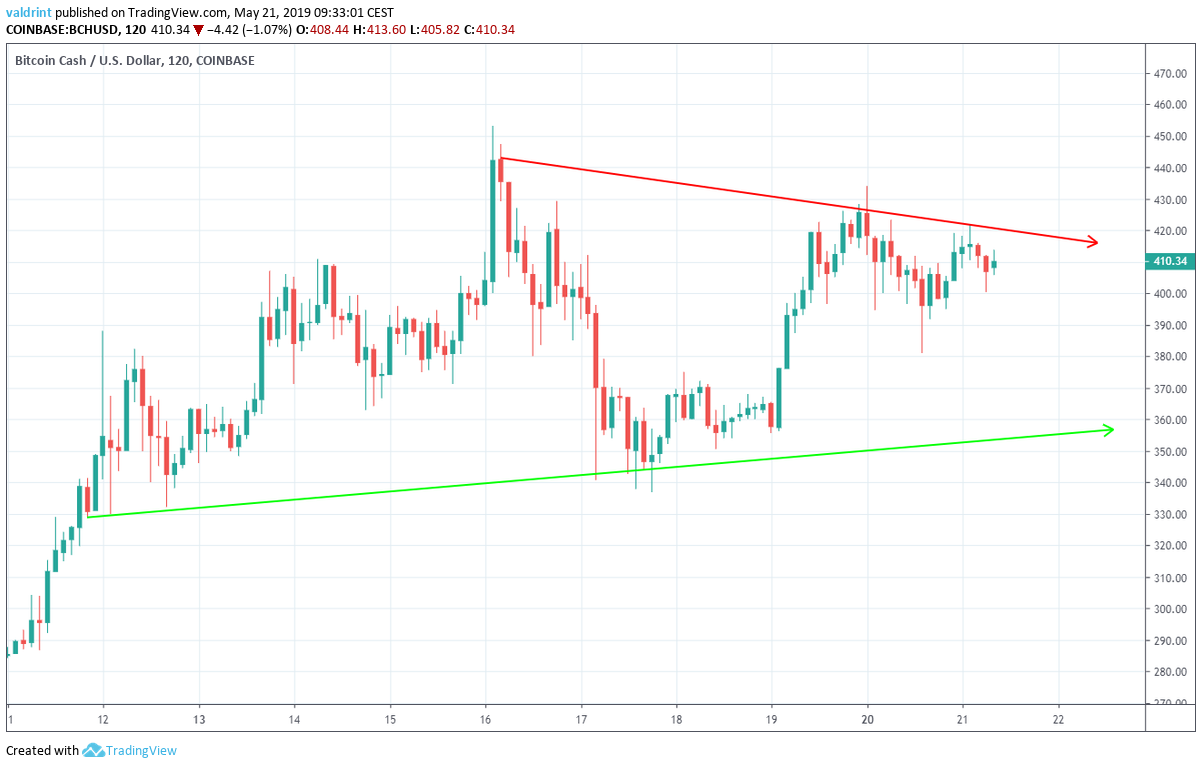
On May 20 and 21, BCH validated the resistance line but was unable to break out. At the time of writing, it is trading near $410, slightly below the resistance line.
Currently, BCH appears poised to fall toward the support line of the channel. Nonetheless, a breakout remains possible.
Close To Reaching a Top?
To better assess the possibility of a breakout, the price of BCH is analyzed at daily intervals alongside the RSI and the MACD below:  BCH has been trading inside a long-term ascending broadening wedge, which is a bearish pattern. In addition, BCH has developed bearish divergence in the RSI and MACD like BTC and LTC.
BTC and LTC, however, are experiencing divergence only in the short-term. BCH, on the other hand, is experiencing bullish divergence within a longer timeframe.
It appears that BCH will drop towards the support line of the wedge. A breakdown is possible but not yet certain.
Conclusion
To conclude, BTC and LTC have generated a distinct bearish pattern. Where BTC has generated a triple top, LTC has formed its own head and shoulders. Neither of these has emerged for BCH.
Additionally, all three have created bearish divergence in the RSI and the MACD. For BTC and LTC, this appeared in the short term while BCH’s divergence appeared in a longer time frame.
Thus, price losses are likely forthcoming for each. However, due to the ambiguity of BCH’s pattern and its smaller fluctuations within the triangle, we believe it will experience lower percentile losses than Bitcoin.
A summary is presented in the table below:
| BTC | LTC | BCH |
| Ascending Triangle/ Triple Top | Head and Shoulders Pattern | Symmetrical Triangle |
| Bearish Divergence RSI & MACD | Bearish Divergence RSI & MACD | Long-Term Bearish Divergence RSI & MACD |
Do you think the BTC and LTC will complete their bearish patterns? Will BCH drop towards the support line of the channel? Let us know in the comments below.
Disclaimer: This article is not trading advice and should not be construed as such. Always consult a trained financial professional before investing in cryptocurrencies, as the market is particularly volatile.
Trusted
Disclaimer
In line with the Trust Project guidelines, this price analysis article is for informational purposes only and should not be considered financial or investment advice. BeInCrypto is committed to accurate, unbiased reporting, but market conditions are subject to change without notice. Always conduct your own research and consult with a professional before making any financial decisions. Please note that our Terms and Conditions, Privacy Policy, and Disclaimers have been updated.
