

In the early hours of April 16, the Bitcoin price had decreased considerably, reaching a low of $6,486. However, a very rapid upward move followed afterwards, taking the price to $7,161 within the day.
The daily candlestick has yet to close, and at the time of writing BTC was trading at $7,002. In order to explain this movement, well-known trader @CryptoCapo_ outlined a fractal comparing the recent increase to the one that transpired in March and May. The chart suggests that the price will soon reach a new high and begin a sharp sell off afterward.
Below, we will take a closer look at both structures in order to see if more similarities arise.''Hey but you are comparing 1D vs 1H timeframe''
— il Capo Of Crypto (@CryptoCapo_) April 16, 2020
If structure is the same, result should be the same. You use EMA crosses for direction, I use fractals. pic.twitter.com/EiiIABAp78
Previous Movement
The original movement began on June 26, when the price reached a high of $13,764. Afterward, it began a gradual descent, trading inside a symmetrical triangle, validating its support line thrice (blue arrows). After breaking down, the price completed a distinct pattern; it made two lower lows, initiated an upward move, made two more lower lows and initiated another upward move. The highs of these moves were very similar (rectangle). What followed was a very sharp price decrease that led to the March 13 low of $3,875.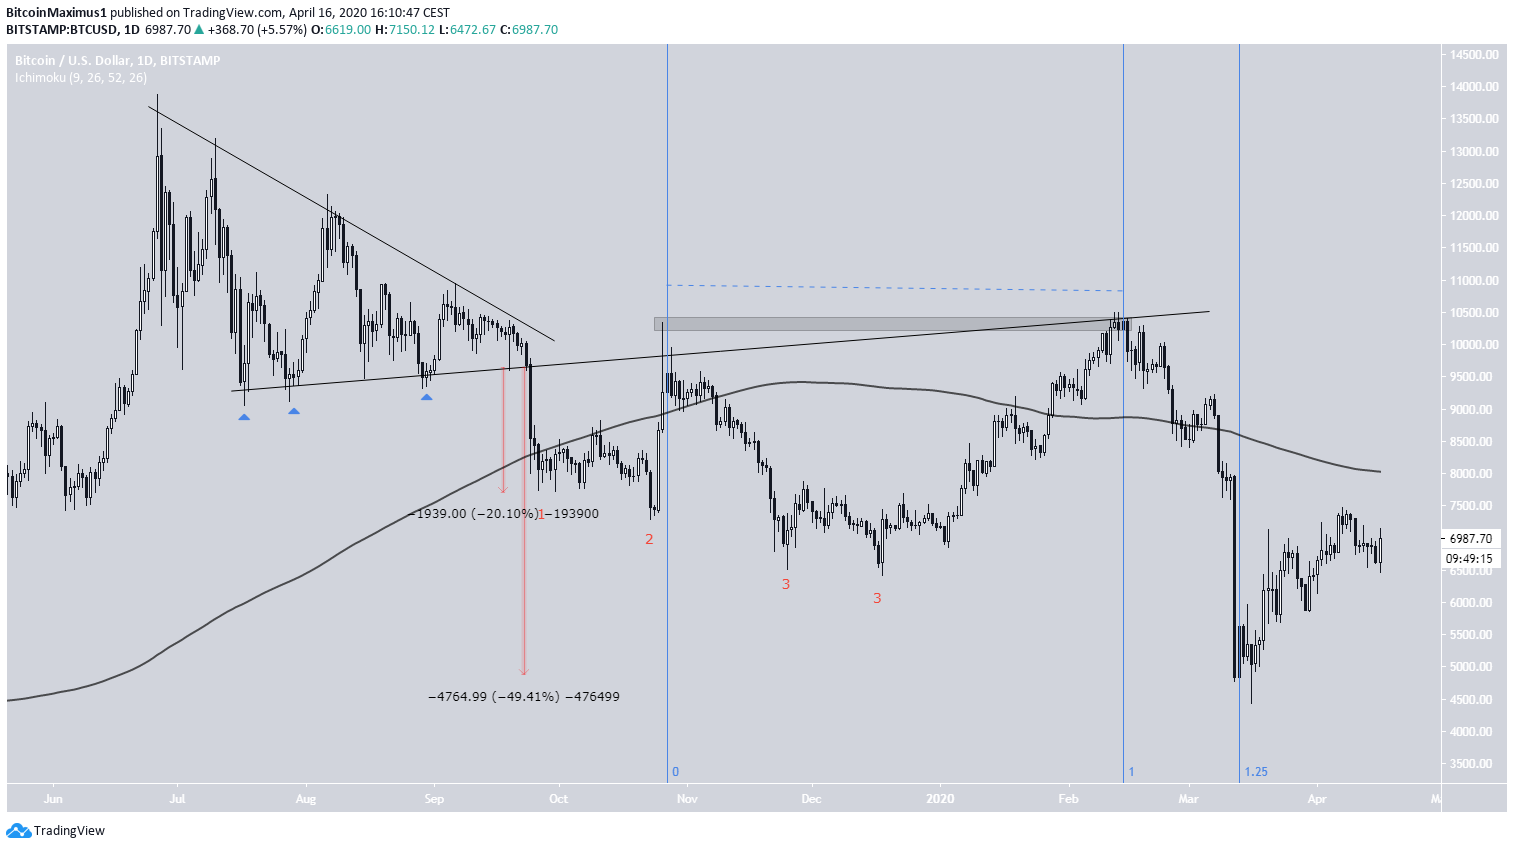 Other interesting characteristics of this move were that:
- The highs after the breakdown were above the 200-period moving average (MA), while the rest of the price movement was below.
- The magnitude of decrease from the breakdown to the first lows was 20%, while that to the final one was 50%.
- The drop after the second high was sharp, being only a quarter of the time between the two highs.
Current Movement
The current movement is much shorter and uses the hourly time-frame instead of the daily one. After the price reached a high of $7,454 on April 7, it began to decrease inside a symmetrical triangle. After validating the support line twice (blue arrows), the price broke down from the pattern. It created two successive lower lows, initiated an upward move, created two more lower lows and has begun another upward move. At the time of writing, the high was almost identical to the first one (rectangle). Furthermore, both highs were above the 200-period moving average (MA), which was also the case in the previous movement. Therefore, until now, the movements have been almost identical, with the lone exceptions being that in the second movement, the support line prior to the breakdown was only validated twice and the second high took the form of the wick instead of the first one.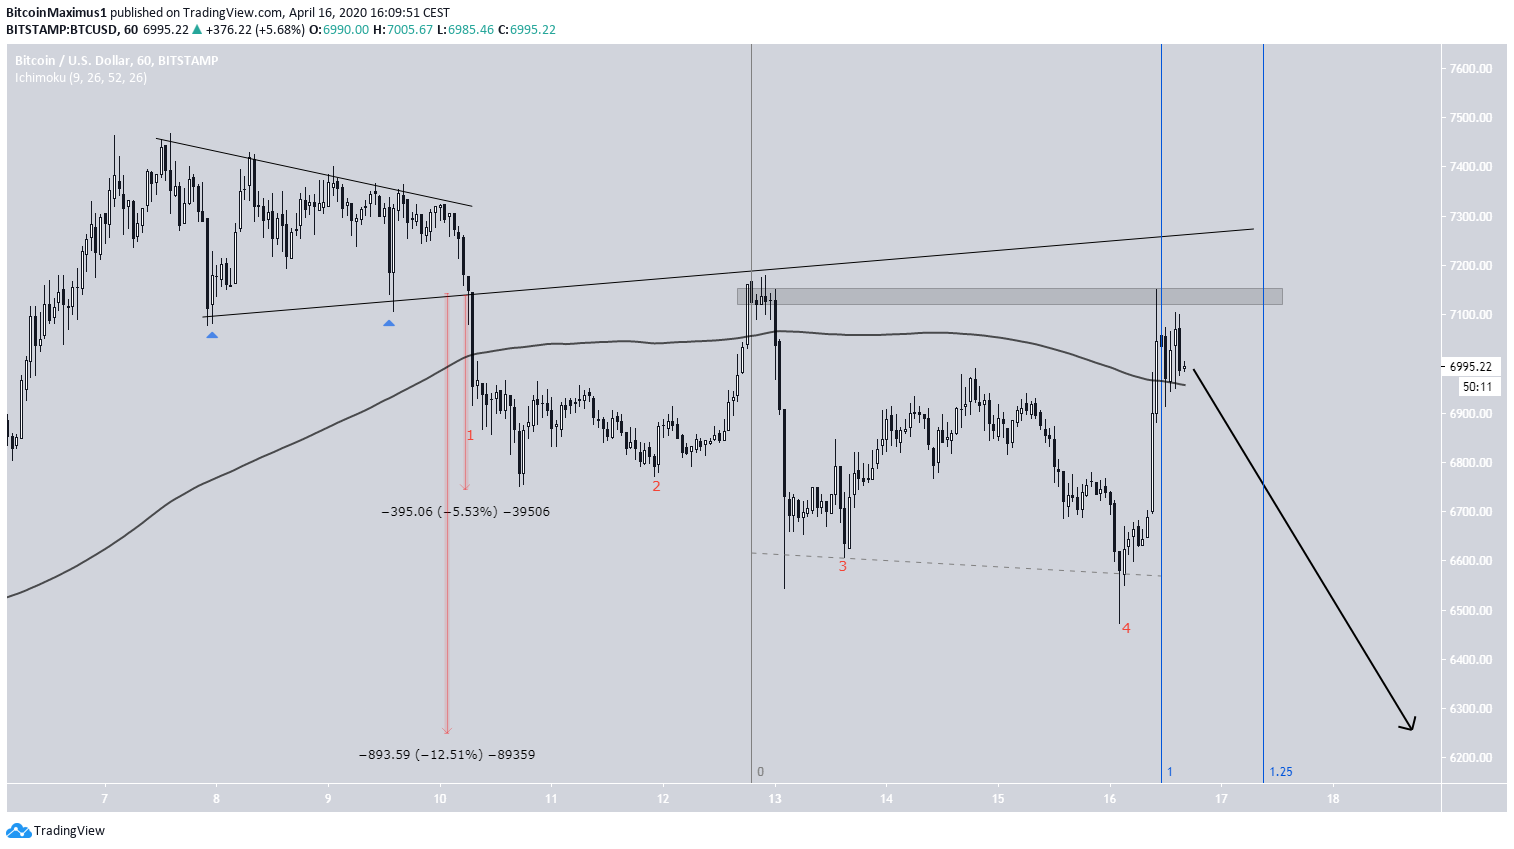 If the magnitude ratio between the first low after the breakdown and the final one remains the same, BTC will reach a low of $6,250. In addition, if the ratio of time between the drop after the second highs and the two highs remains the same, it will reach the low on April 17.
Conclusion
Even though they are transpiring in entirely different time-frames, the two movements indeed have many similarities, most interestingly the relationship of the highs with the 200-period moving average and the similarly sharp upward reactionary moves after failed breakdowns. It is not unthinkable that the price will act in a similar manner now, initiating a sharp drop. The target is also similar to what we predicted when analyzing the Bitcoin price using a different method.
Top crypto projects in the US | April 2024
Trusted
Disclaimer
In line with the Trust Project guidelines, this price analysis article is for informational purposes only and should not be considered financial or investment advice. BeInCrypto is committed to accurate, unbiased reporting, but market conditions are subject to change without notice. Always conduct your own research and consult with a professional before making any financial decisions. Please note that our Terms and Conditions, Privacy Policy, and Disclaimers have been updated.

Valdrin Tahiri
Valdrin discovered cryptocurrencies while he was getting his MSc in Financial Markets from the Barcelona School of Economics. Shortly after graduating, he began writing for several different cryptocurrency related websites as a freelancer before eventually taking on the role of BeInCrypto's Senior Analyst.
(I do not have a discord and will not contact you first there. Beware of scammers)
READ FULL BIO
Sponsored
Sponsored