

The Bitcoin Dominance Rate (BTCD) is expected to break out from a bullish pattern. However, the long-term trend remains bearish.
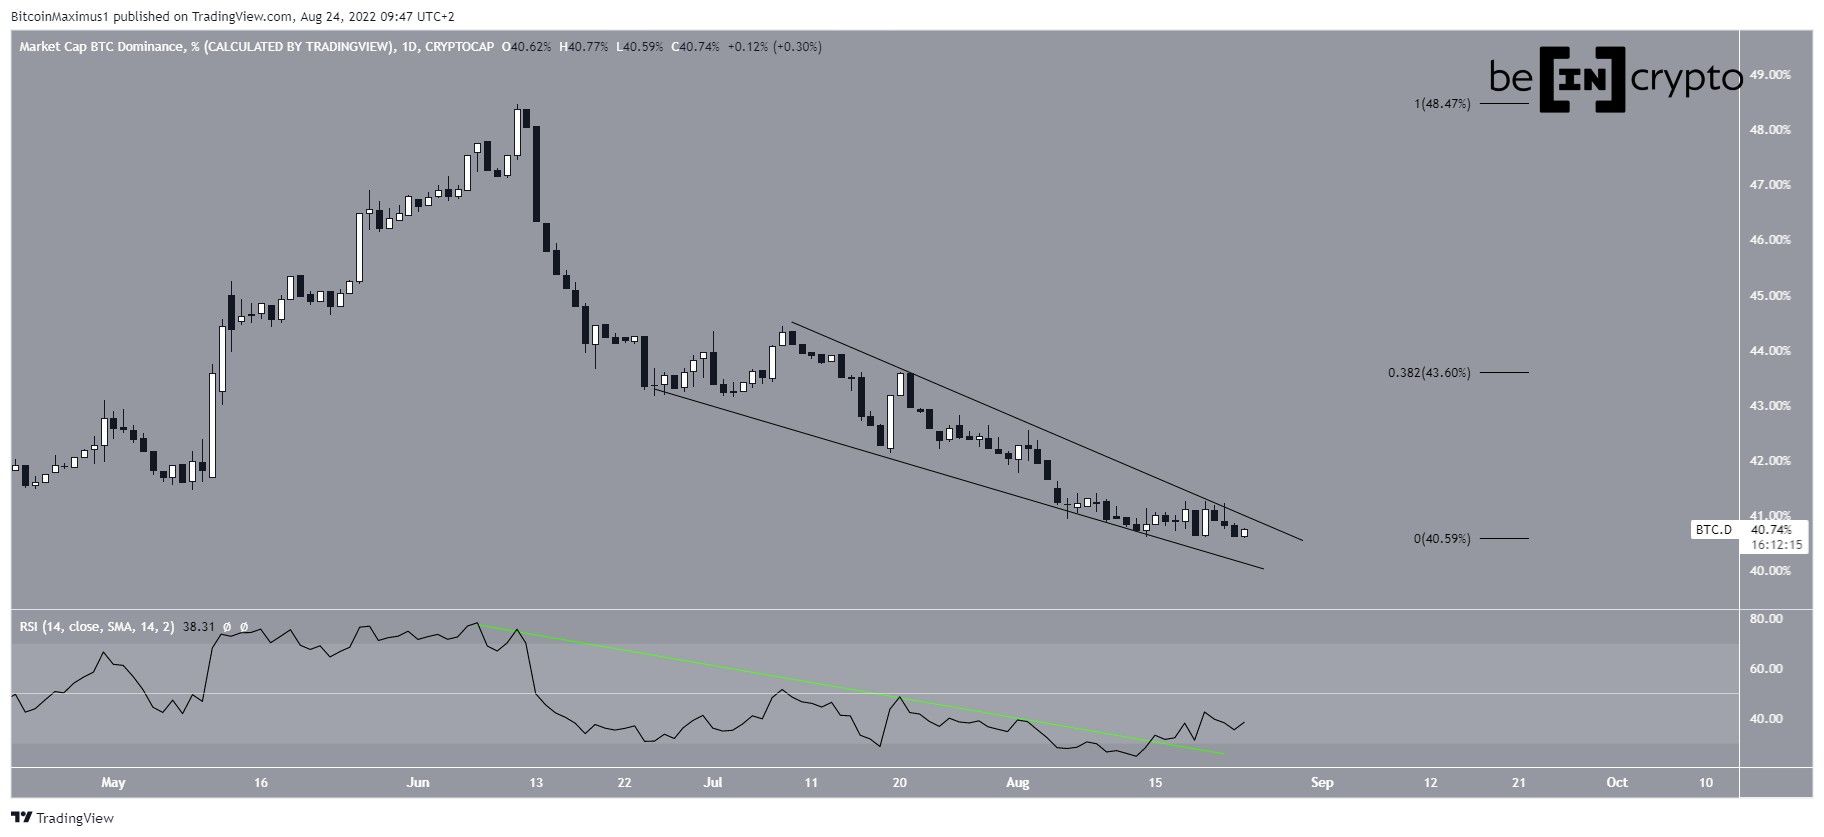
BTCD has been falling since reaching a high of 48.45% on June 11. The downward movement has so far led to a low of 40.60% in Aug 14.
Over the past month, the decrease has been contained inside a descending wedge, which is considered a bullish pattern. Furthermore, the daily RSI is extremely bullish. It has:
- Broken out from a descending resistance line
- Moved outside its oversold territory
- Generated bullish divergence
If a breakout transpires, the 0.382 Fib retracement resistance level at 43.60% would be the first resistance area.
Cryptocurrency trader @eliz883 tweeted a chart of BTCD, showing that it is following a descending support line.
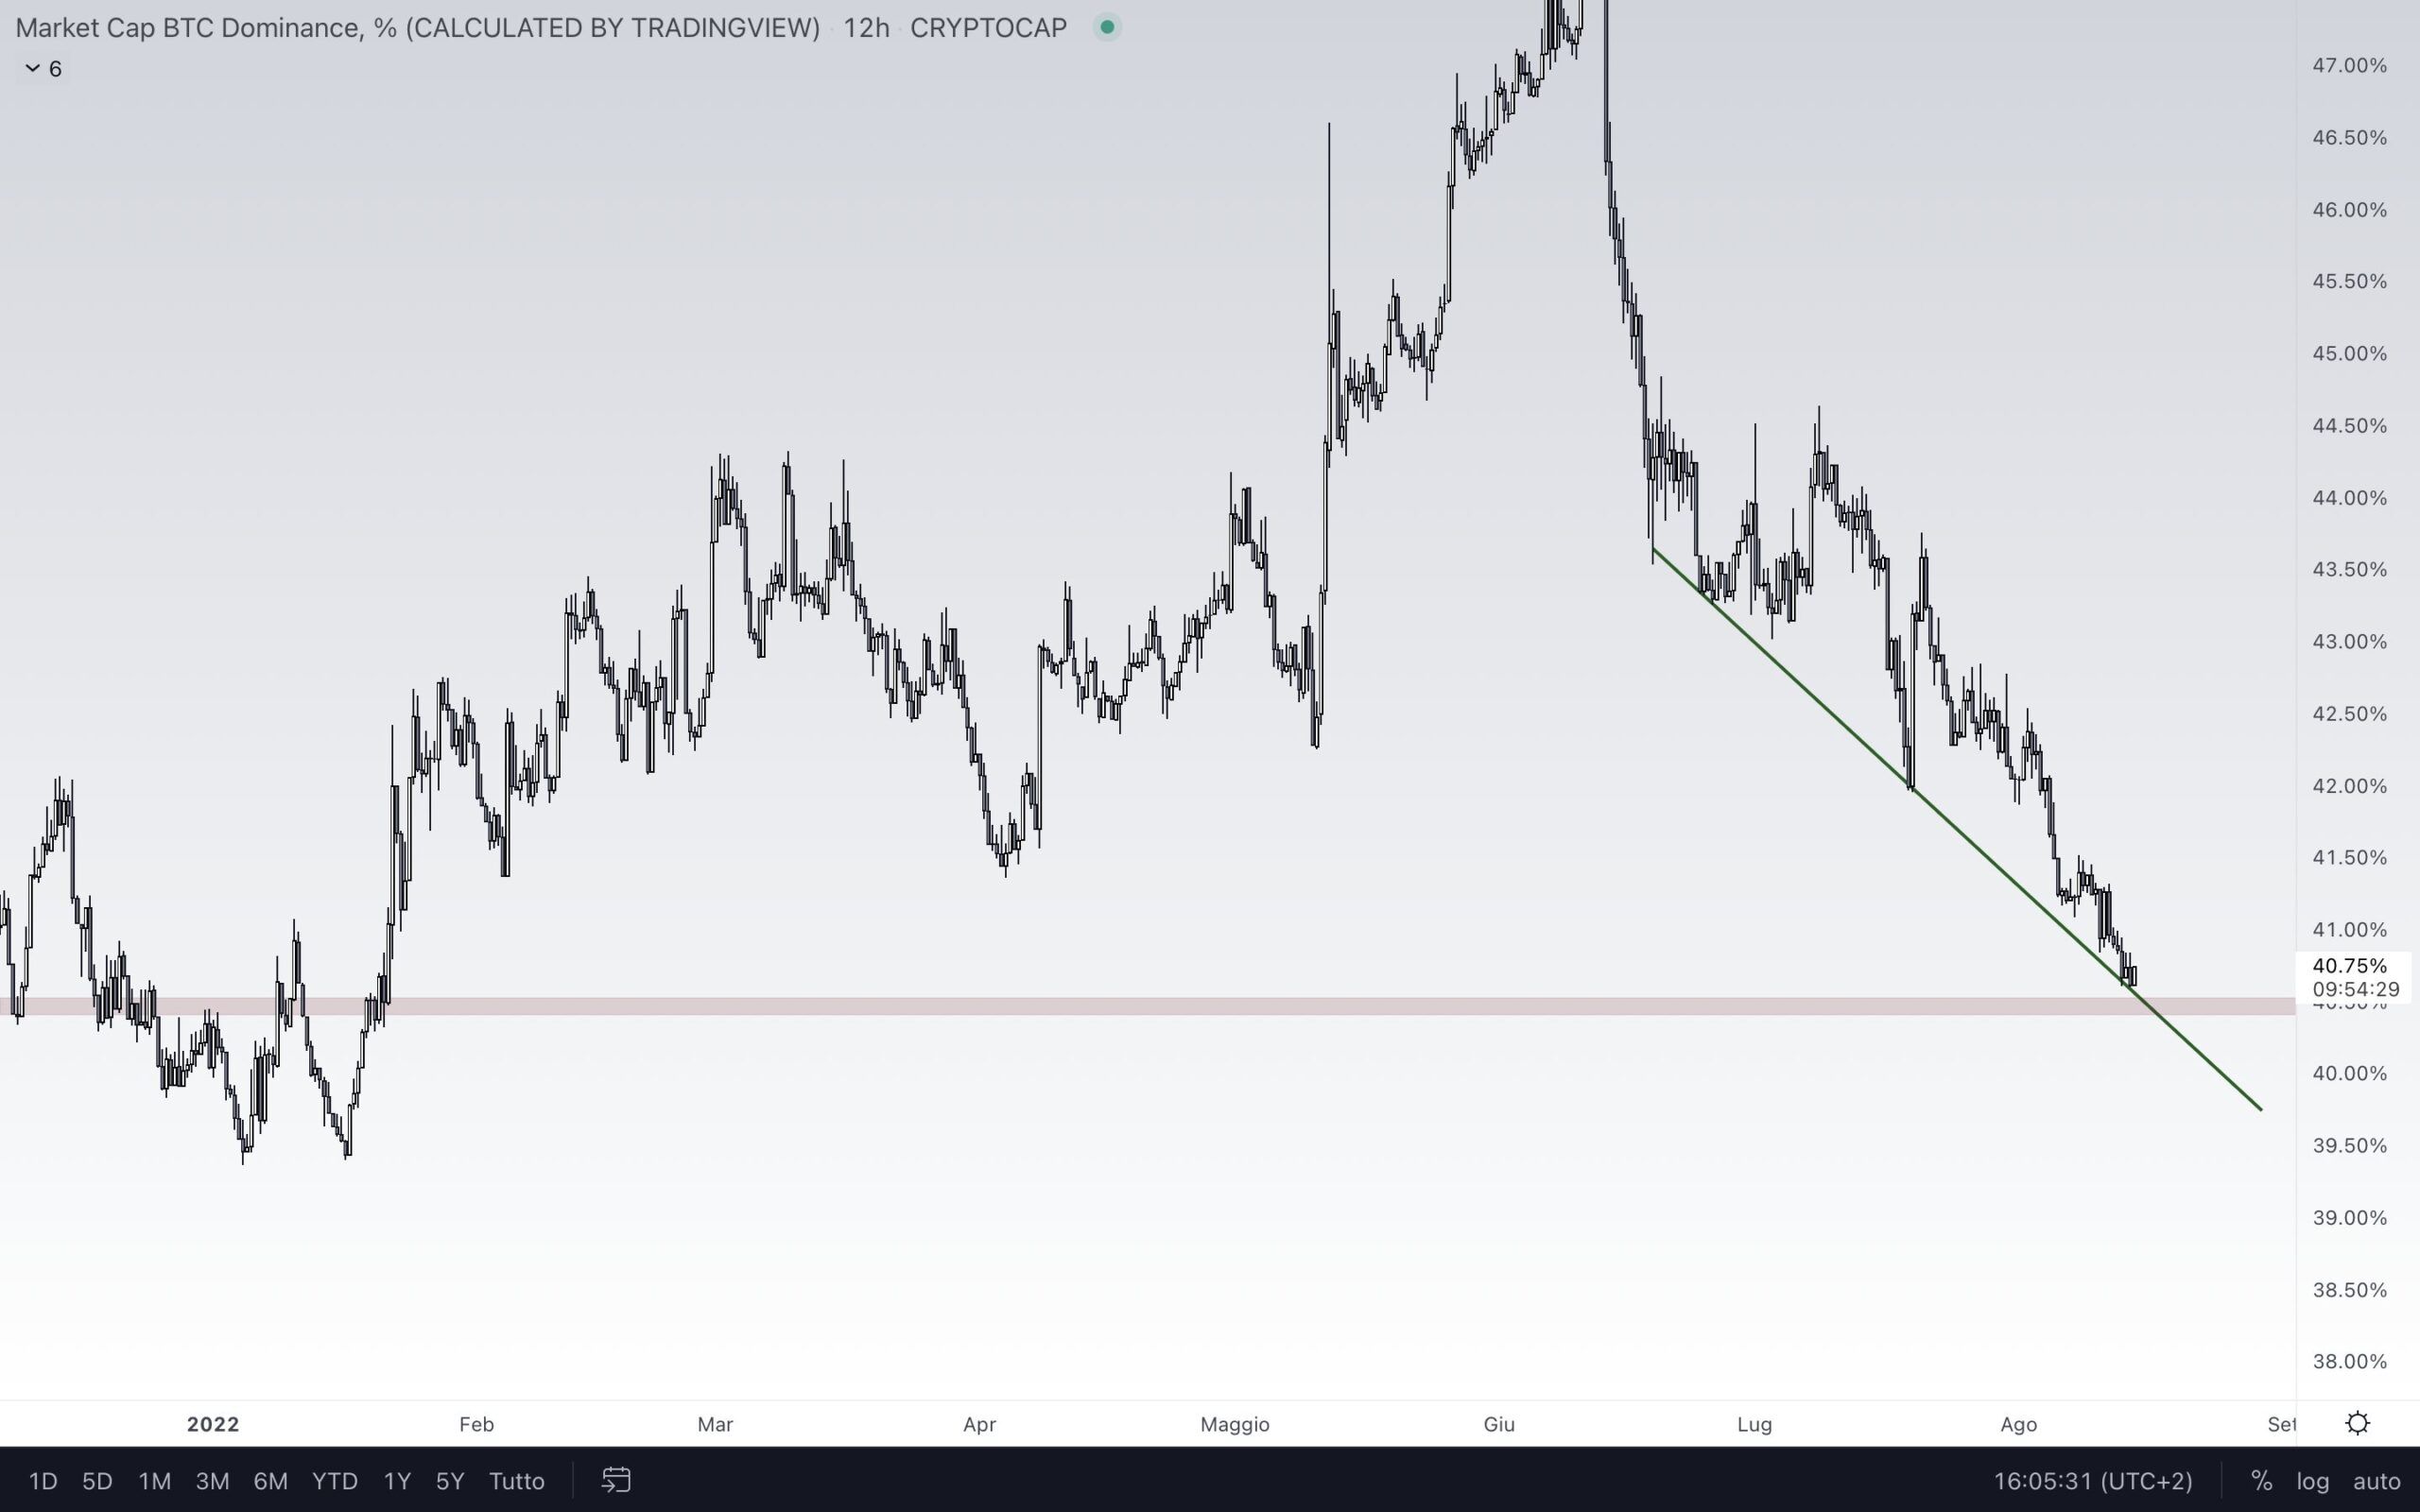
Due to the bullish RSI readings and creation of the aforementioned wedge, a breakout from this pattern would be the most likely scenario.
Long-term movement
Despite the bullish daily readings, the weekly chart suggests that the long-term trend is still bearish. The main reason for this is the weekly RSI breakdown (green line) and decrease below 50. Both of these signs are associated with bearish trends.
Currently, BTCD is trading just above the 40.50% horizontal support area, which has been in place since May 2021.
If a breakdown occurs, the first target would be at 34.13%, created by the 1.61 external Fib retracement of the most recent upward movement. This would take BTCD to a new all-time low.
So, the weekly and daily time frame readings are not in alignment in each other. Combining these two time frames, the most likely scenario would suggest an initial breakout, that takes BTCD towards at least 43.60%. Afterward, a fall towards new all-time lows would be expected.

For Be[in]Crypto’s latest Bitcoin (BTC) analysis, click here
Trusted
Disclaimer
In line with the Trust Project guidelines, this price analysis article is for informational purposes only and should not be considered financial or investment advice. BeInCrypto is committed to accurate, unbiased reporting, but market conditions are subject to change without notice. Always conduct your own research and consult with a professional before making any financial decisions. Please note that our Terms and Conditions, Privacy Policy, and Disclaimers have been updated.
