
The Bitcoin Dominance Rate (BTCD) has been trending upwards on an ascending support line since the beginning of June.
The failure of this line to initiate a bounce for such a prolonged period indicates that the BTCD is likely to break down from this support instead.
Ascending Support Line
The Bitcoin dominance rate has been following an ascending support line since Feb 13. At the time of writing, it was trading directly above this support line and has been doing so since the beginning of June. While the rate initially broke out from a shorter-term descending resistance line, potentially indicating the beginning of an upward trend, it was then rejected by both the 50 and 200-period moving averages (MA), which have since made a bearish cross.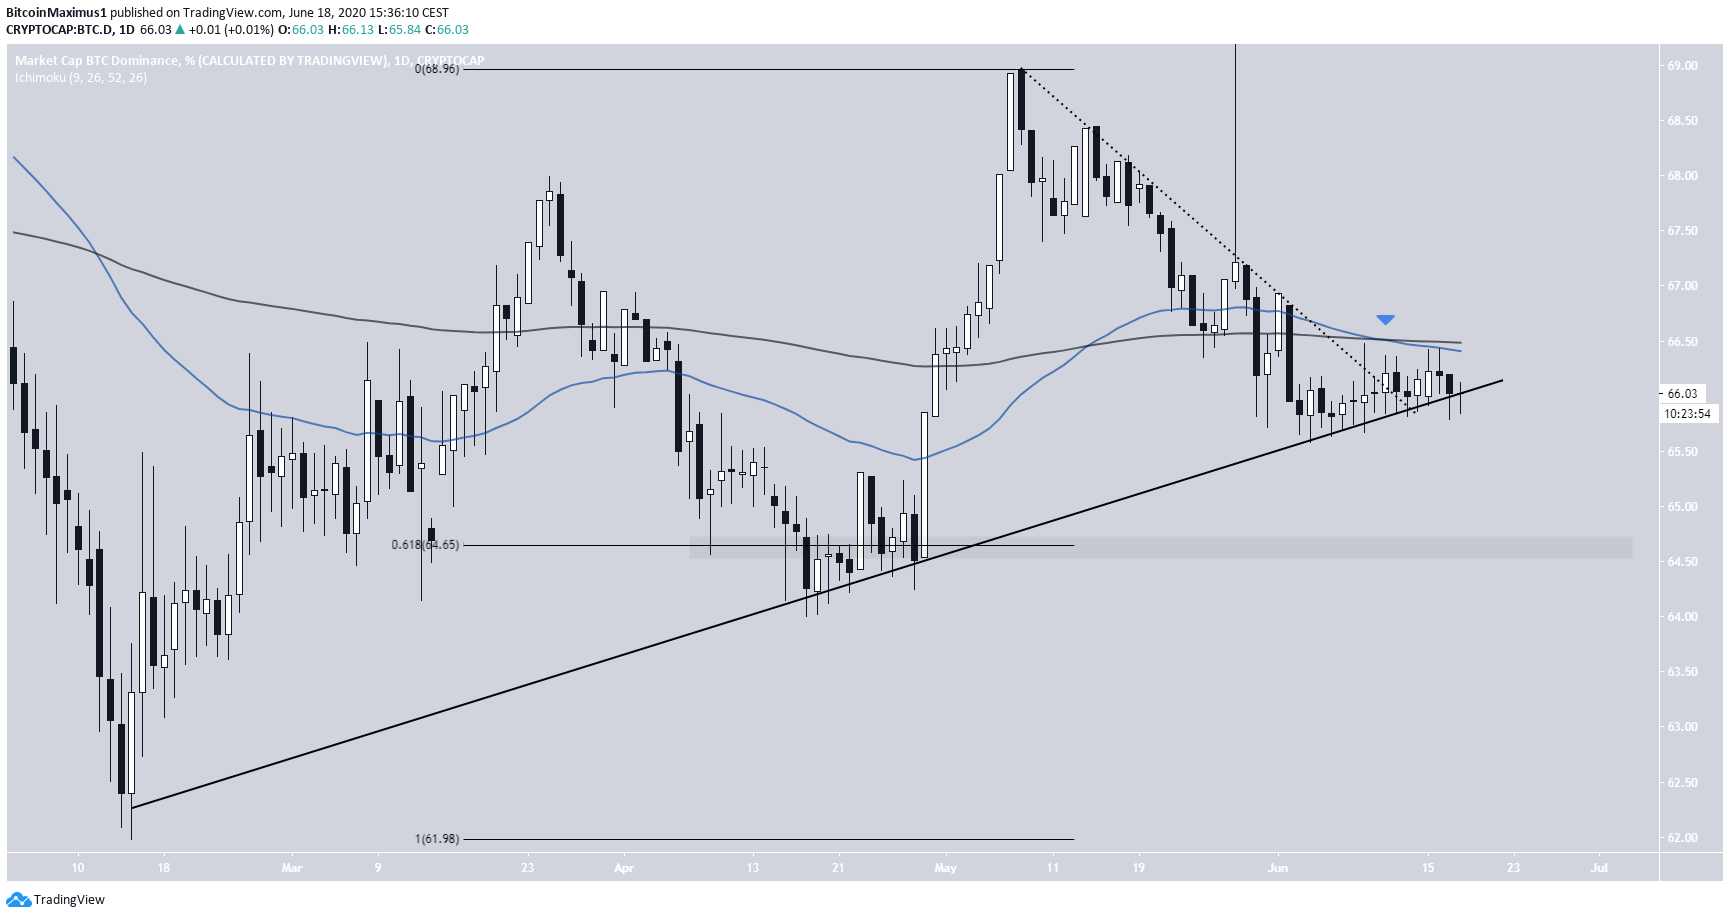
If we can just breakdown from this little range, that would be just great.
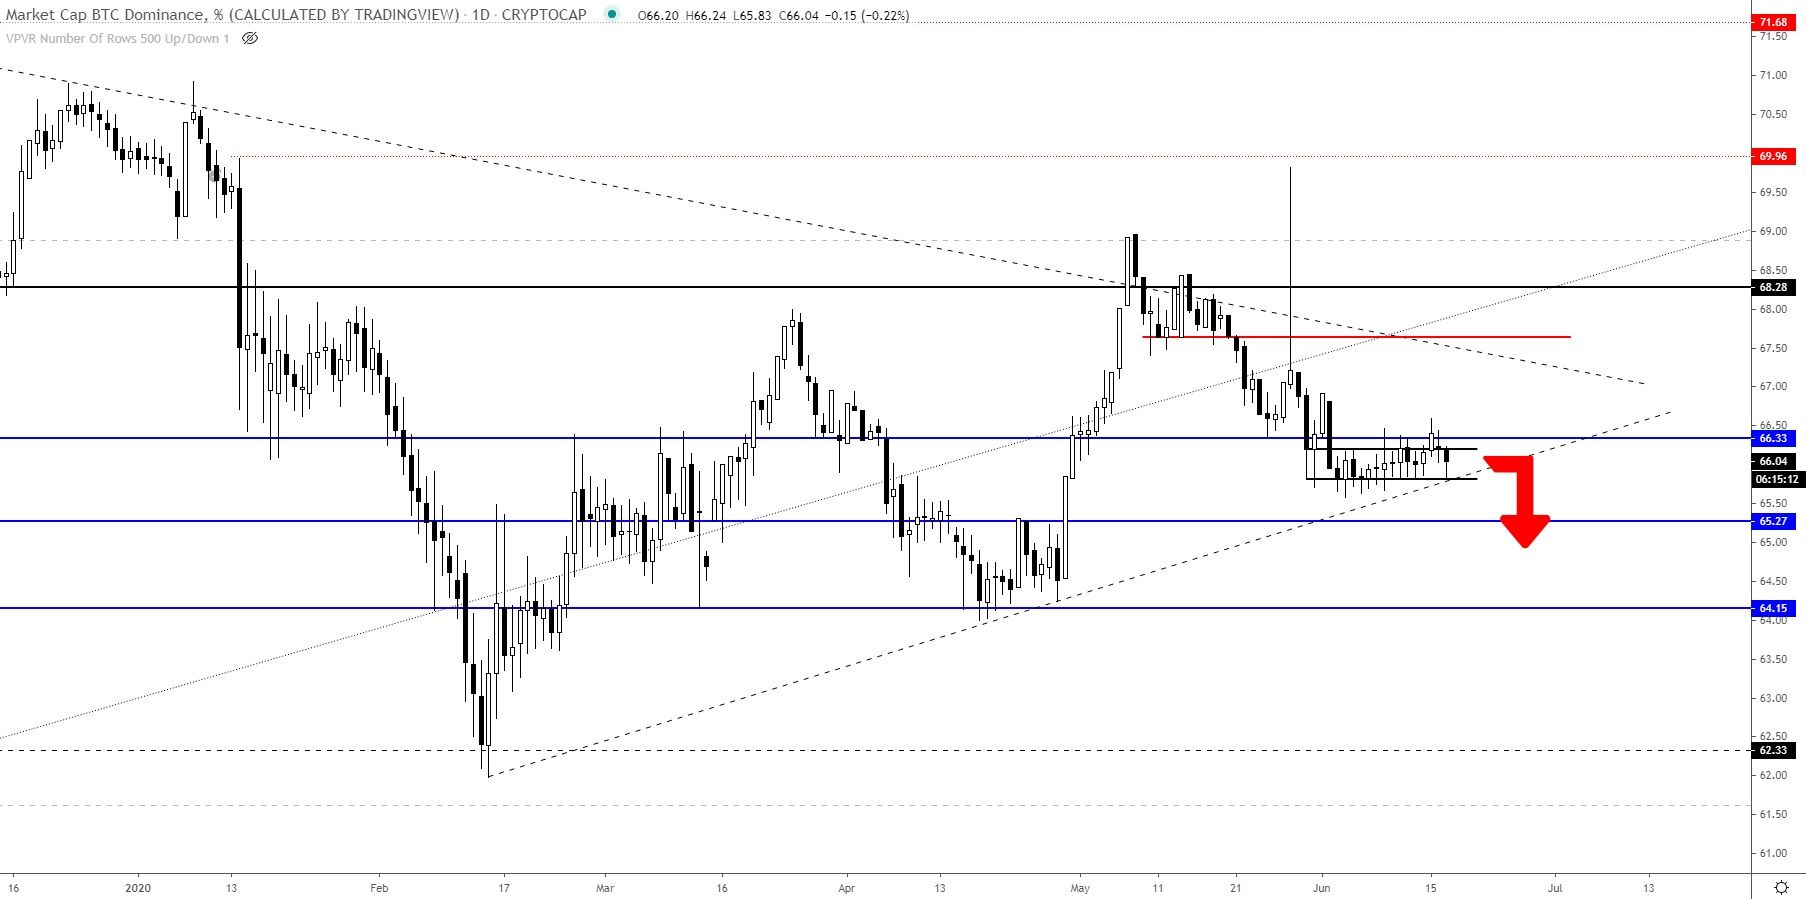
Short-Term Movement
The hourly chart does not reveal a clear trading range but shows a minor support area at 65.9%. A breakdown from it would likely accelerate the rate of decrease. Furthermore, the BTCD rate had been trading inside an ascending triangle in the period beginning on June 4. While it initially broke out, the higher prices could not be sustained, and BTCD has since fallen below the support line of this pattern. This is a bearish sign that suggests that the rate is likely to continue falling, fitting with the daily analysis.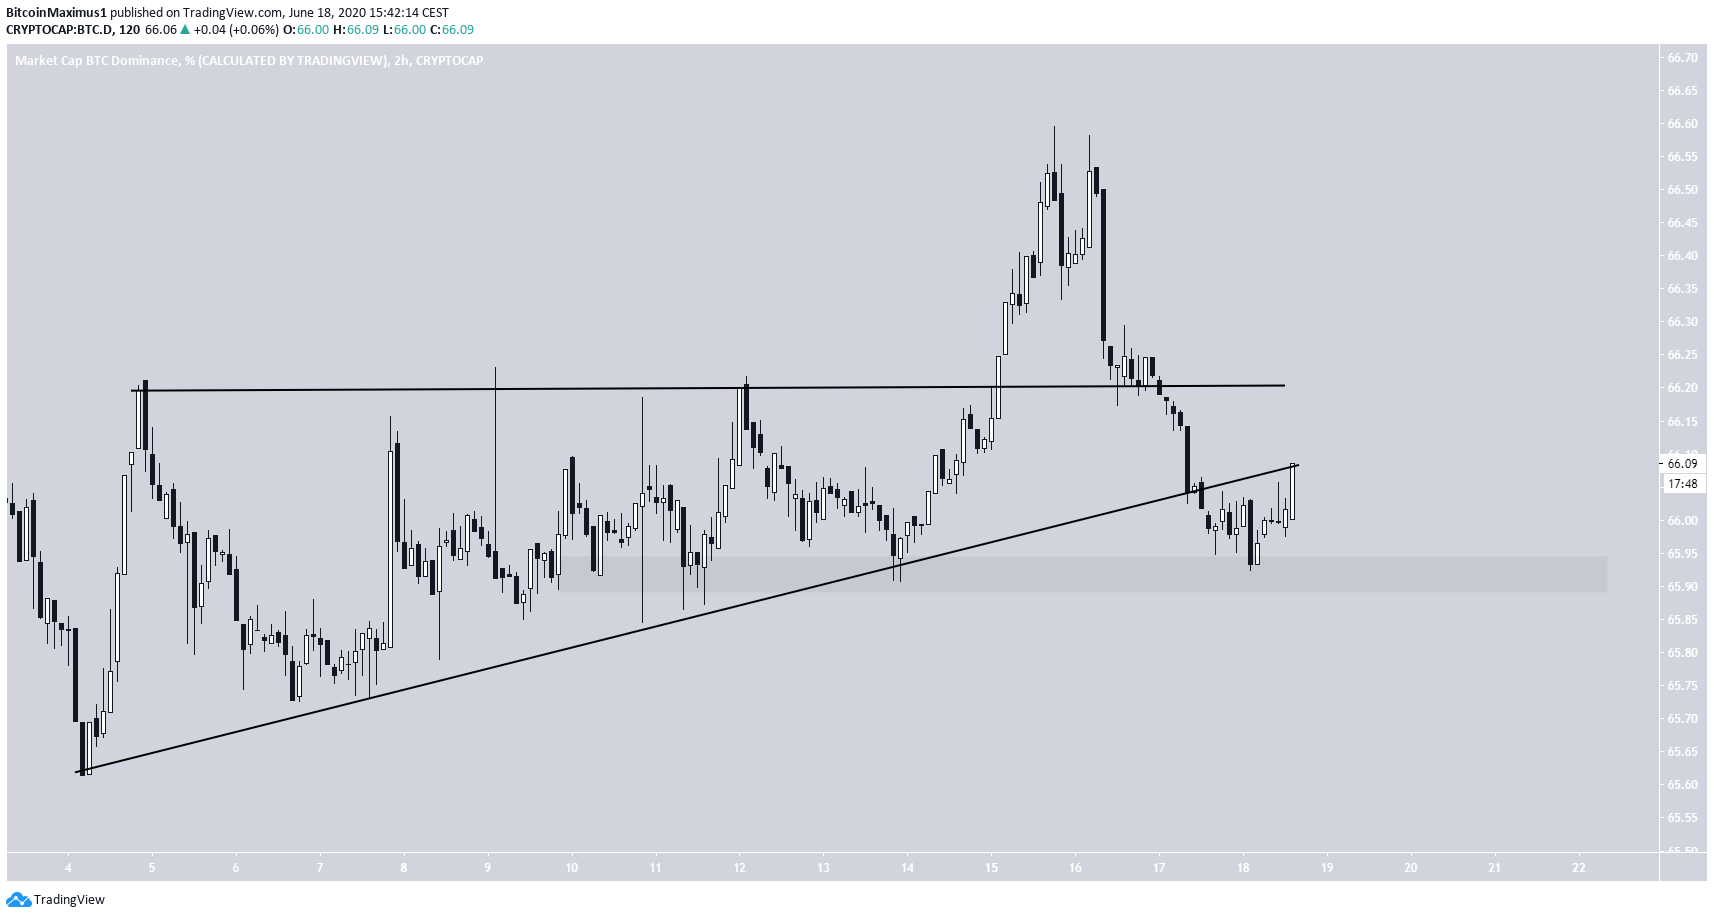
Correlation With Bitcoin
The BTCD (candlestick) and the Bitcoin price (blue) are shown in the image below. At least in the short-term, there is no clear correlation between the BTC price and the BTCD. While Bitcoin price decreases initially caused significant spikes in the BTCD, the latter has been decreasing since June 16 despite the direction of Bitcoin’s price movement.
Top crypto projects in the US | April 2024
Trusted
Disclaimer
In line with the Trust Project guidelines, this price analysis article is for informational purposes only and should not be considered financial or investment advice. BeInCrypto is committed to accurate, unbiased reporting, but market conditions are subject to change without notice. Always conduct your own research and consult with a professional before making any financial decisions. Please note that our Terms and Conditions, Privacy Policy, and Disclaimers have been updated.

Valdrin Tahiri
Valdrin discovered cryptocurrencies while he was getting his MSc in Financial Markets from the Barcelona School of Economics. Shortly after graduating, he began writing for several different cryptocurrency related websites as a freelancer before eventually taking on the role of BeInCrypto's Senior Analyst.
(I do not have a discord and will not contact you first there. Beware of scammers)
READ FULL BIO
Sponsored
Sponsored