

dominance looks to be printing a higher low/ IHS in an already monster uptrend.
— 👨🌾Benjamin Bluntz👨🌾 (@SmartContracter) January 8, 2020
Look to me like w5 is extending and dominance is going to 80%
Couple this with recent breakout in $btc and the stage is set
this is not good for your shitcoin bags, 2020 is gonna be Bitcoins year pic.twitter.com/3Nn4xoujwx
Bitcoin Dominance
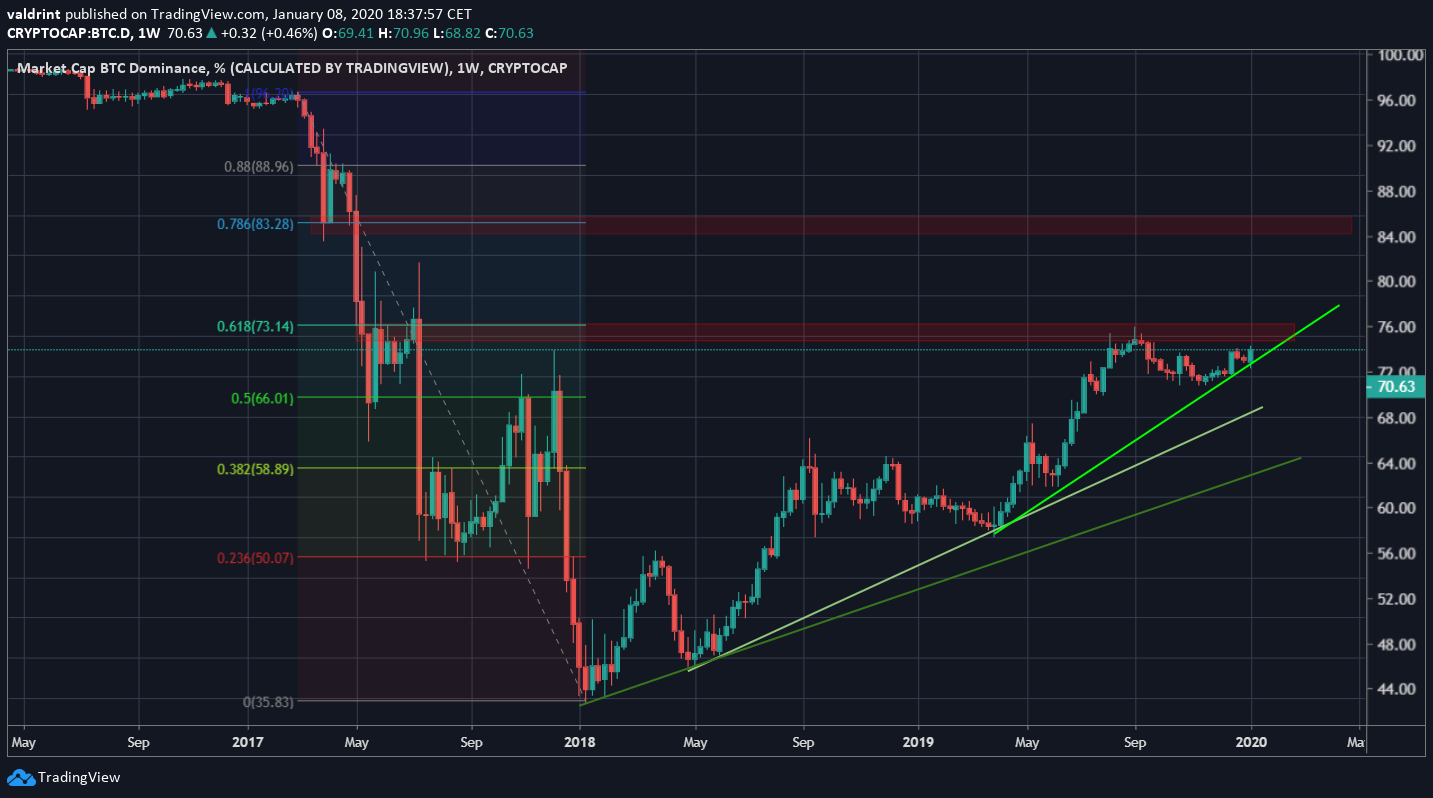
The Bitcoin dominance rate has been increasing since December 2018, when it reached an all-time low of 44%. Each time the price has made a higher-low, the rate of increase has intensified, creating a steeper ascending support line. At the time of writing, the price has just bounced on the third such ascending support line. In addition, it is very close to the 73% dominance rate, which is the 0.618 fib level of the prior decrease and a significant support area. The 80% target given in the tweet seems a conservative number, however, as the next resistance area is found at 83%, a previous support level, and the 0.786 fib level. Inverse Head And Shoulders
The inverse head and shoulders pattern has been developing since Sept 16. The creation of the right shoulder coincides with the strong bounce at the at the ascending support line.
A breakout that travels the entire height of the pattern would take the rate at nearly 75%. However, there is a bearish divergence developing in the daily RSI. Combining this with the strong resistance area all the way to 73%, it is unlikely that a breakout will be strong enough to move above this resistance area. Rather, it will probably make a double-top relative to the price on Sept 5.
 Inverse Head And Shoulders
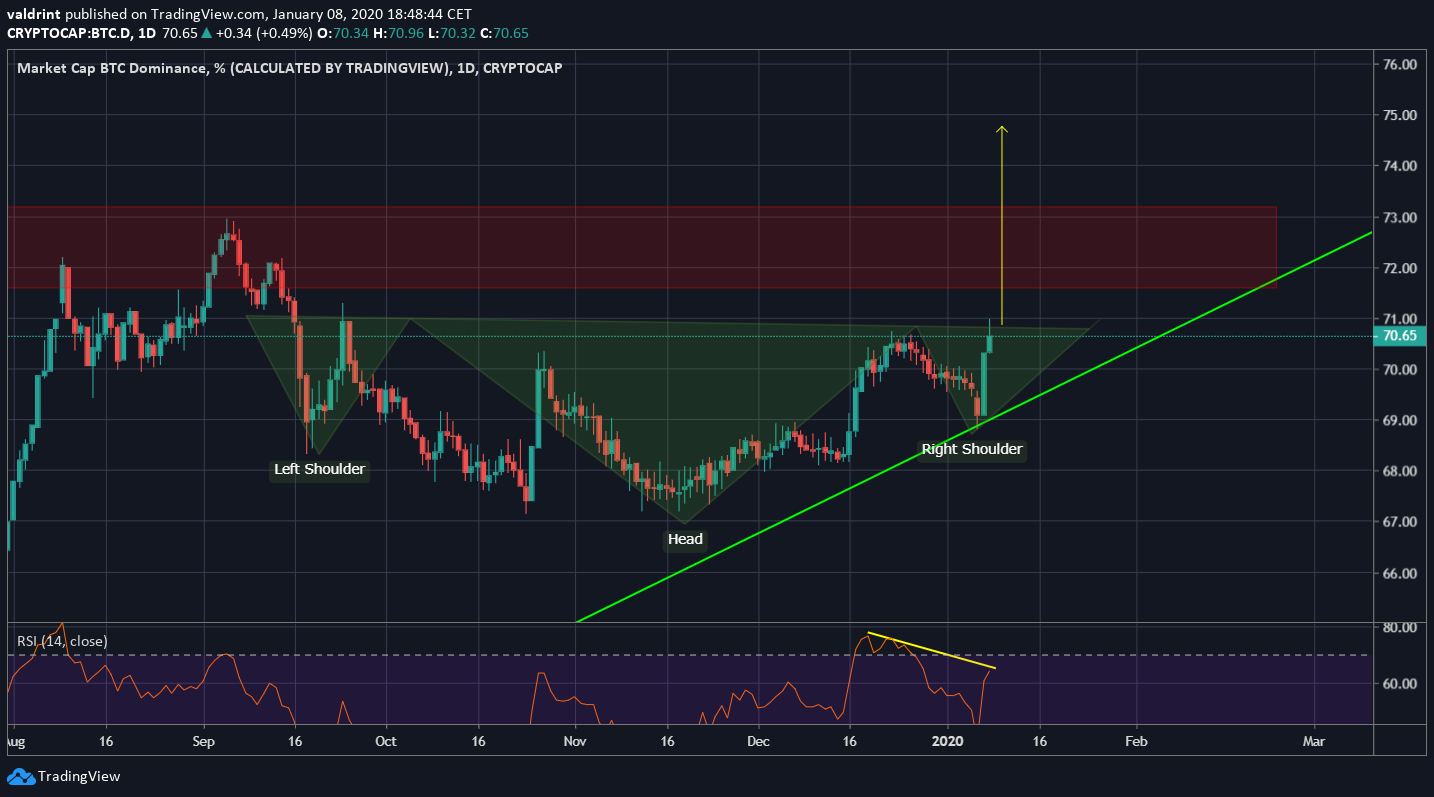
Previous Pattern
There is a separate pattern that transpired between September and December of 2018 that could be used in order to predict a breakout from the current movement. The price created a double-top at 60% combined with a bearish divergence in the weekly RSI. What followed was a five-month-long period of loss that took the rate to 52% and validated the second ascending support line. In the previous section, we discussed that it is probable for the price to create a double top at 73%. This would be a nearly identical movement to that of September/December 2018, since the weekly RSI is also generating bearish divergence. If the price follows the same pattern, it will gradually decrease towards 68% where it will validate the second ascending support line.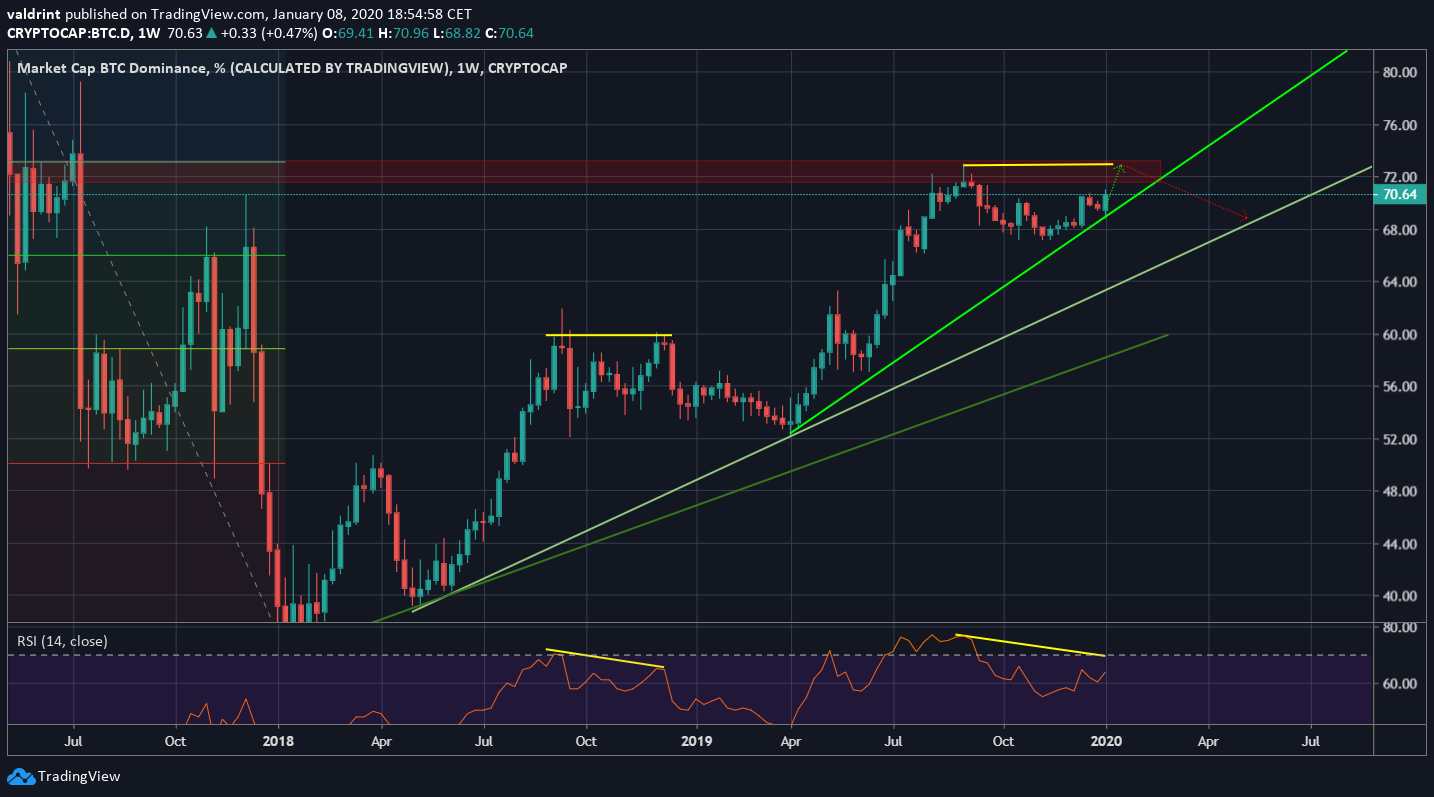 To conclude, the Bitcoin dominance rate has created a short-term bullish pattern, out of which it will most likely break out. However, it will be difficult to move above 73% and should initiate a gradual downward trend once it gets there.
 Trusted
Disclaimer
In line with the Trust Project guidelines, this price analysis article is for informational purposes only and should not be considered financial or investment advice. BeInCrypto is committed to accurate, unbiased reporting, but market conditions are subject to change without notice. Always conduct your own research and consult with a professional before making any financial decisions. Please note that our Terms and Conditions, Privacy Policy, and Disclaimers have been updated.
