Bitcoin Dominance (BTCD) bounced off a long-term support area in Sept. It has been rising ever since and is in the process of breaking through another resistance level. Will Bitcoin dominate altcoins in the coming weeks?
Many analysts expected a big altcoin season in anticipation of the Merge update on Ethereum (ETH). Indeed, Bitcoin dominance then fell to an area of support, and ETH has surged 74% against BTC since the summer lows.
However, BTCD held support, bounced, and today continues to rise, weakening altcoins in relation to BTC.
Bitcoin dominance trades in a range
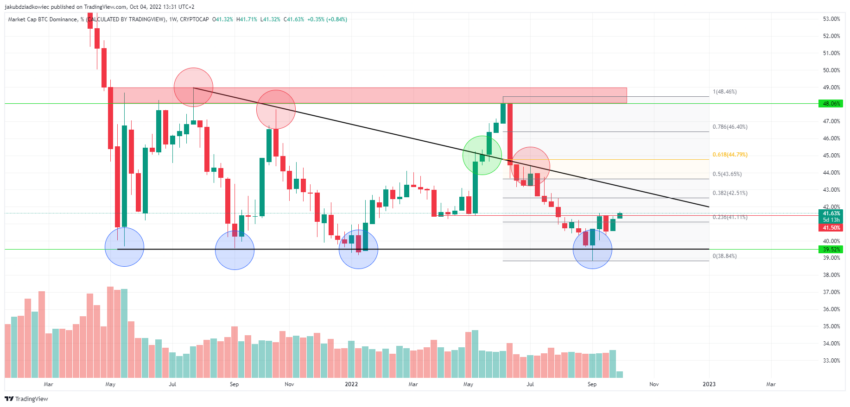
Bitcoin dominance has been moving in a 39.50%-48% range since May 2021. On the weekly chart, we can see that the 39.50% level has already been confirmed as support four times (blue circles).
Each bounce from this area has been weaker, so a descending triangle pattern has appeared on the chart.
The BTCD price has been rejected three times from the resistance level set by the descending line of this triangle (red circles).
The exception was the several-week period of May-June 2022, when declines in the cryptocurrency market led Bitcoin to strengthen against altcoins, which suffered more severely.
However, the move turned out to be a fakeout and Bitcoin dominance resumed trading in a descending triangle structure.
Currently, Bitcoin dominance is struggling to break out above the smaller resistance area at 41.50%. If successful, the first area of resistance is the 42.50%-43% range.
It is in confluence with the descending resistance line and the 0.382 Fib retracement level.

Weekly technical indicators are moderately bullish. RSI is in neutral territory near 50 and rising. MACD is close to making a bullish cross on a signal line and generating a green momentum bar.
BTCD ongoing breakout
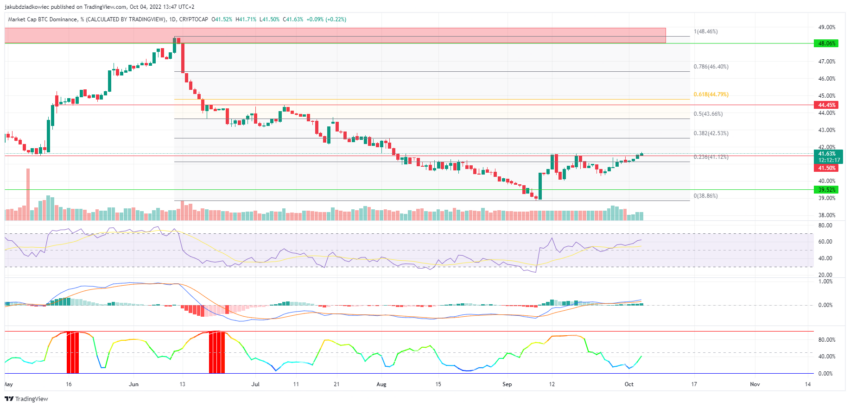
On the daily chart, we see Bitcoin dominance trying to close the daily candle above resistance at 41.50%. If successful, we should expect a rise to the second resistance area at 44.50%.
Previously, this level has repeatedly acted as resistance and support. Moreover, it is located in the golden pocket area between the 0.5 and 0.618 Fib retracements, which is the most common correction target.
Daily technical indicators support the possibility of a continuation of the upward movement. RSI is rising and is close to entering bullish territory. MACD is generating more green bars of bullish momentum.
And the Bollinger Band Width Percentile (BBWP), which measures the volatility of an asset, gives an upward signal of expansion. This further reinforces the strength of the upward movement of BTCD and the possibility of further strengthening of Bitcoin against altcoins.

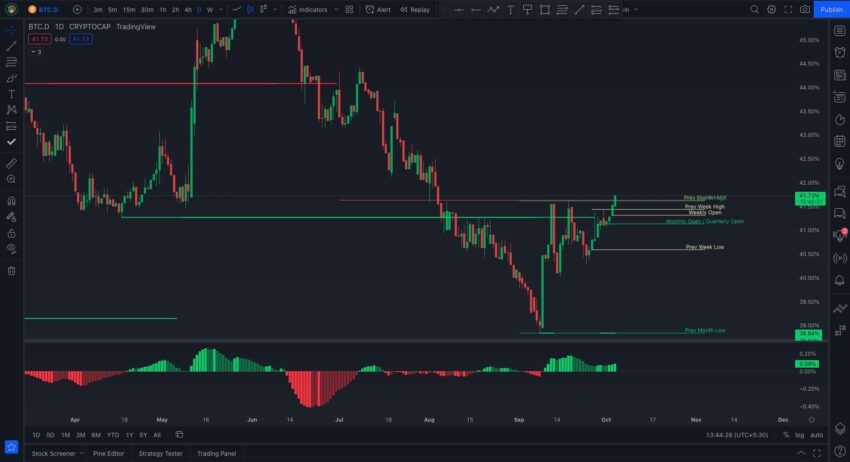
Cryptocurrency trader @icryptomonk tweeted a chart of BTCD, in which he suggests that Bitcoin dominance is currently breaking through the resistance level we mentioned above. Thus, he is “expecting ALT/BTC to continue bleeding for the next couple of days.”

Ethereum (ETH) is losing to Bitcoin (BTC)
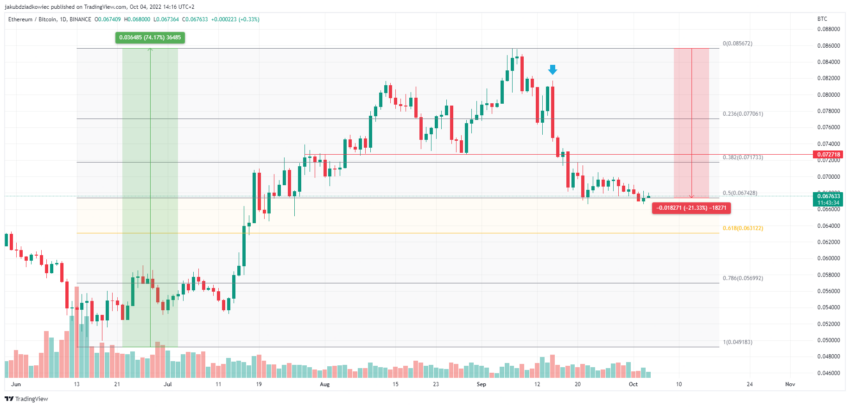
The ETH/BTC pair had been in an uptrend since the bottom at 0.049 BTC on June 13., Since then, Ethereum has gained 74% against Bitcoin in anticipation of the Merge update, which completed the network’s transition from proof-of-work to proof-of-stake protocol.
However, just before Sept. 15 and the update went into effect (blue arrow), ETH/BTC began to lose value sharply. So far, the decline has led to support at 0.067 BTC at a 0.5 Fib retracement. This corresponds to a 21% decline from the peak at 0.085 BTC.

The start of Ethereum declines against Bitcoin coincided with the bottom of Bitcoin dominance just below the 39% level. If BTCD overcomes the resistance outlined in the previous section, further drop in the ETH/BTC pair should be expected at least to the next support area at 0.063 BTC.
On the other hand, in the event of a short-term bounce, a move to the 0.072 BTC area is likely, and validation of resistance before further declines.
For Be[in]Crypto’s previous Bitcoin (BTC) analysis, click here.
Disclaimer: Be[in]Crypto strives to provide accurate and up-to-date information, but it will not be responsible for any missing facts or inaccurate information. You comply and understand that you should use any of this information at your own risk. Cryptocurrencies are highly volatile financial assets, so research and make your own financial decisions.
Trusted
Disclaimer
In line with the Trust Project guidelines, this price analysis article is for informational purposes only and should not be considered financial or investment advice. BeInCrypto is committed to accurate, unbiased reporting, but market conditions are subject to change without notice. Always conduct your own research and consult with a professional before making any financial decisions. Please note that our Terms and Conditions, Privacy Policy, and Disclaimers have been updated.


