

The bitcoin dominance rate (BTCD) has broken down from a long-term support level at 57.5%.
In the long-term, the BTCD is expected to continue moving downwards until it reaches the 50% support level.
Long-term BTCD trend
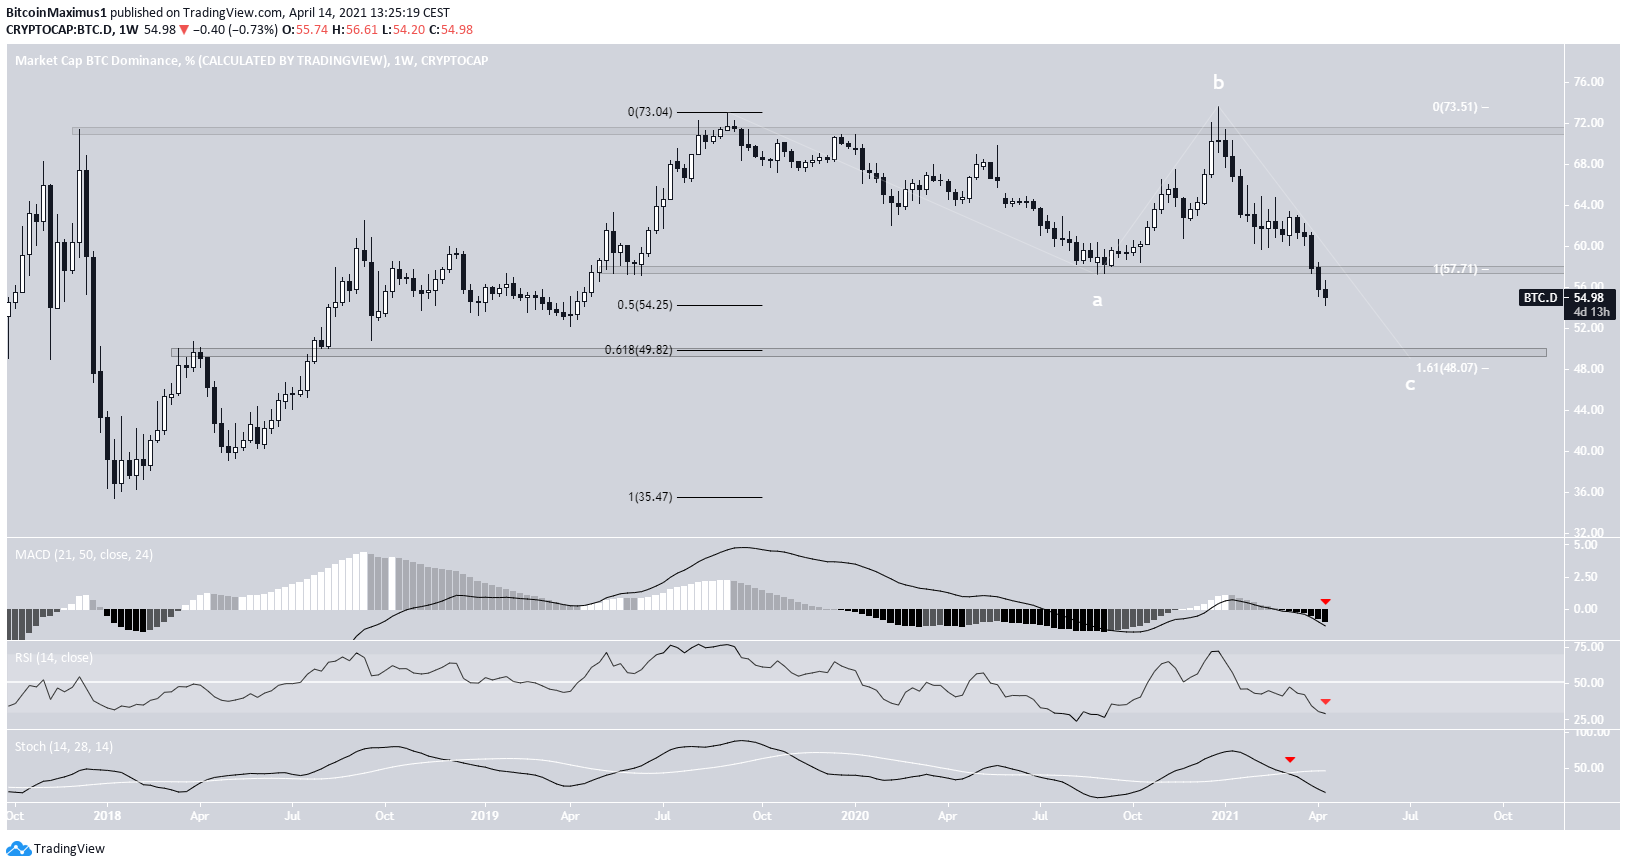
The BTCD has been moving downwards since it reached a high of 71.30% in December 2020.
At the end of March 2021, it reached the 57.75% level, which had previously been acting as support since April 2019. It has since fallen below and is searching for support.
The next support level will likely be found at 49.8%. This is the 0.618 Fib retracement level of the entire upward movement, measuring from 2018.
Technical indicators are bearish. The MACD is negative, the Stochastic oscillator has just made a bearish cross, and the RSI is very close to decreasing below 30.
Therefore, in the long-term, it’s likely that the BTCD falls all the way to 49.80%.
Furthermore, if the ongoing decrease from October 2019 is a flat A-B-C structure, the 1:1.61 ratio between waves A:C would fall at 48%. This projects even more strength on the 50% level.
Cryptocurrency trader @Damskotrades outlined a BTCD chart, stating that it could potentially continue falling all the way back down to the range lows at 36.5%.
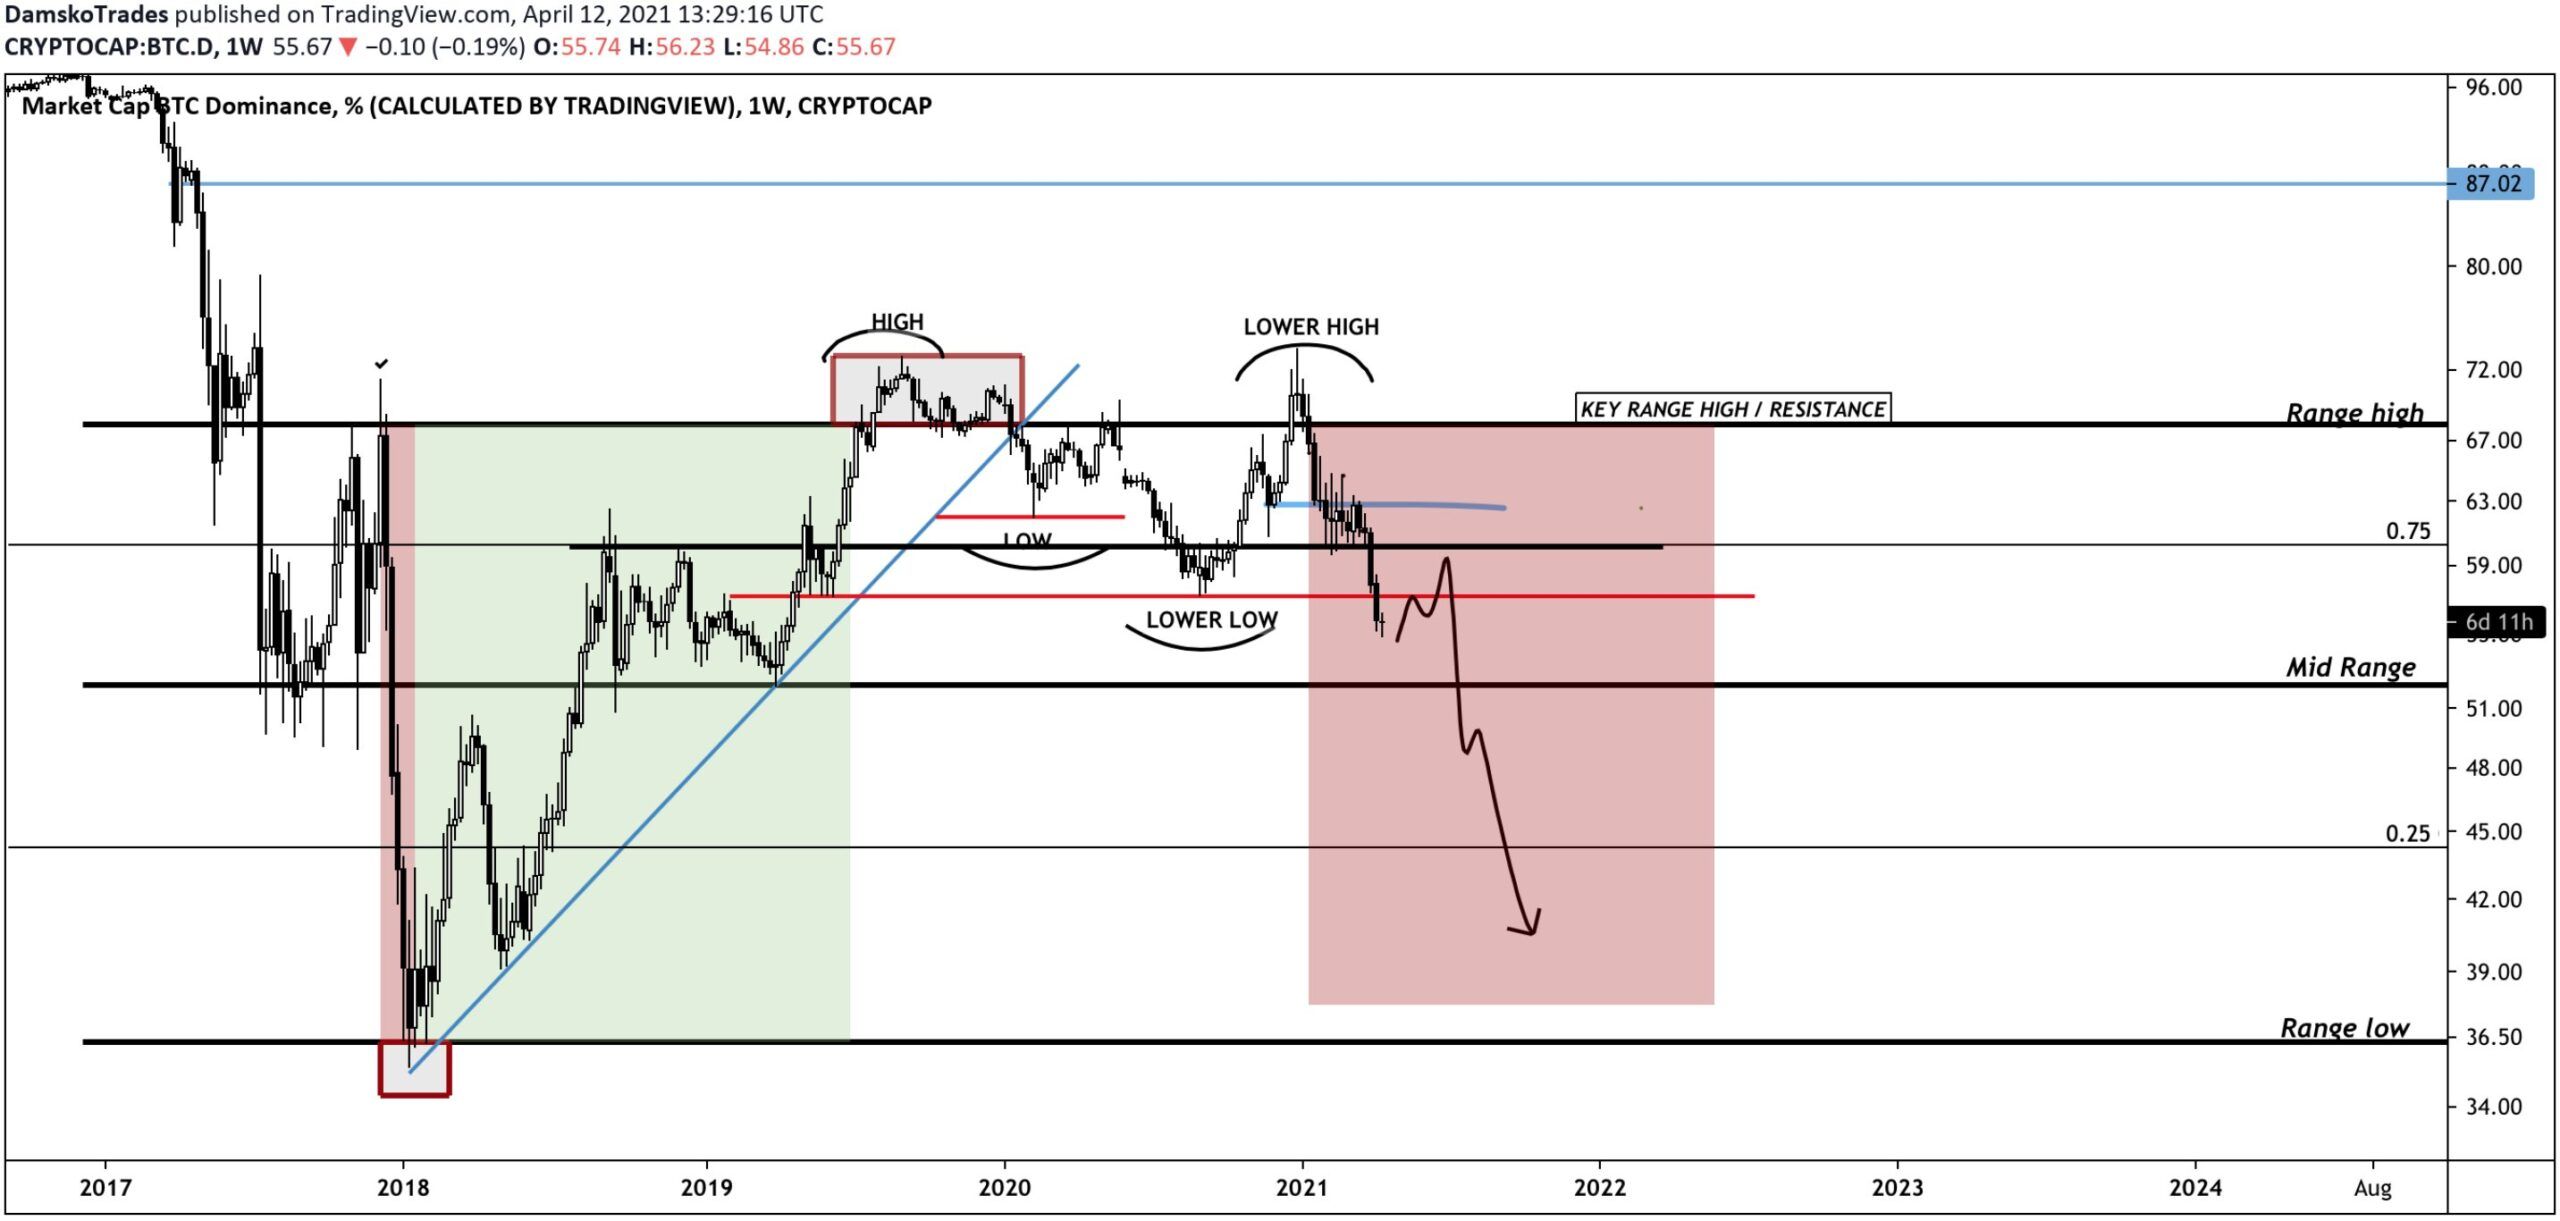
This is certainly possible, especially considering long-term indicators look bearish. However, it has to first break down from the 50% area for this to occur.
Short-term BTCD movement
The daily chart shows that the BTCD has been decreasing since breaking down from a fourth wave triangle on March 28.
There are two potential targets for the bottom of this movement, found at 54.73% and 49.4%. The first is found by projecting the 1:0.618 length of waves 1-3, while the second target is the 1:1 length. Since the latter also fits with the longer-term outlook, it’s more likely to be reached.
Similar to the weekly time-frame, technical indicators are bearish despite a potential bullish divergence in the RSI.

ETH/BTC
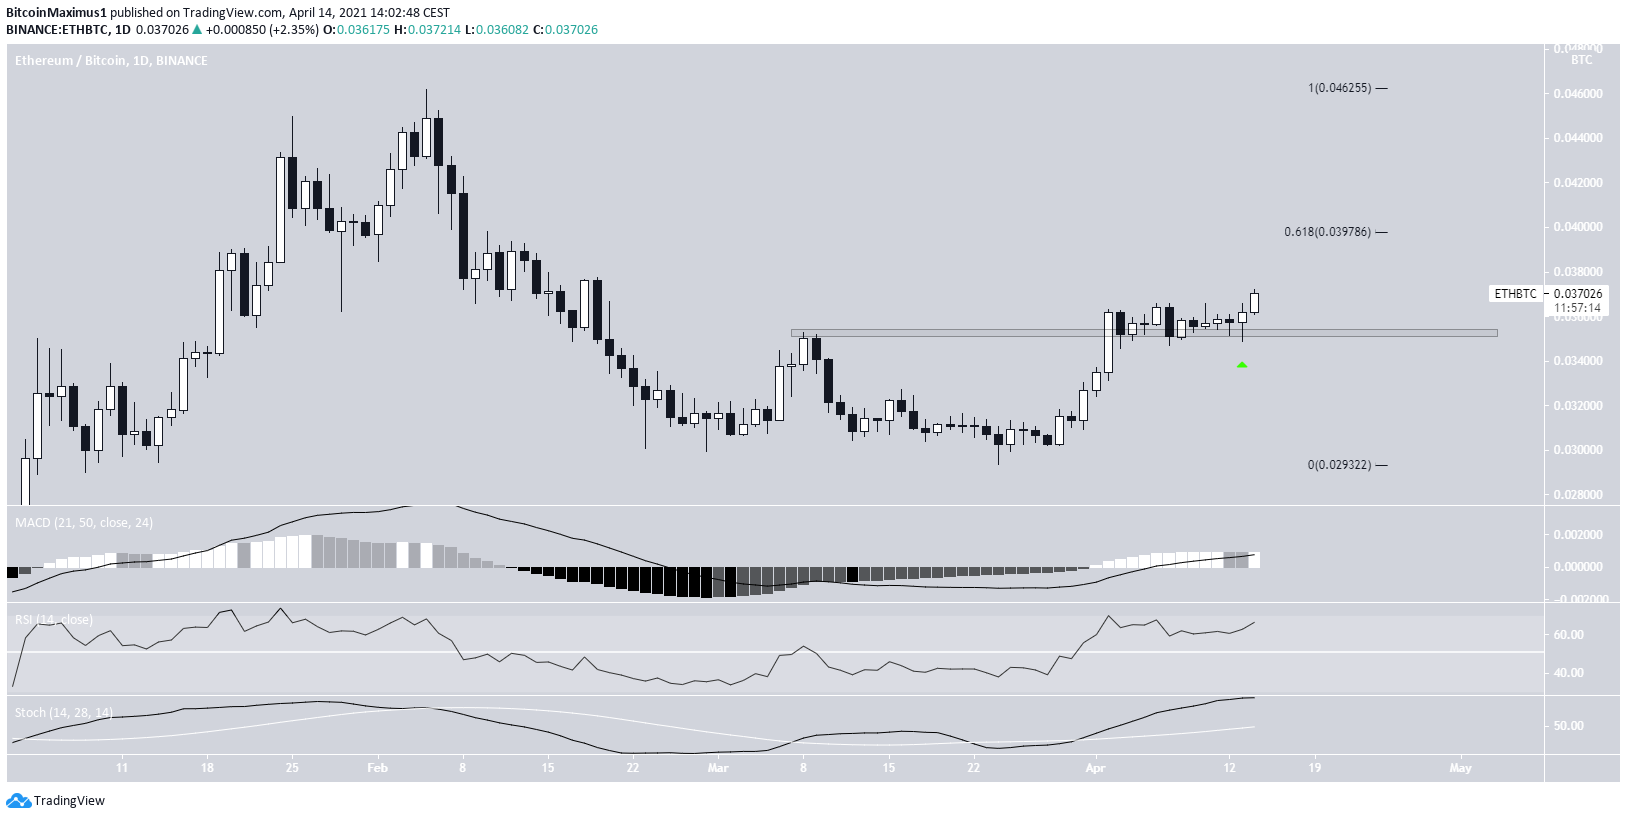
Since Ethereum (ETH) is the largest altcoin, it makes sense to take a look at the ETH/BTC pair.
After reclaiming the ₿0.0352 resistance area, ETH returned to validate it as support on April 12. It has been moving upwards since.
There is resistance at ₿0.0397, which is also the 0.618 Fib resistance level. However, the main resistance area is found at ₿0.046, made by the February highs.
Conclusion
It’s likely that the BTCD will continue its long-term bearish trend towards 50%.
ETH/BTC is expected to increase towards ₿0.046.
For BeInCrypto’s latest bitcoin (BTC) analysis, click here.
Trusted
Disclaimer
In line with the Trust Project guidelines, this price analysis article is for informational purposes only and should not be considered financial or investment advice. BeInCrypto is committed to accurate, unbiased reporting, but market conditions are subject to change without notice. Always conduct your own research and consult with a professional before making any financial decisions. Please note that our Terms and Conditions, Privacy Policy, and Disclaimers have been updated.
