

The Bitcoin dominance rate (BTCD) has been moving downwards since July 30 and broke down from an ascending support line shortly after.
It has moved below the 0.618 Fib retracement support level and is heading towards the minor support at 41.50% horizontal support.
Long-term BTCD descent
BTCD has been moving downwards since Jan 3, after reaching a high of 73.63%. So far, it has reached a low of 39.66% on May 19.
The ensuing bounce caused a validation of the 39% area as support.
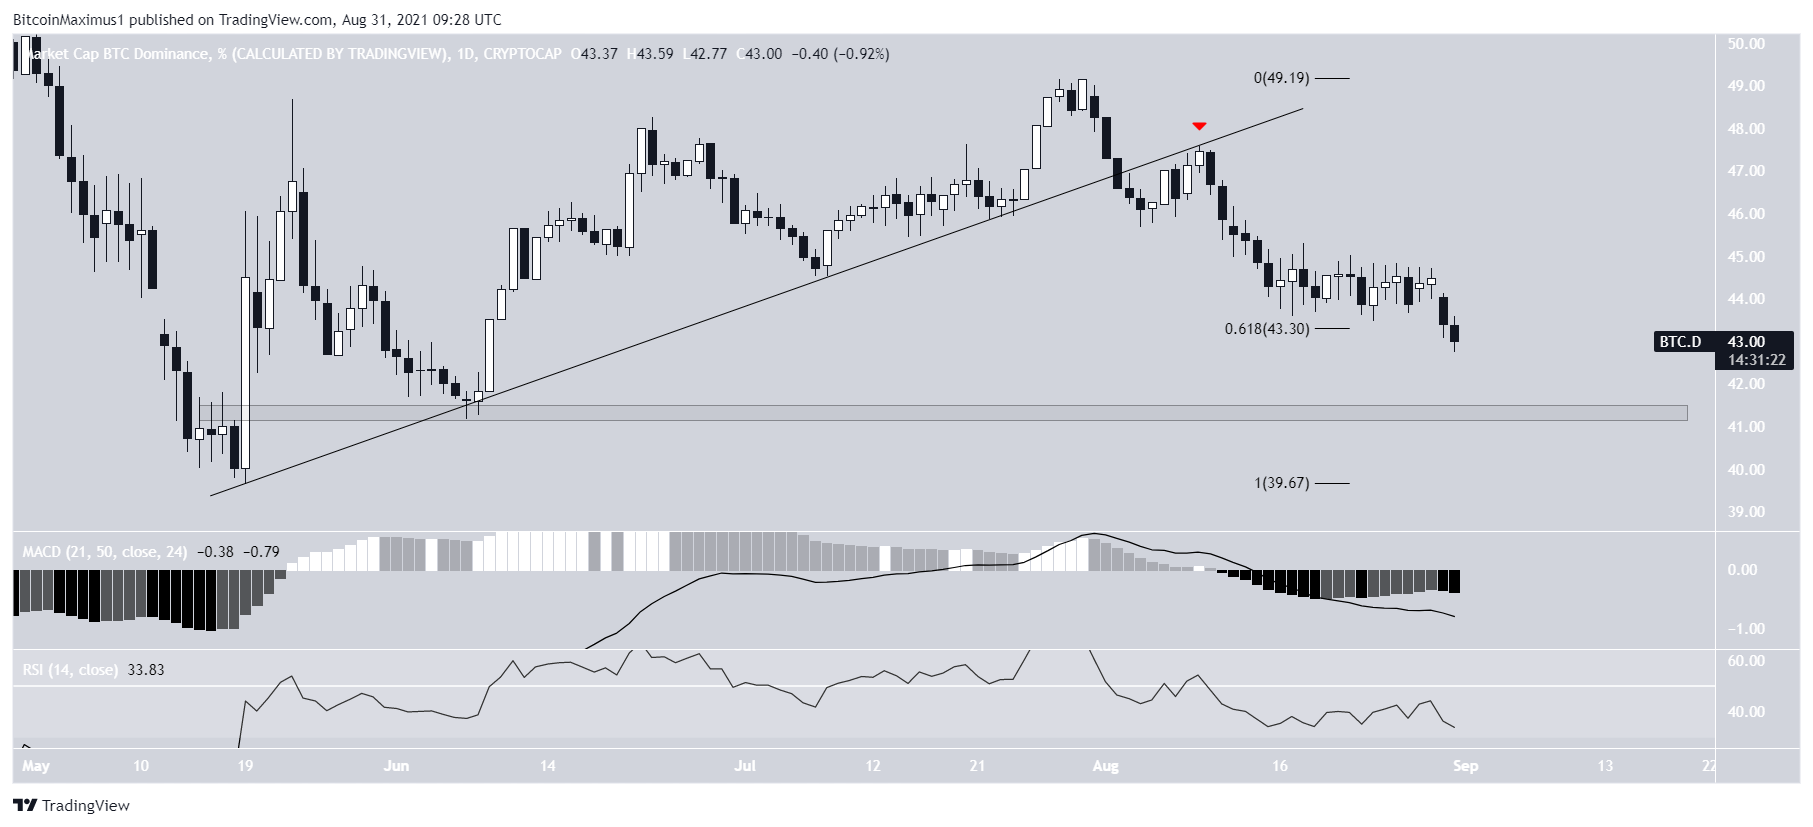
While BTCD reached a high of 49.15% on July 30, it has been decreasing since.
Technical indicators are providing some bullish signals, but not enough to confirm a bullish trend reversal. The MACD is moving upwards but is still negative and the RSI has moved above 30 (green icon) but is still below 50 (red icon).

Future BTCD movement
Cryptocurrency trader @Thebull_crypto outlined a BTCD chart, stating that the downward move is expected to continue toward the 41% support area.
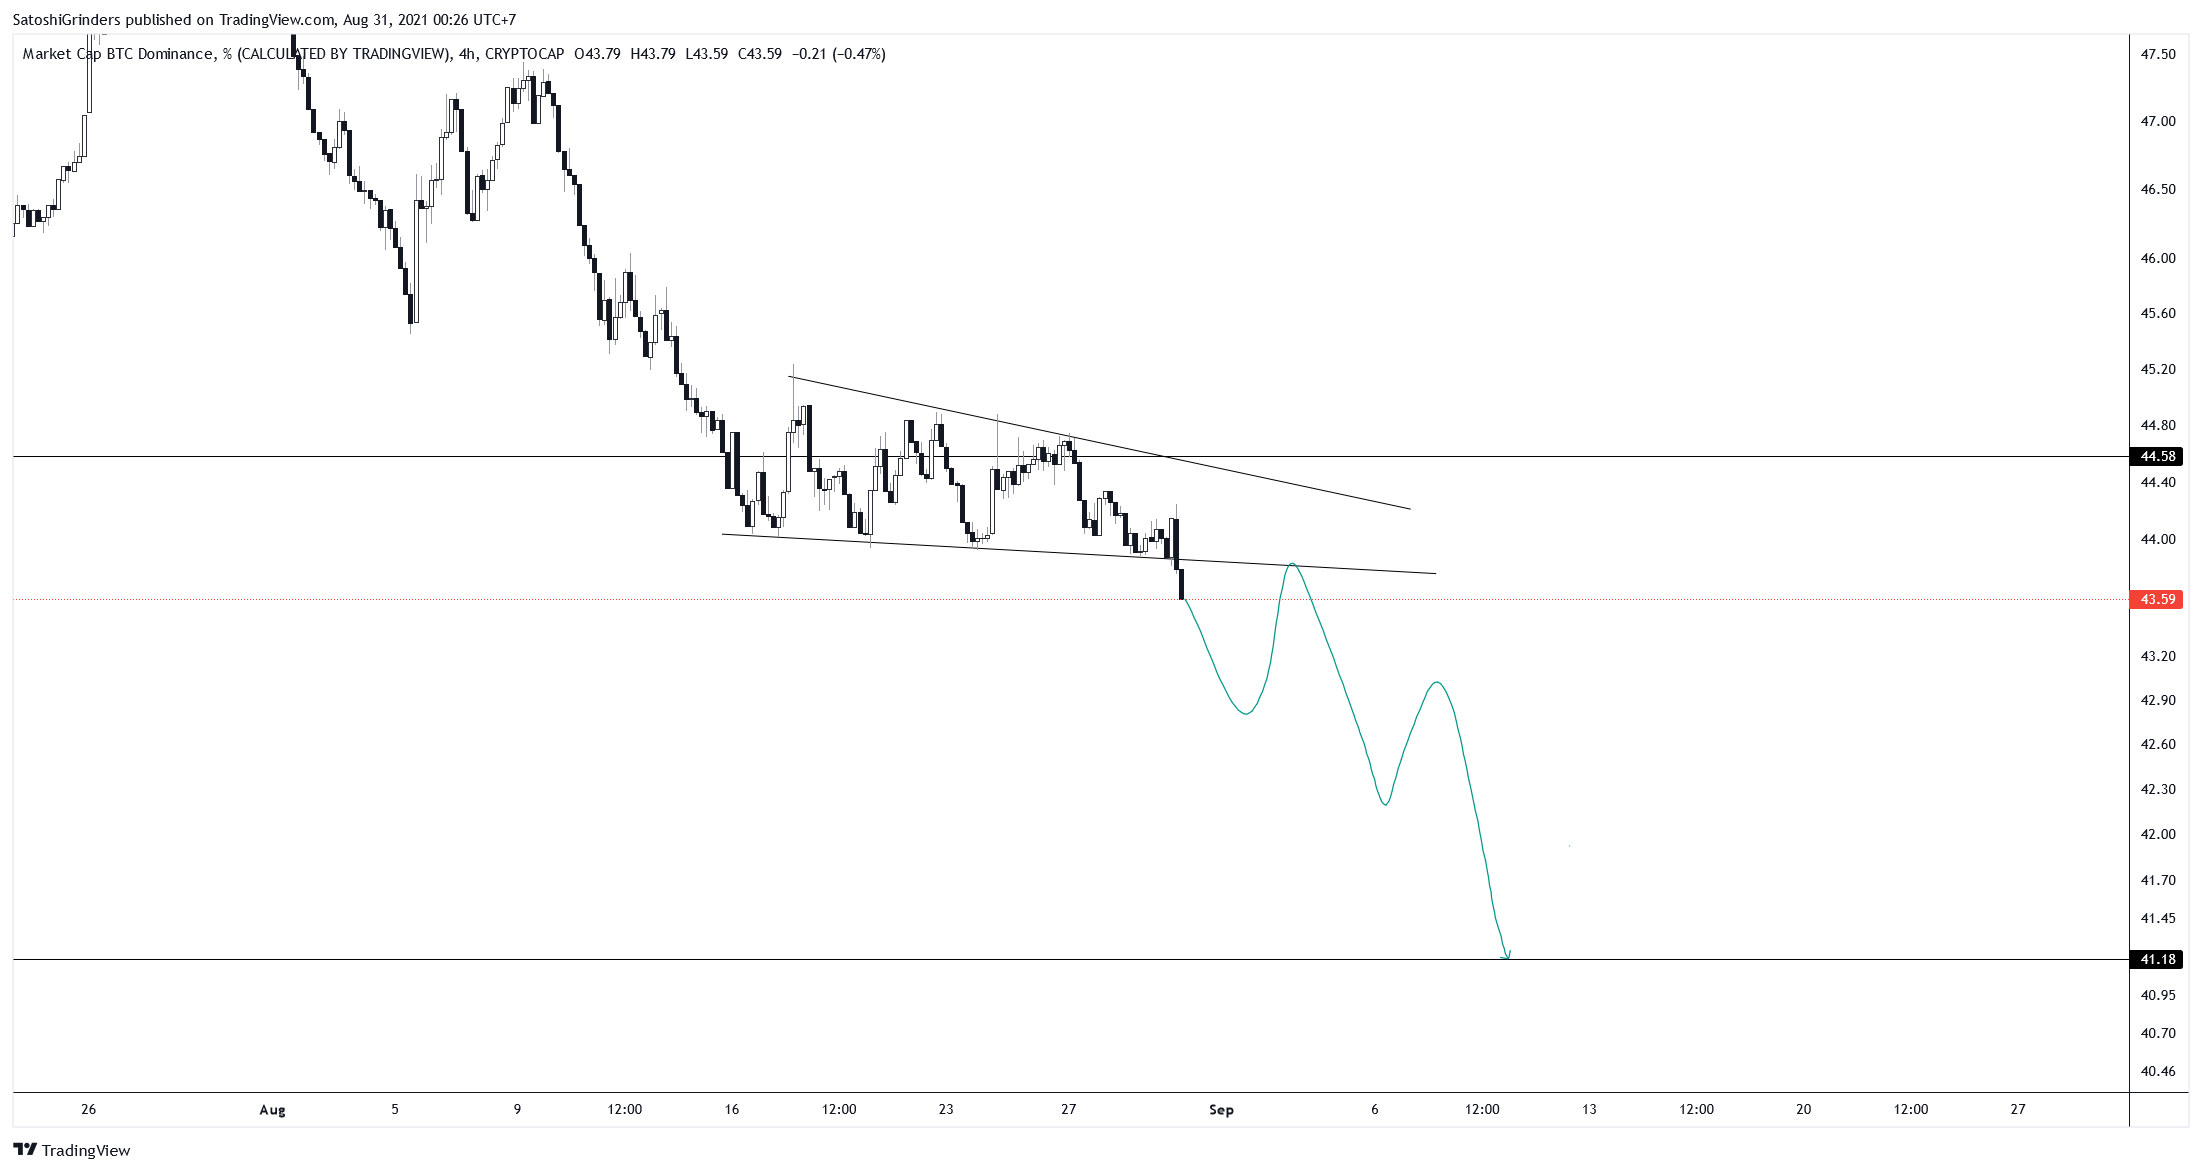
The daily chart shows that BTCD has broken down from an ascending support line and validated it as resistance on Aug 9 (red icon).
While it hovered above the 0.618 Fib retracement support level of 43.30% for around ten days, it finally broke down on Aug 29.
It’s currently heading towards the minor support level of 41.50%, as outlined in the tweet.
The MACD is negative and the RSI is below 50. Therefore, BTCD is likely to continue decreasing towards the aforementioned resistance.
Wave count
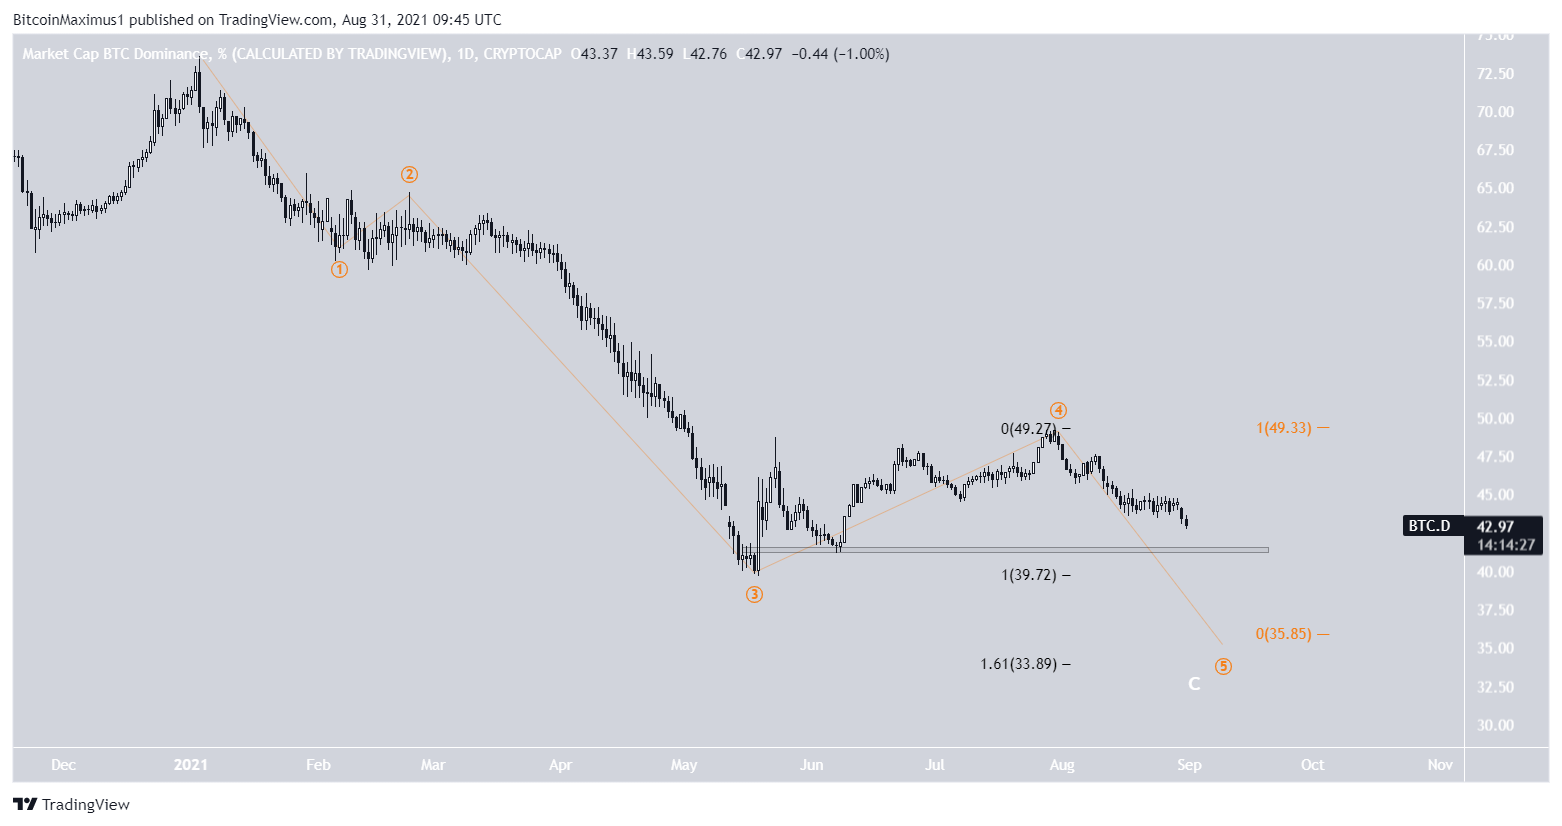
The wave count indicates that BTCD is in wave five of a bearish impulse (orange).
The most likely target for the bottom is found between 33.9%-35.8%. The target is found by using an external Fib retracement on wave four (black) and projecting the length of wave one to the top of wave four (orange).
If the target is reached, it would constitute a new all-time low.
For BeInCrypto’s latest Bitcoin (BTC) analysis, click here.
Trusted
Disclaimer
In line with the Trust Project guidelines, this price analysis article is for informational purposes only and should not be considered financial or investment advice. BeInCrypto is committed to accurate, unbiased reporting, but market conditions are subject to change without notice. Always conduct your own research and consult with a professional before making any financial decisions. Please note that our Terms and Conditions, Privacy Policy, and Disclaimers have been updated.
