

Bitcoin (BTC) is likely nearing the top of its short-term upward move or has already reached it. The longer-term trend remains firmly bullish.
BTC stalled after a considerable increase on Nov 8. Despite reaching an all-time high price the next day, it has been decreasing since.
The decrease was preceded by developing weakness in technical indicators in the form of bearish divergences in both the RSI and MACD. This means that the price increase was not accompanied by an equal increase in technical indicators. This can often lead to a trend reversal.
Therefore, despite the all-time high, technical indicators in the daily time frame are showing weakness.

Short-term movement
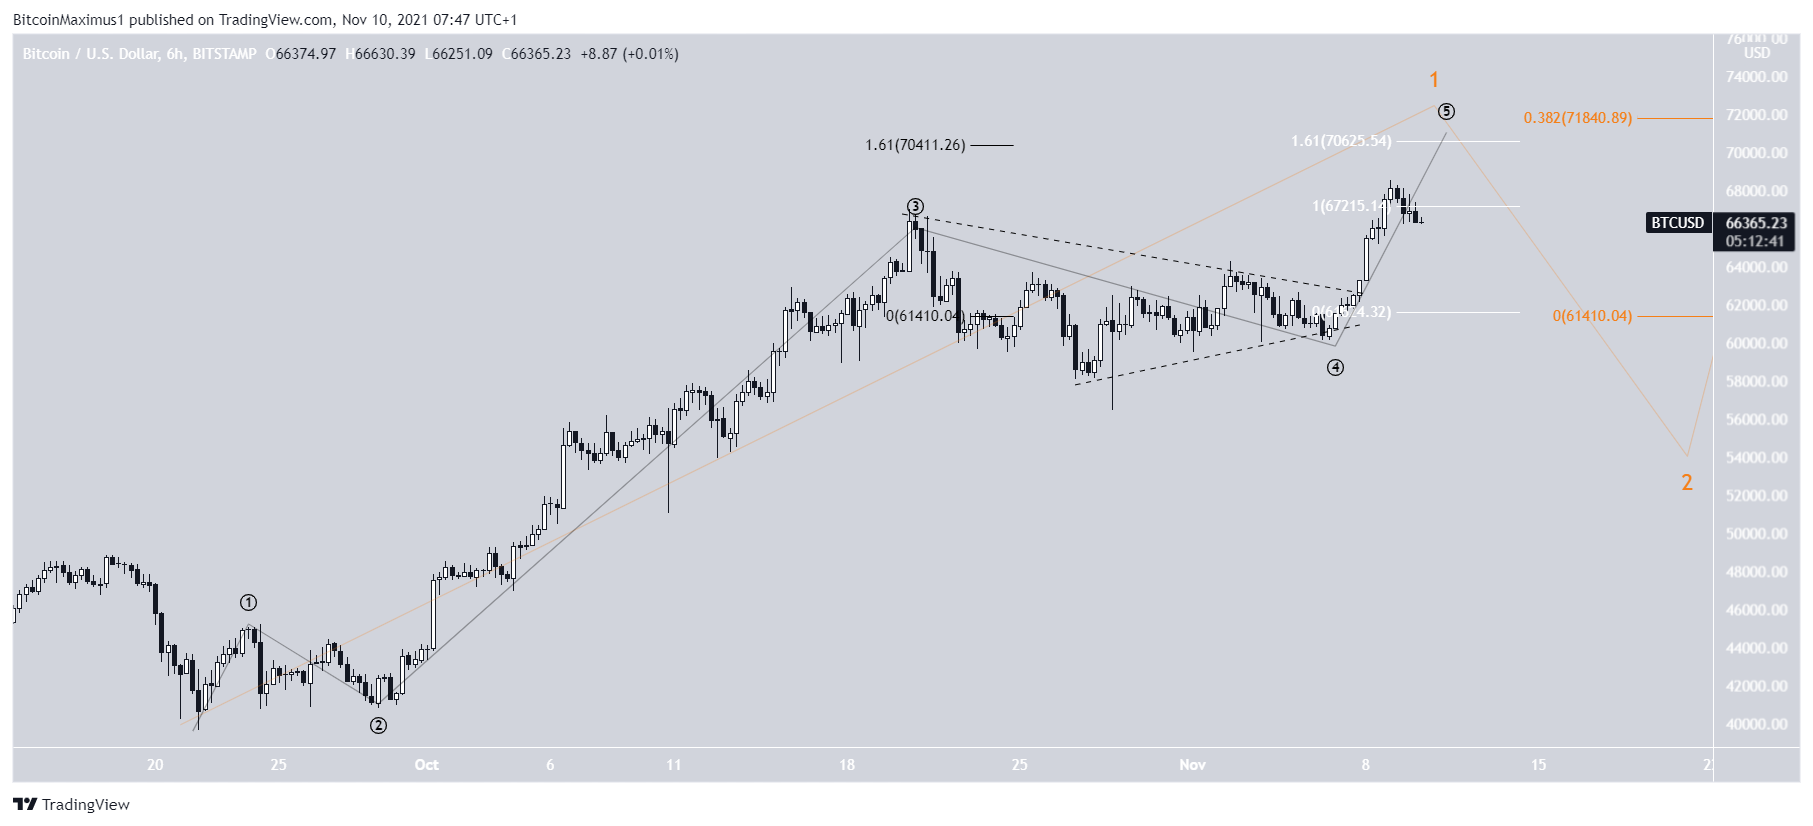
The six-hour chart shows that BTC broke out from a symmetrical triangle prior to reaching the all-time high price.
Currently, it’s in the process of validating the previous all-time high level at $63,300 as support. If successful, this would be a very bullish development that would likely lead to further highs.
If not, the next support area would likely be reached at $63,500.

Wave count
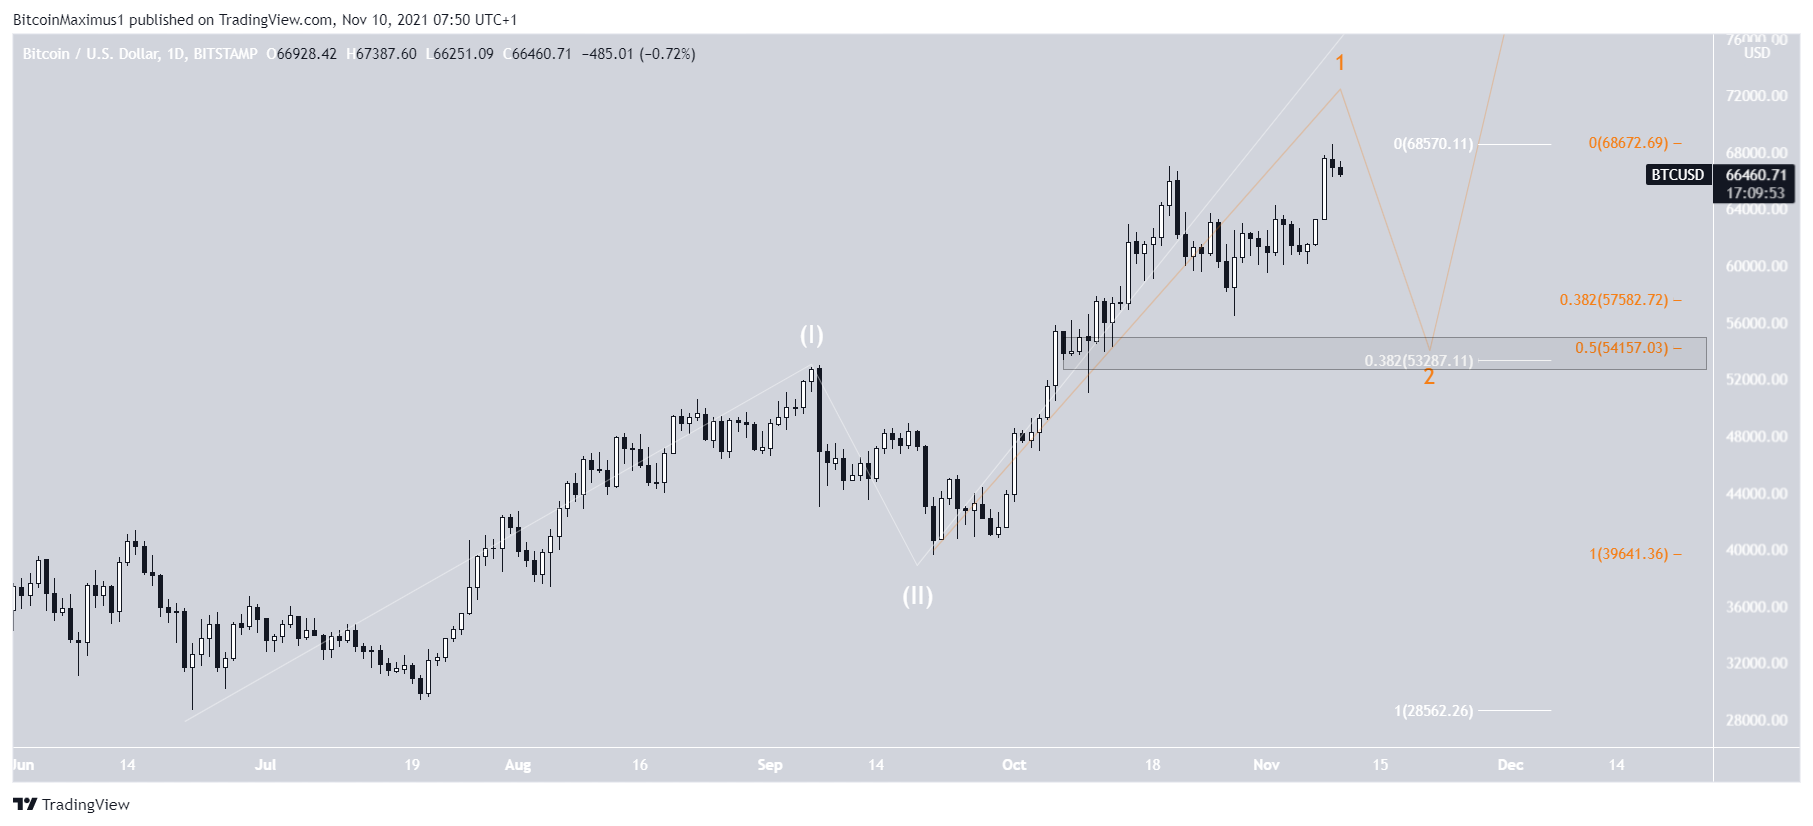
The wave count shows that BTC is very close to or has already reached the top of wave one (orange) of a five-wave upward move. The sub-wave count is shown in black.
The most likely area for a top remains between $70,400-$71,840, due to the confluence of numerous Fib levels.
However, the length of sub-wave five is already more than the length of sub-wave one (white). So it’s possible that a local top has been reached.
A corrective period would be expected to follow. The first support area is found at $57,600. This target is the 0.382 short-term Fib retracement support level (orange).
The main support area is found between $53,300 and $54,150. It’s created by the short-term 0.5 Fib retracement support level and long-term 0.382 level (white). Furthermore, it’s a horizontal support area.
Due to the confluence of support levels, it’s likely to be a strong support area.
For BeInCrypto’s previous Bitcoin (BTC) analysis, click here.
Trusted
Disclaimer
In line with the Trust Project guidelines, this price analysis article is for informational purposes only and should not be considered financial or investment advice. BeInCrypto is committed to accurate, unbiased reporting, but market conditions are subject to change without notice. Always conduct your own research and consult with a professional before making any financial decisions. Please note that our Terms and Conditions, Privacy Policy, and Disclaimers have been updated.
