

Bitcoin (BTC) is trading inside a corrective pattern and facing resistance from the $22,000 area. It has to reclaim this level in order for the bullish structure to remain intact.
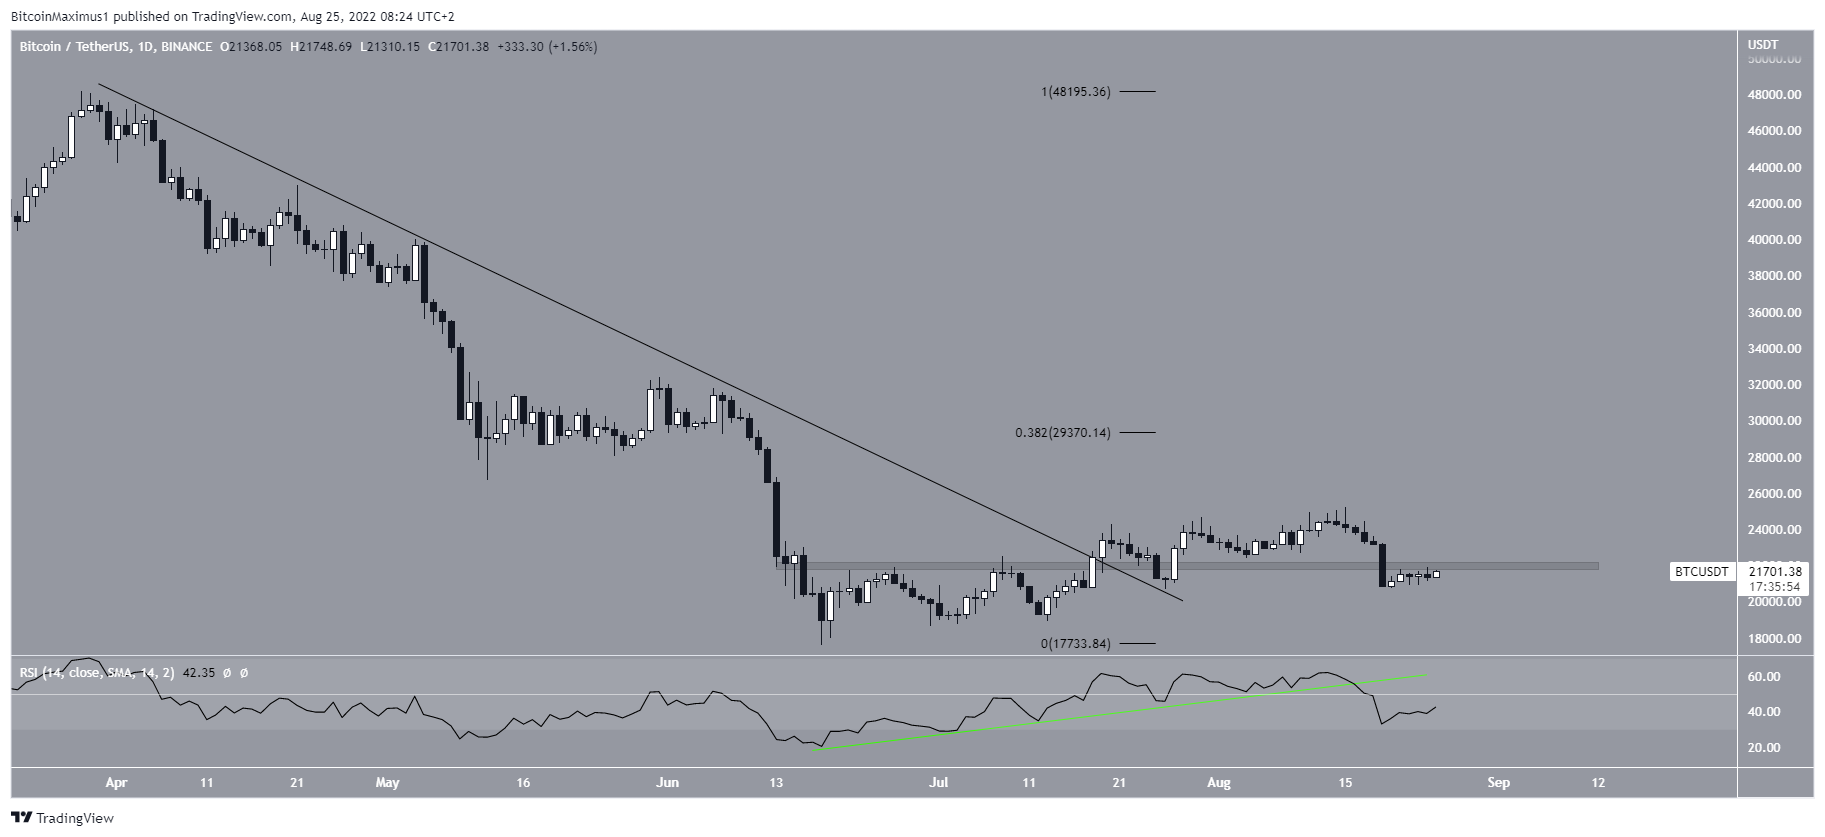
Bitcoin has been moving mostly upwards since reaching a local low of $17,622 on June 18. On July 18, the upward move caused a breakout above a descending resistance line that had been in place since March.
However, BTC failed to sustain its gains and got knocked back after reaching a local high of $25,211. This was considerably lower than the 0.382 Fib retracement resistance level of $29,370. The failure to even reach the first important Fib level shows substantial weakness.
The rejection has also caused BTC to drop below the $22,000 level, which is now expected to provide resistance.
RSI breakdown
The daily RSI also shows a bearish reading in the form of a breakdown from an ascending support line (green line). Moreover, the indicator has fallen below 50 — often considered a strong sign of a bearish trend.
The trend cannot be considered bullish until Bitcoin is able to reclaim the $22,000 area and the daily RSI moves above 50.
Short-term BTC pattern
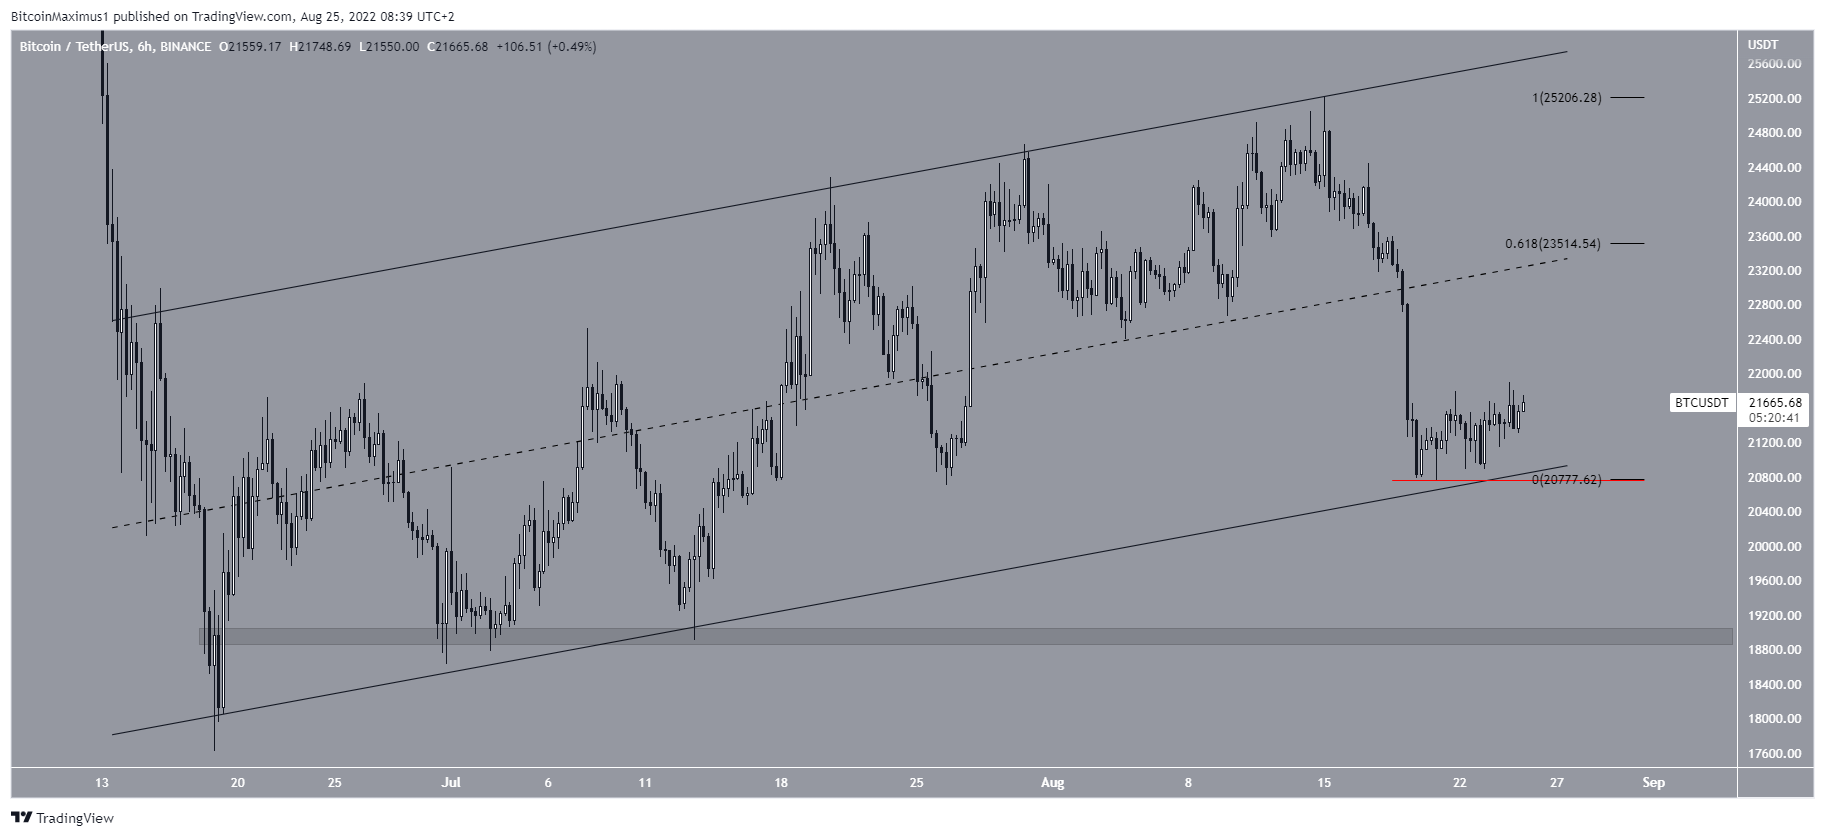
The six-hour chart shows that BTC has been trading inside an ascending parallel channel since the aforementioned June lows. Such channels usually contain corrective patterns, meaning that an eventual breakdown from it would be expected.
Bitcoin is also currently trading in the lower half of this channel, increasing the possibility of an eventual breakdown.
In the daily time frame, the main resistance area seems to be found at $22,000. However, the presence of the channel reveals a crucial resistance at $23,500, created by both the 0.618 Fib retracement resistance level and the midline.
A drop below the Aug. 20 lows of $20,761 (red line) would confirm that Bitcoin is most likely headed to the next closest support at $19,000.
Conversely, reclaiming the $22,000 area and the midline of the channel would be required for the trend to be considered bullish.
For Be[in]Crypto’s previous Bitcoin (BTC) analysis, click here
Trusted
Disclaimer
In line with the Trust Project guidelines, this price analysis article is for informational purposes only and should not be considered financial or investment advice. BeInCrypto is committed to accurate, unbiased reporting, but market conditions are subject to change without notice. Always conduct your own research and consult with a professional before making any financial decisions. Please note that our Terms and Conditions, Privacy Policy, and Disclaimers have been updated.
