

Bitcoin (BTC) is still trading in the lower portion of a corrective pattern that has been in place since June 18. The direction of the trend is still undetermined.
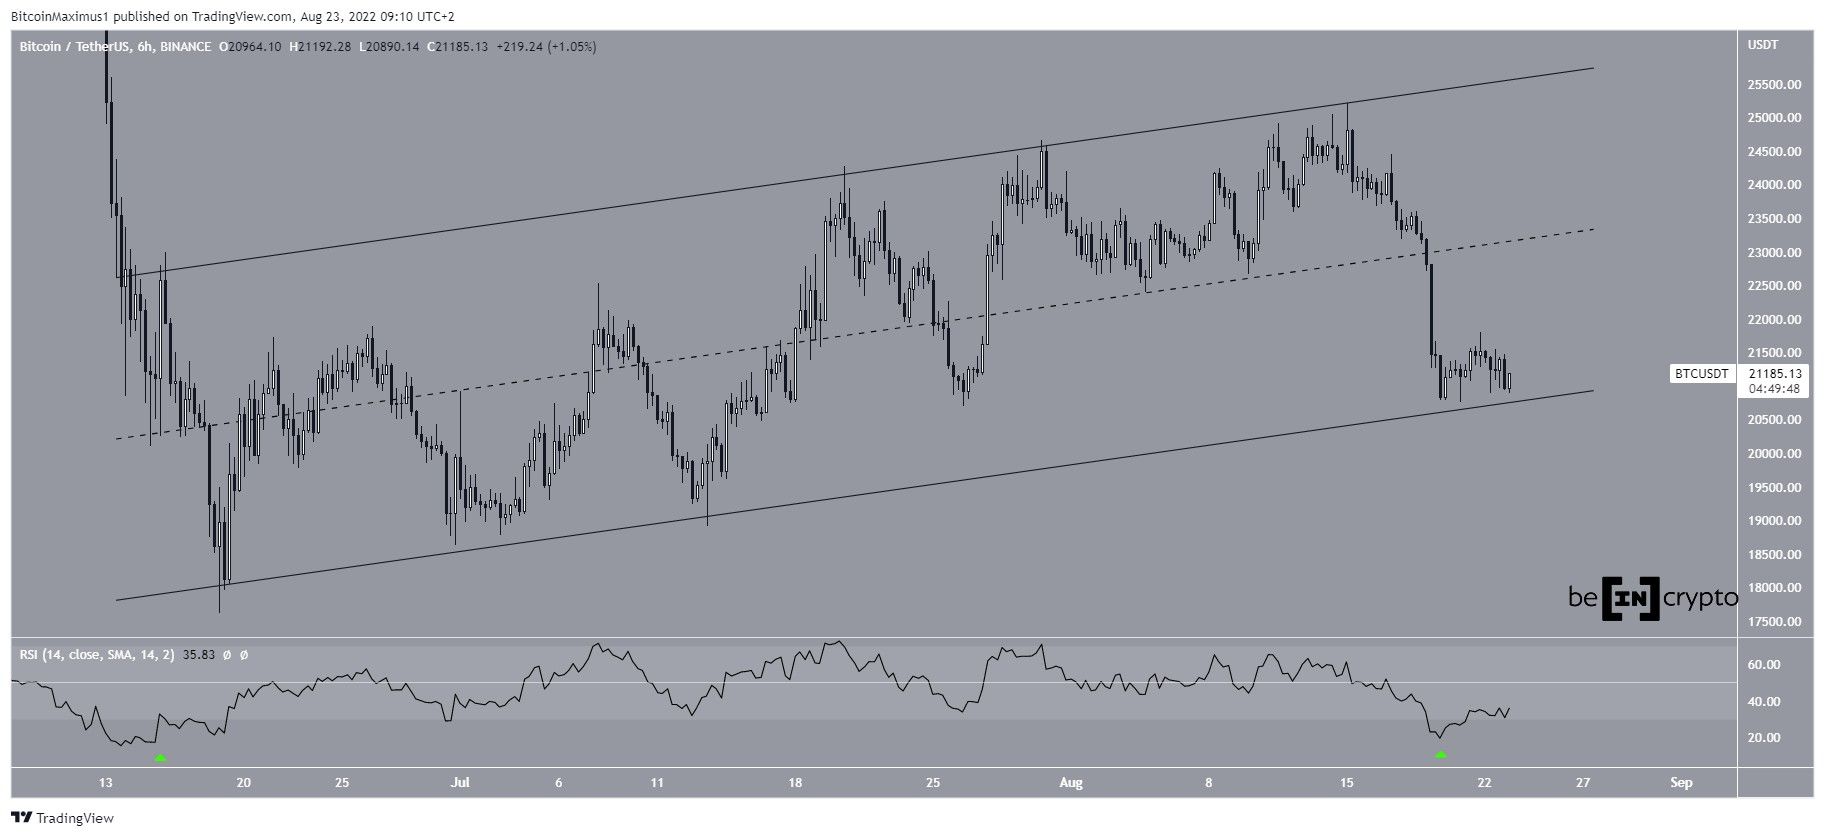
BTC has been trading inside an ascending parallel channel since reaching a low on June 18. Such channels usually contain corrective movements, meaning that an eventual breakdown from it would be the most likely scenario.
Moreover, Bitcoin is trading in the lower portion of this channel, increasing the possibility that the movement is corrective.
However, the support line of the channel is still intact and seems to have initiated a bounce. Moreover, the six-hour RSI has moved outside its oversold territory after previously falling below.
The previous time this occurred (green icon), Bitcoin initiated a significant upward movement.
So, whether BTC manages to move above the midline of the channel or breaks down below its support line instead will likely determine the direction of the future trend.
Short-term pattern
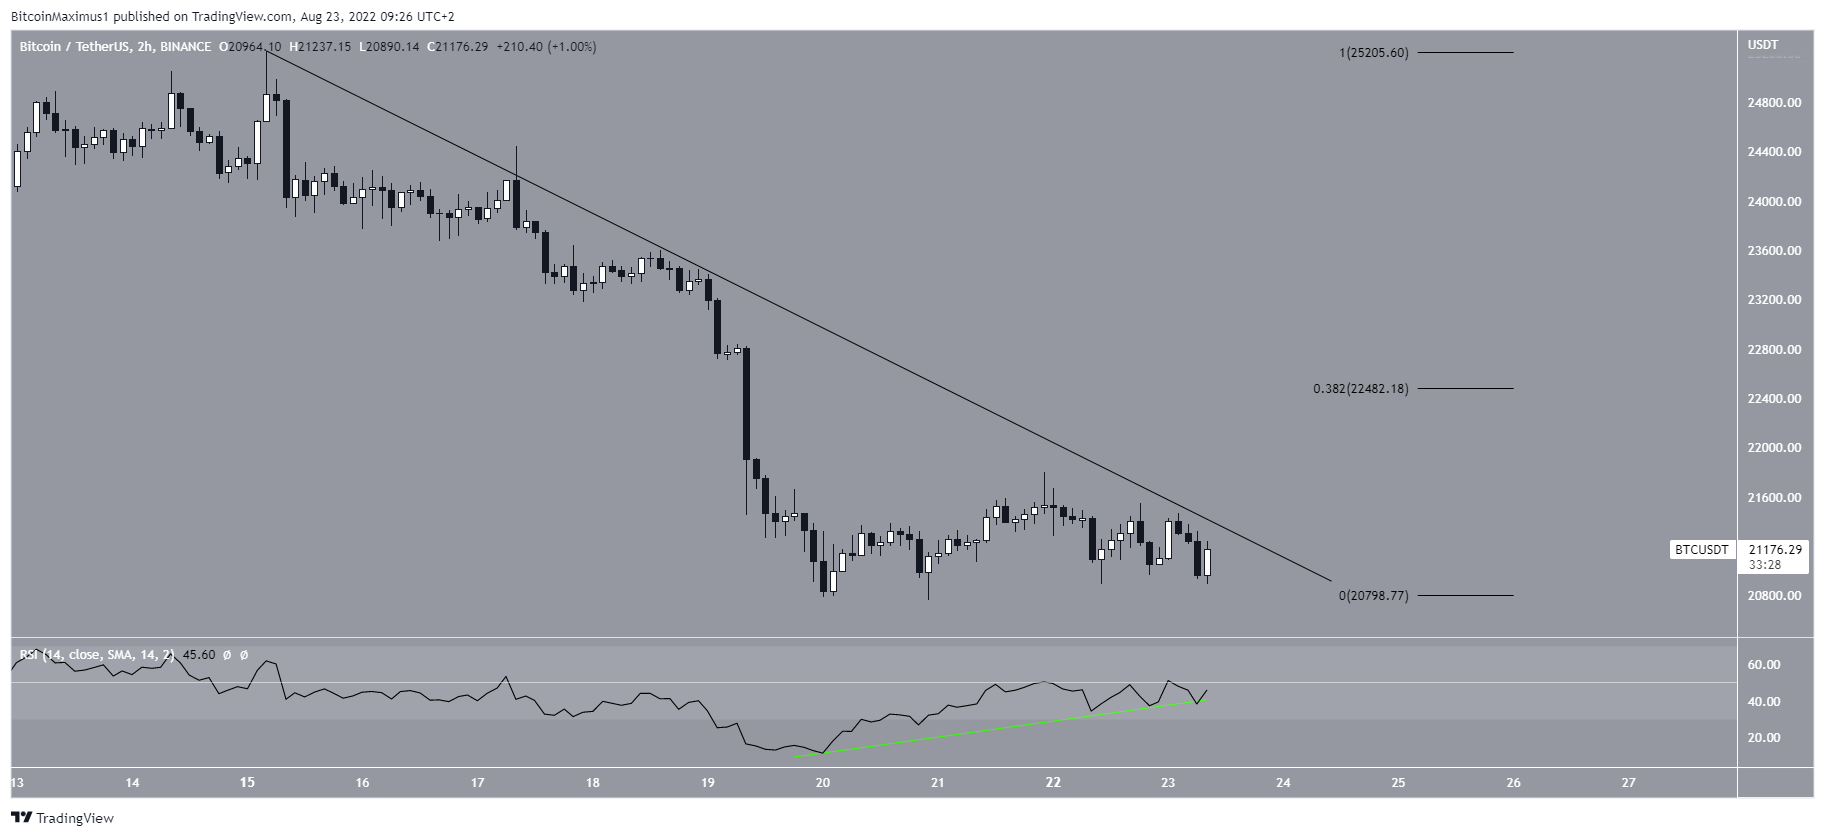
The two-hour chart shows that BTC has been decreasing underneath a descending resistance line since reaching a high on Aug 15. The line has so far caused four rejections (red icons).
The two-hour RSI is moving upwards (green line) but is still below 50. So, while the resistance line is creating resistance to the price, the 50 line is doing the same to the RSI.
A breakout from this channel would be expected to take BTC towards the 0.382 Fib retracement resistance level at $22,500.
Conversely, failure to break out and a subsequent decrease below $20,800 would likely cause a breakdown from the previously outlined channel.
BTC wave count analysis
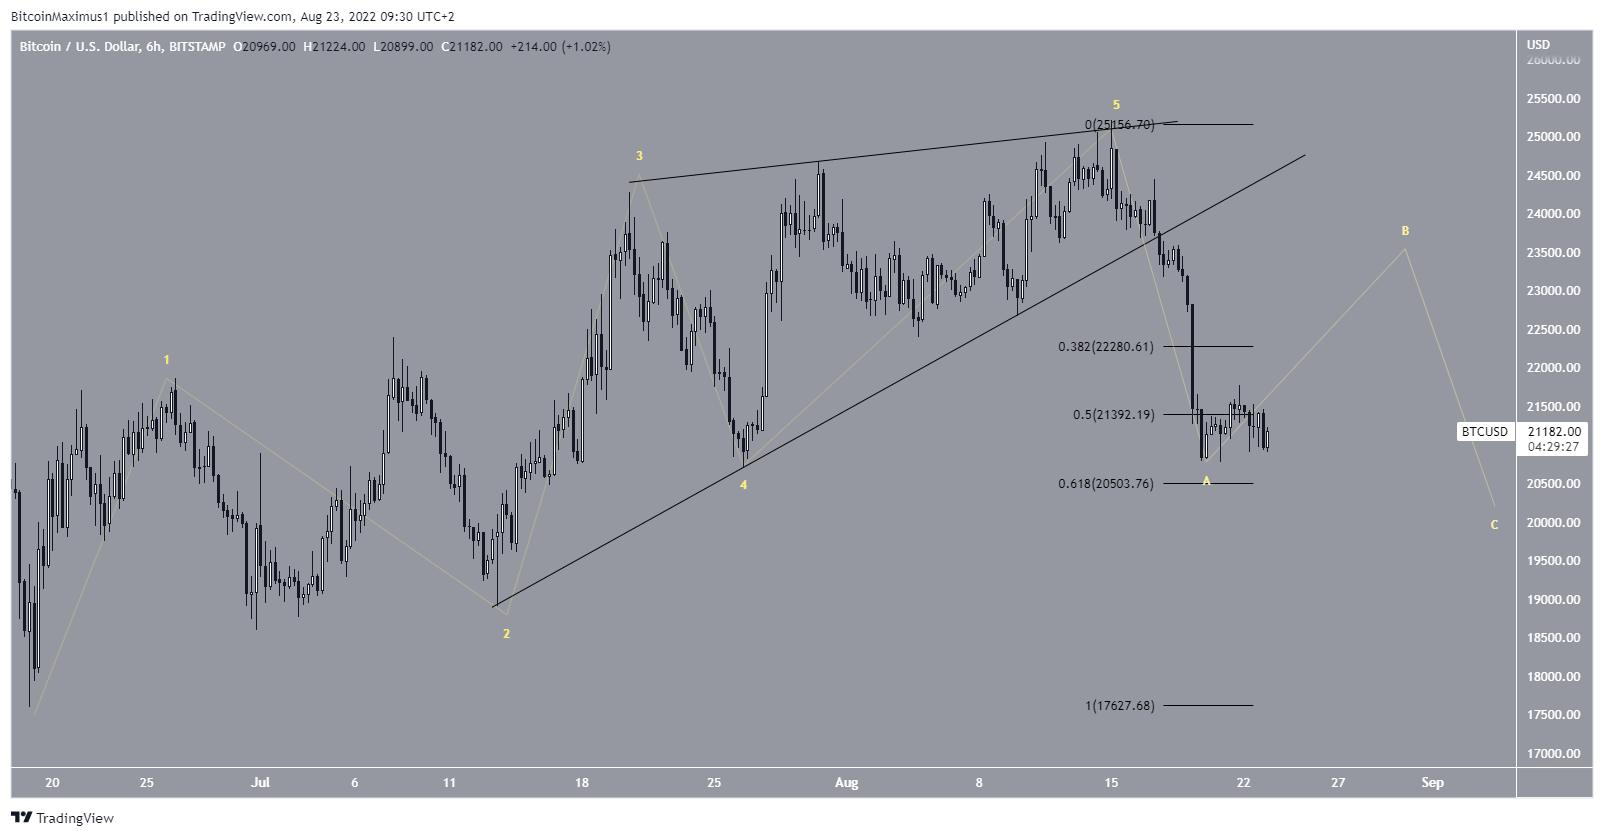
The most likely long-term wave count suggests that the bottom is in. However, there are two potential short-term counts in place.
The bullish one suggests that Bitcoin completed a leading diagonal and is now in the first part of an A-B-C corrective structure.
In it, Bitcoin will find support above $20,000 and resume its upward movement.
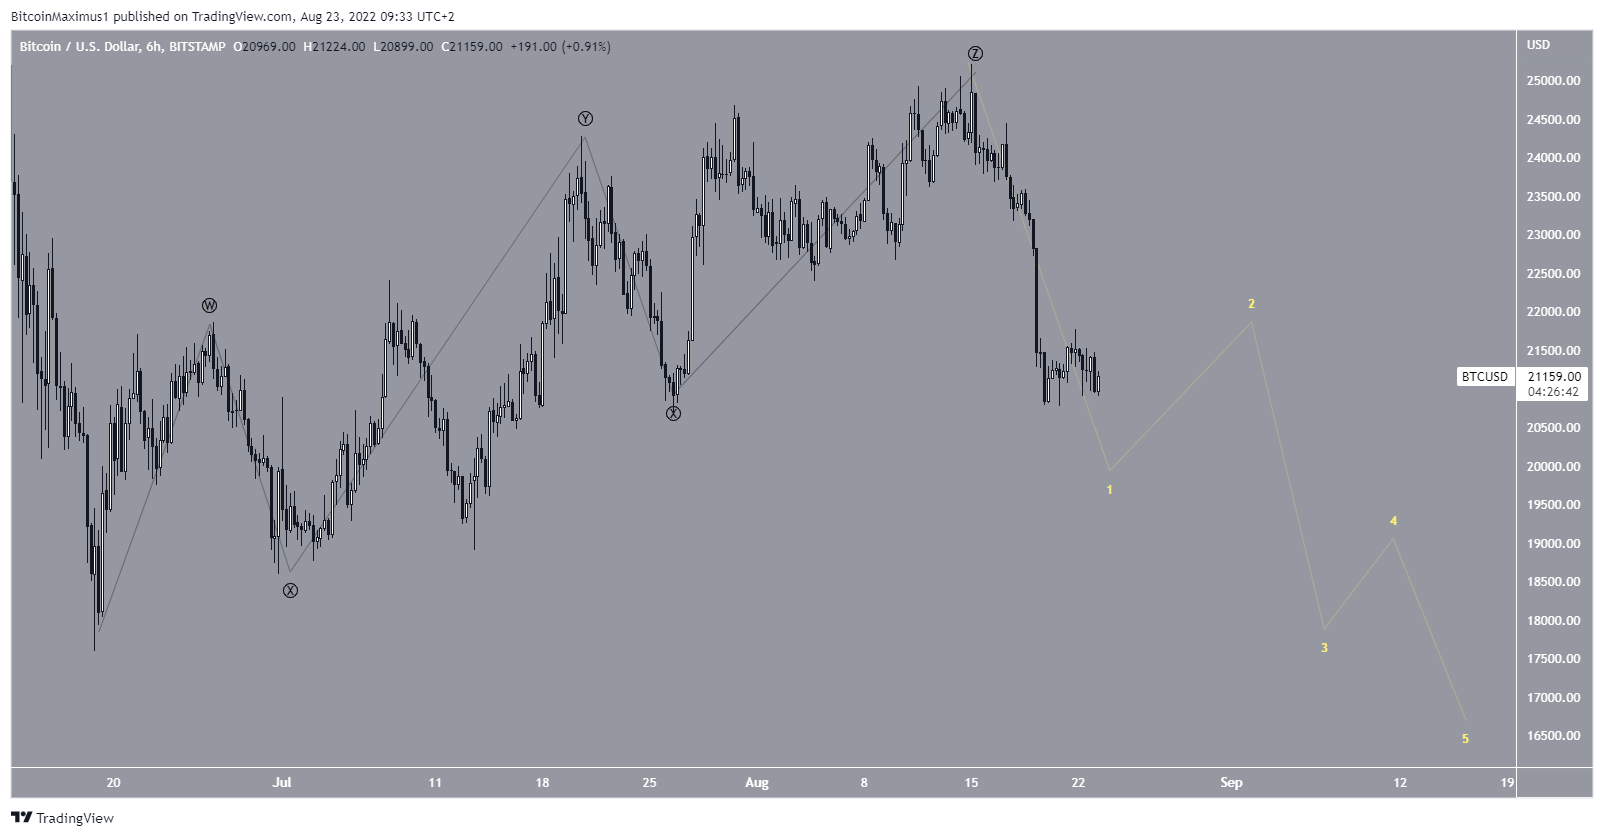
The second count suggests that Bitcoin has completed a complex corrective structure (black) and has now begun a bearish impulse (yellow). This is in line with the presence of the channel.
Whether Bitcoin breaks down from the channel or reclaims its midline instead will determine if the count is bullish or bearish.
For Be[in]Crypto’s previous Bitcoin (BTC) analysis, click here
Disclaimer
In line with the Trust Project guidelines, this price analysis article is for informational purposes only and should not be considered financial or investment advice. BeInCrypto is committed to accurate, unbiased reporting, but market conditions are subject to change without notice. Always conduct your own research and consult with a professional before making any financial decisions. Please note that our Terms and Conditions, Privacy Policy, and Disclaimers have been updated.
