

Bitcoin (BTC) decreased after reaching a high above $46,000 on Feb 10 and appears to be in the process of completing a corrective structure.
On Feb 10, Bitcoin reached a high of $45,821 before falling. The high was made right at the 0.618 Fib retracement resistance level at $44,900.
The ensuing decrease created a shooting star candlestick pattern. This is normally considered a bearish pattern, since selling pressure managed to create a long upper wick and a bearish close.
The fact that it transpired at an important resistance area further increases its significance.

Short-term movement
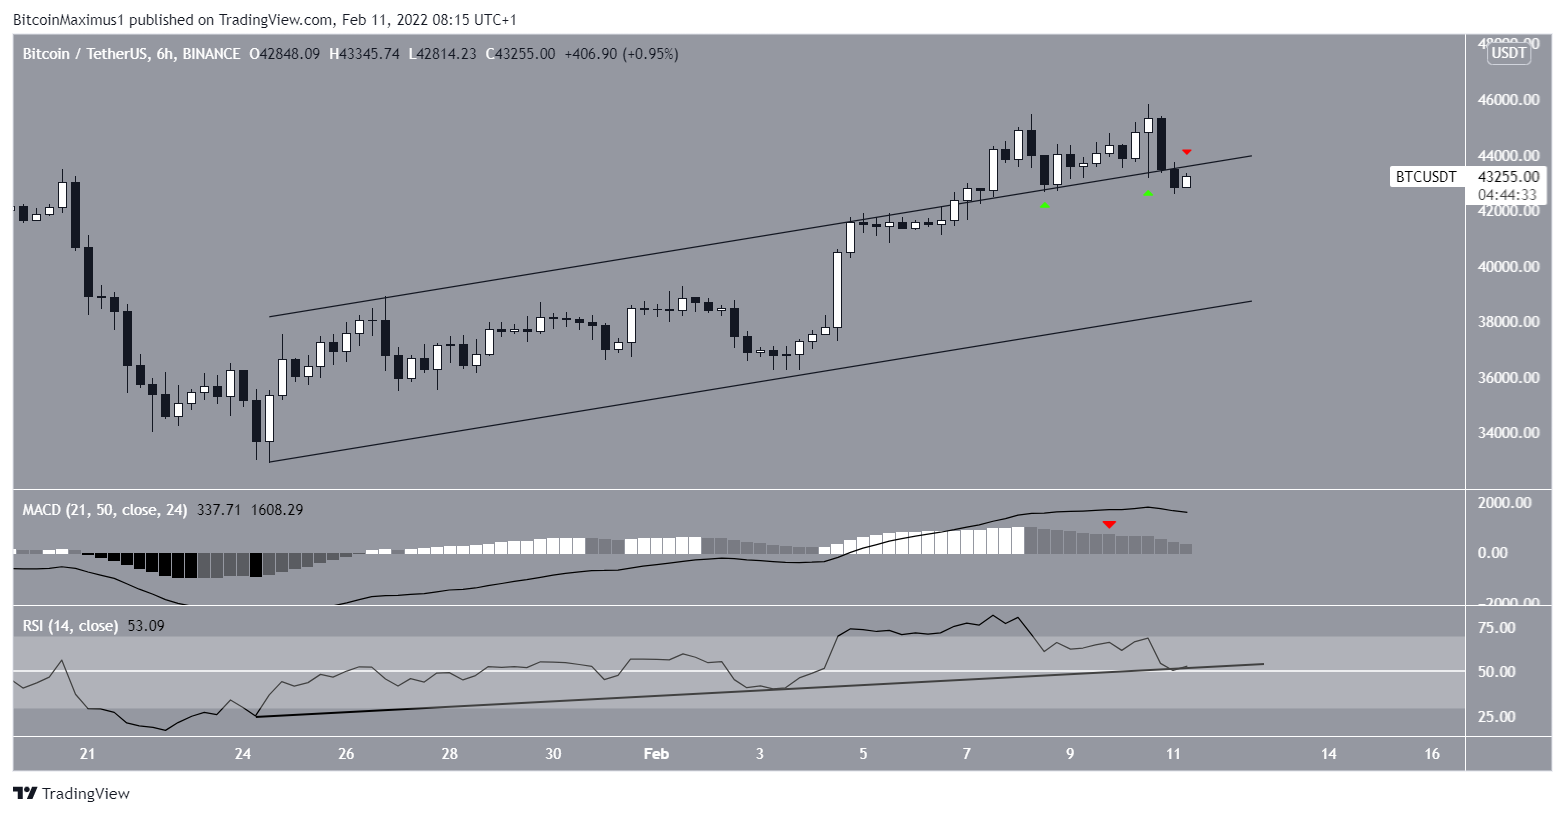
The six-hour chart shows that BTC has broken out from an ascending parallel channel that had previously been in place since Jan 24. The price validated the level as support twice afterward on Feb 9 and 10 (green icons). However, it broke down inside the channel once again the next day (red icon).
Technical indicators are showing some bearish signs, but do not confirm a bearish trend reversal.
The MACD, which is created by short and long-term moving averages (MA), is decreasing but is still positive.
The RSI, which is a momentum indicator, is also decreasing. It is however still above both the 50-line and an ascending trendline that has also been in place since Jan 24.
Until this level is broken, the ongoing bullish trend remains intact.
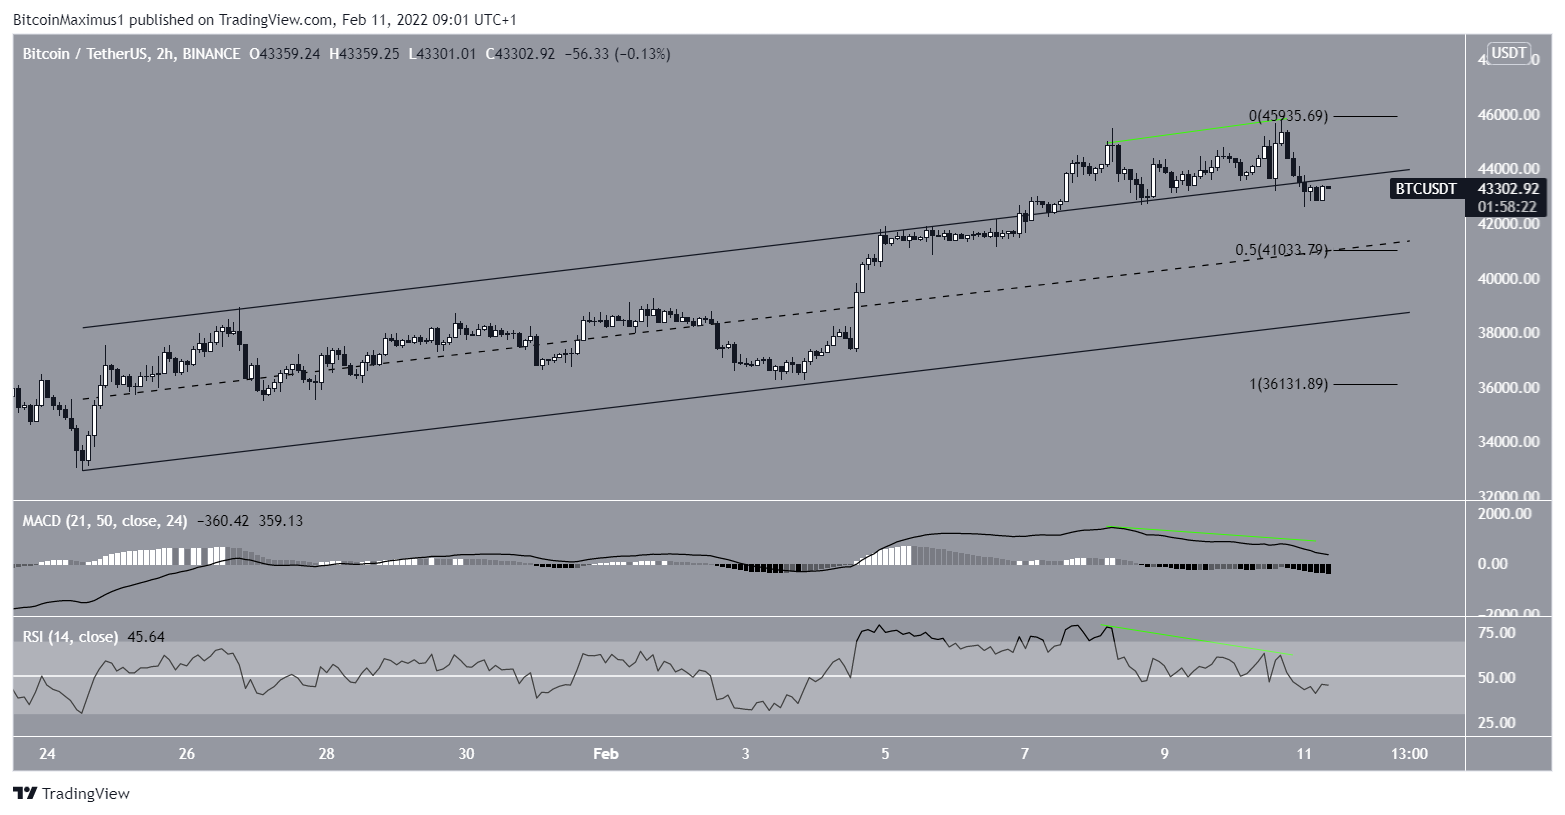
The two-hour chart also shows considerable weakness. This is especially visible in the bearish divergences that have developed in the RSI and MACD. This weakness preceded the ongoing downward move.
Currently, it seems that BTC Is in the process of validating the resistance line of the channel once again.
The main support area is found at $41,000. This target is the 0.5 Fib retracement support level and the midline of the ascending parallel channel.
BTC wave count analysis
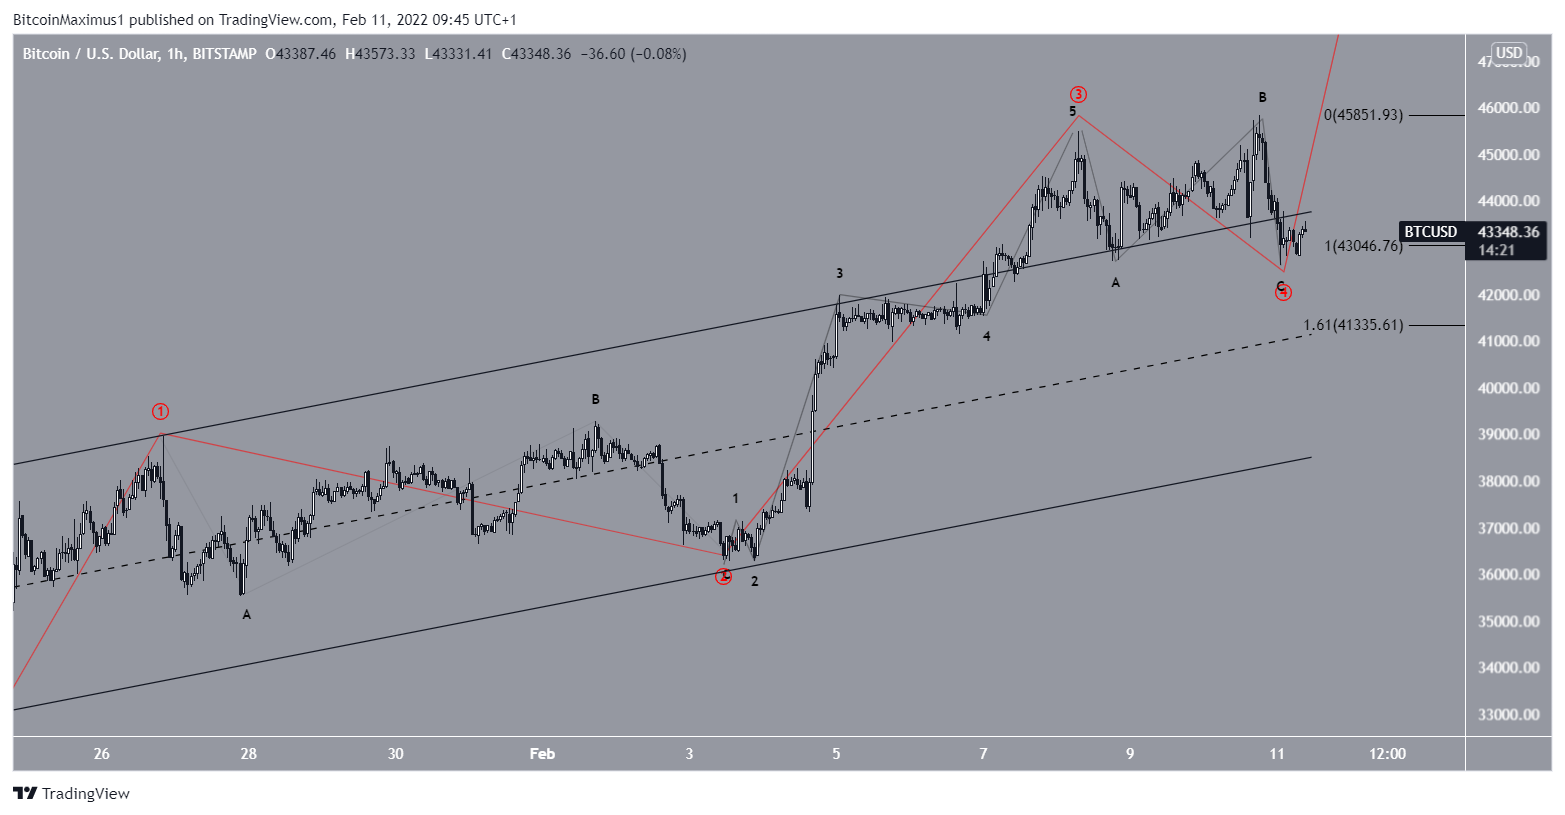
The most likely long-term wave count indicates that BTC has already reached a bottom.
As for the short-term count, it seems that BTC is in wave four of a five-wave upward move (red). The sub-wave count is shown in black.
The increase made on Fed 10 and the subsequent fall suggests that the wave took the shape of a flat correction.
So far, sub-waves A and C have had an exact 1:1 ratio, which is most common in such structures.
The next most common ratio is 1:1.61. This would lead to a low of $41,335, also tagging the midline of the channel and the aforementioned 0.5 Fib retracement support level.
For BeInCrypto’s previous Bitcoin (BTC) analysis, click here
Disclaimer
In line with the Trust Project guidelines, this price analysis article is for informational purposes only and should not be considered financial or investment advice. BeInCrypto is committed to accurate, unbiased reporting, but market conditions are subject to change without notice. Always conduct your own research and consult with a professional before making any financial decisions. Please note that our Terms and Conditions, Privacy Policy, and Disclaimers have been updated.
