

Bitcoin (BTC) increased slightly on Sept 29 but failed to sustain its upward movement. However, it moved above $43,000 on Sept 30 before dropping back slightly.
BTC has broken out from a short-term descending resistance line and is in the process of moving towards the next closest resistance area.
BTC attempts to reclaim resistance
BTC is currently attempting to move above the $44,000 area, which previously acted as support but has now turned to resistance.
Technical indicators in the daily time frame are showing some bullish signs, such as the higher momentum bar in the MACD. However, the RSI is still below 50 and the MACD is still negative.

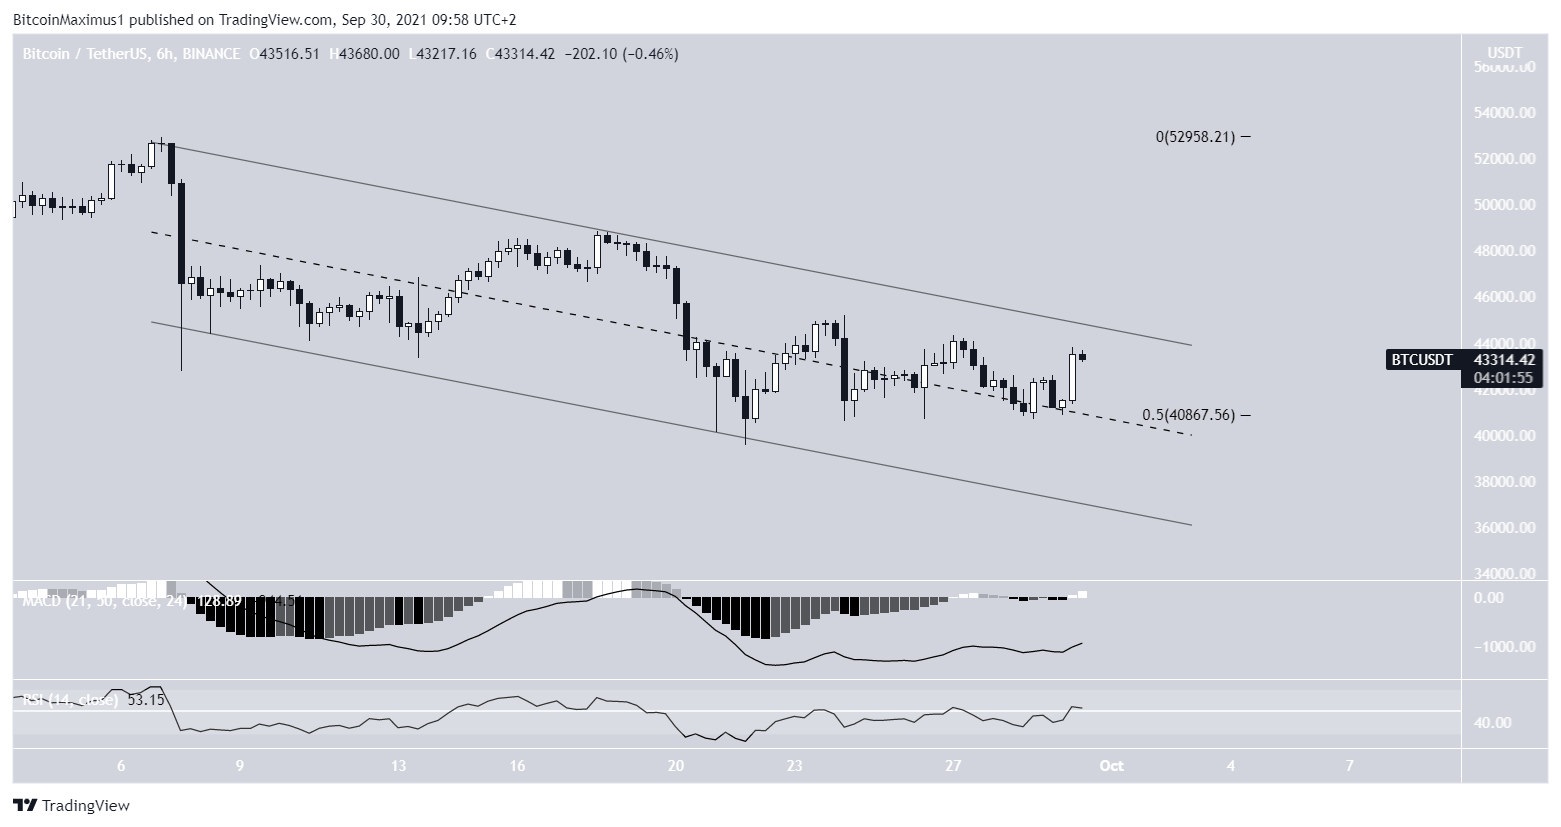
Descending channel
The six-hour chart shows that BTC is trading inside a descending parallel channel since the initial drop on Sept 7.
Currently, it’s trading in the upper portion of the channel after bouncing at its midline and the 0.5 Fib retracement support level.
Furthermore, the MACD and RSI are both moving upwards. When combined with the fact that parallel channels usually contain corrective structures, a breakout would be the most likely scenario.
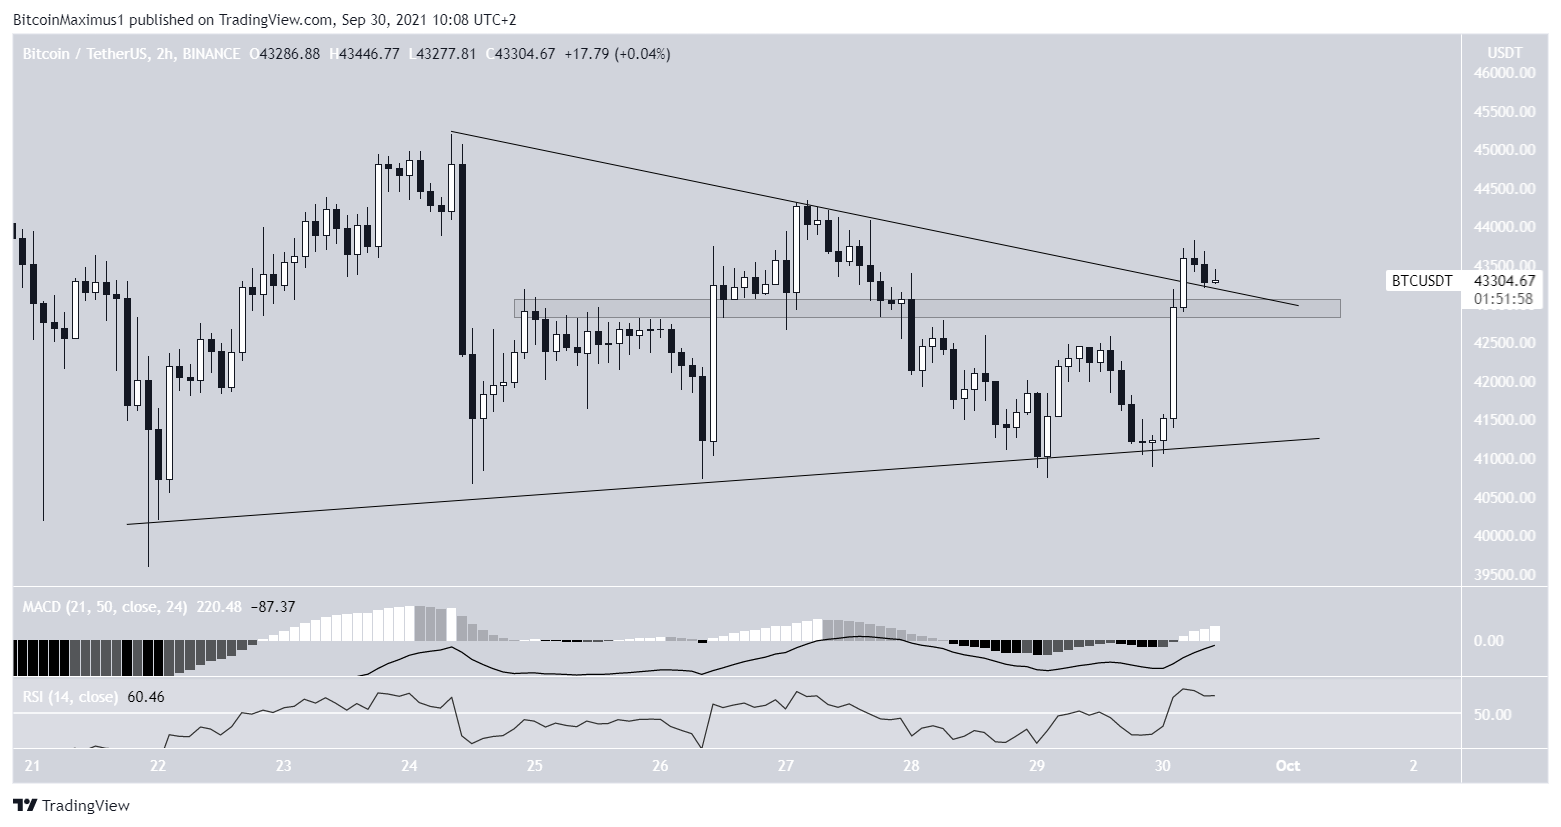
The two-hour chart shows that BTC has already broken out from a descending resistance line, which was part of a symmetrical triangle.
Furthermore, it has reclaimed the minor $43,000 resistance area and is in the process of validating it as support.
The upward move is supported by both the RSI and MACD.
Therefore, it’s likely that BTC will increase in the short term.
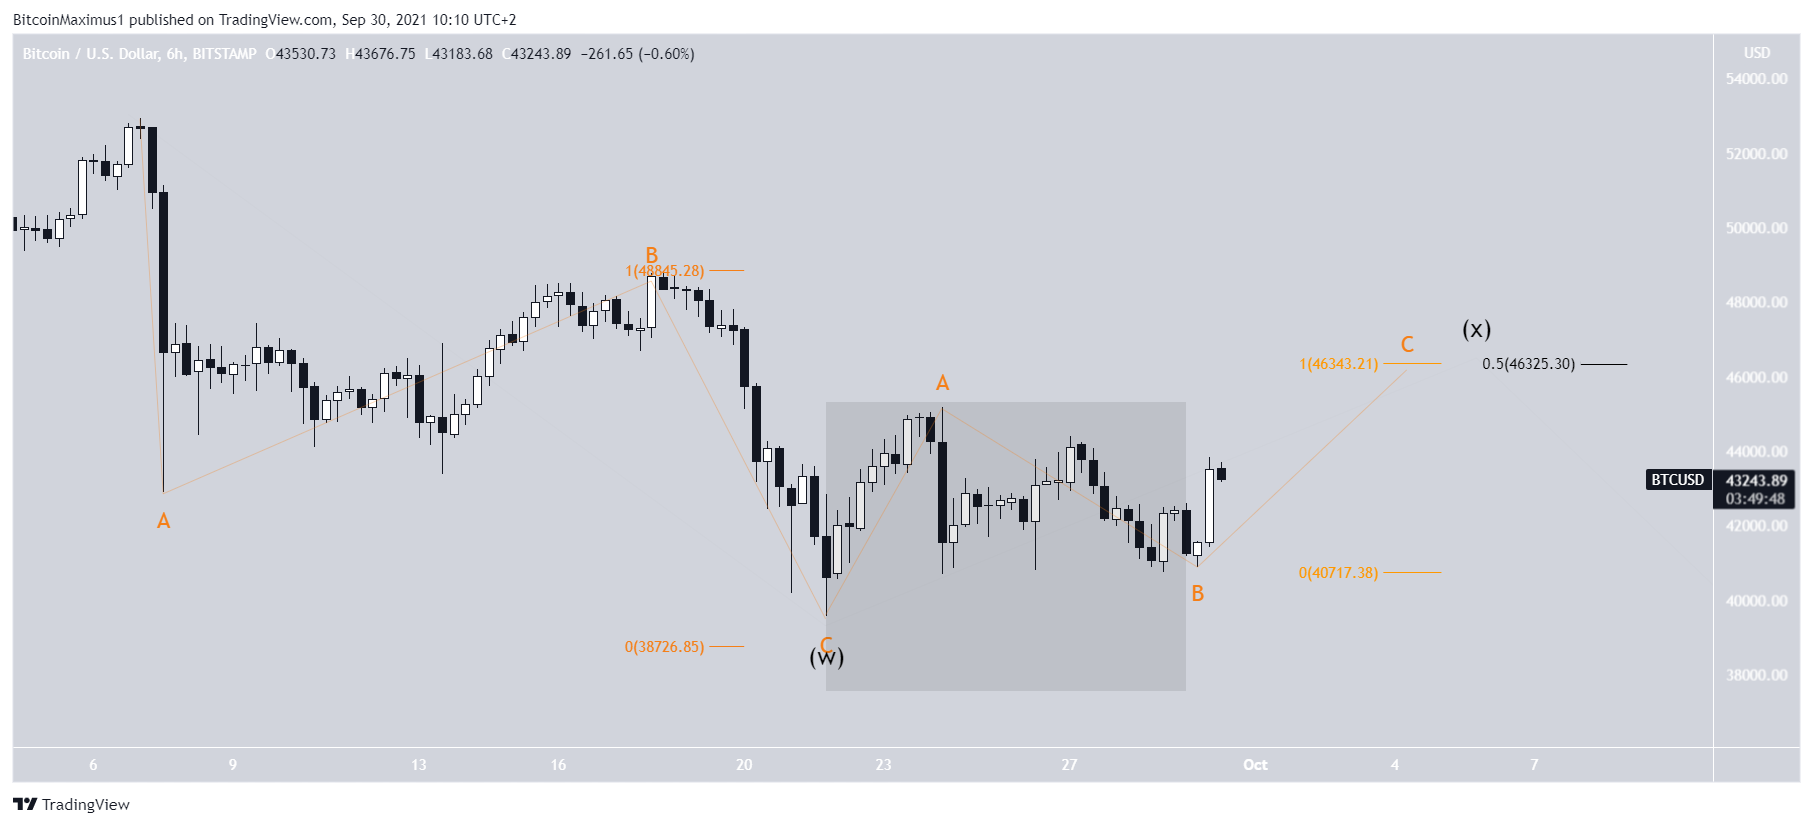
Wave count
The most likely count suggests that the current decrease is an A-B-C corrective structure (orange), in which waves A:C have a 1:1 ratio. However, since the upward move does not look impulsive, it does not seem like the correction is complete.
Therefore, it would make sense that BTC is still in a complex corrective structure and is currently in the X wave (black).
An increase to $45,550 would reach the 0.5 Fib retracement resistance level of the entire downward move and would give the short-term waves A:C a 1:1 ratio.
Therefore, it would be likely that BTC gets rejected if it makes it to $45,550.
For BeInCrypto’s previous Bitcoin (BTC) analysis, click here.
Trusted
Disclaimer
In line with the Trust Project guidelines, this price analysis article is for informational purposes only and should not be considered financial or investment advice. BeInCrypto is committed to accurate, unbiased reporting, but market conditions are subject to change without notice. Always conduct your own research and consult with a professional before making any financial decisions. Please note that our Terms and Conditions, Privacy Policy, and Disclaimers have been updated.
