

While bitcoin (BTC) reached a new all-time high of $67,000 during the week of Oct 18-22, it decreased slightly over the weekend. The closing price for the week was roughly $800 lower than the opening.
In the weekly time frame, there are mixed signs between technical indicator readings and the price action. Most technical indicators are bullish, but price action still appears to be bearish.
BTC is still below an ascending support line that had previously been in place since the beginning of the upward move that began in March 2020. After breaking down in June, BTC was twice rejected by this resistance line (red icons). The failure to reclaim the line is a bearish sign, which suggests that it could now potentially act as resistance.
Despite this occurrence, technical indicators are bullish.
The MACD, which is created by a short and long-term moving average is positive and moving upwards. This means that the short-term trend is moving faster than the long-term trend.
Furthermore, the RSI is above 50 and moving upwards. This is also a sign of a bullish trend since RSI readings above 50 are considered bullish.
Finally, the Supertrend line is bullish (green circle). The Supertrend is an indicator that makes use of volatility to determine the direction of the trend. Since the BTC price is above the line, the trend is considered bullish.

Potential double top
A closer look reveals a potential double top pattern forming. The double top is often considered a bearish pattern, meaning that a bearish trend reversal could follow.
Furthermore, the second top has a long upper wick and resembles a shooting star candlestick (red icon). This is also a bearish candlestick pattern, which shows that sellers are in control since they pushed the price down below the week’s opening and created a long upper wick.
The validity of the pattern depends on whether the weekly close (rectangle) or the absolute high (line) is used. In the case of the weekly close, the movement looks like a bullish retest of support. In the case of the absolute high, it resembles a double top pattern.
Therefore, there are ambiguous signs in the price movement on the weekly chart.

BTC support
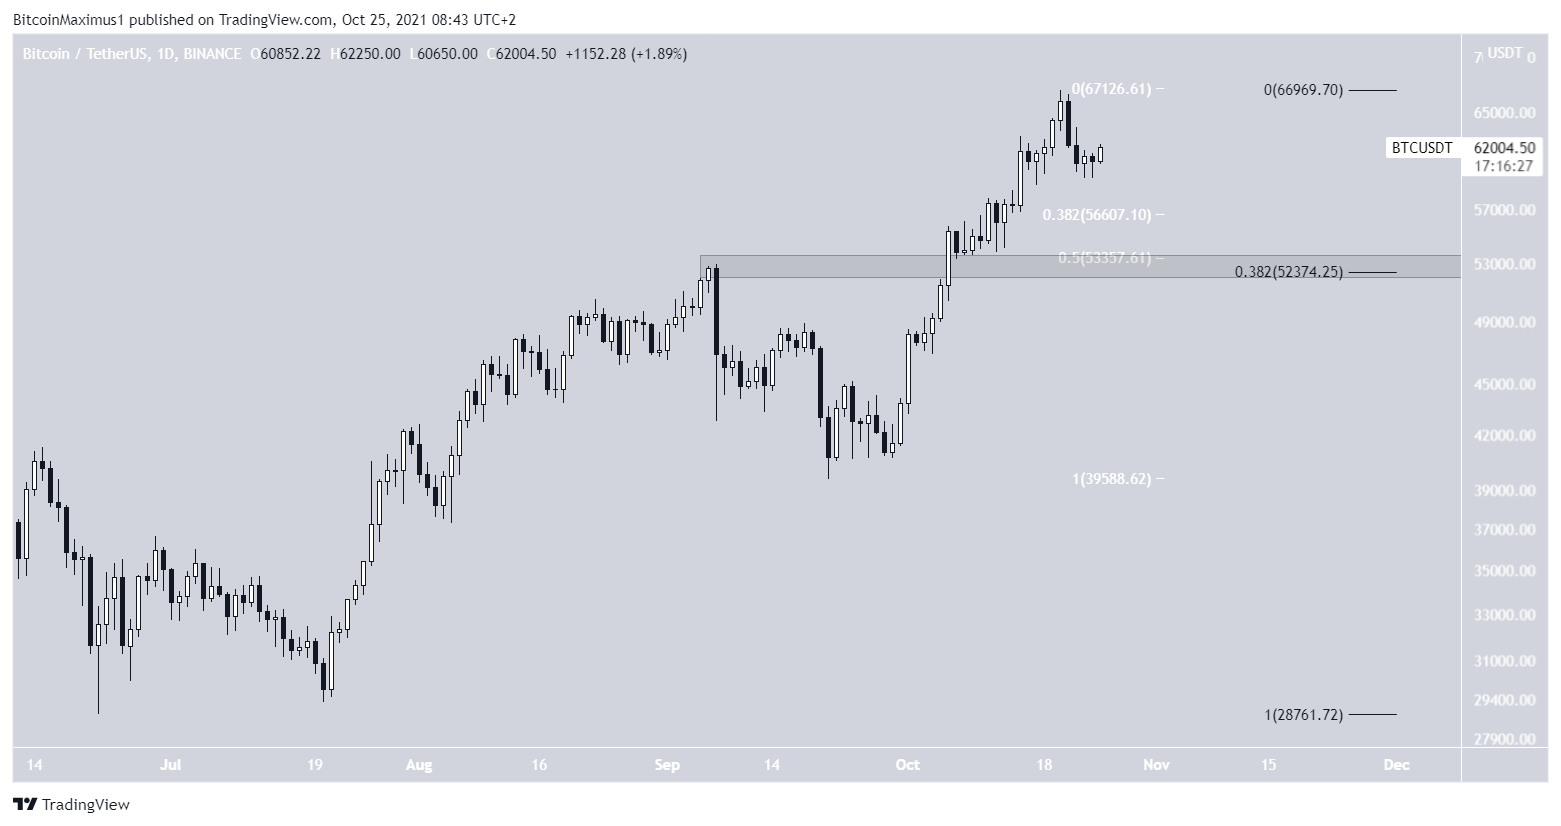
The support levels are more clearly visible in the daily time frame.
The first is found at $56,550. This is the 0.382 Fib retracement support level when measuring the most recent portion of the upward move (highlighted).
If the area does not hold, the second support area is found between $52,300 and $53,300. This range is the 0.5 Fib retracement level when measuring the same portion of the upward movement, and the 0.382 Fib retracement level when measuring the entire upward movement since June 22. In addition to this, the range is a horizontal support area made up of a confluence of supports and previous resistances.
Wave count
There are two potential wave counts at play. The first suggests that BTC is in wave three of a bullish impulse, while the second shows BTC in wave two. A bullish impulse is created by five waves, three of which move upward.
The first count is more bullish since it shows that BTC is in a 1-2/1-2 wave formation. This is a type of formation in which the increase accelerates as the movement goes on. In it, BTC is in wave three (white). The sub-wave count is shown in orange, identifying BTC in sub-wave two. This could likely lead to a dip to the previously outlined $52,300-$53,300 support zone.

The second count is slightly more bearish, suggesting that BTC is still in wave two (white) of the same bullish impulse.
In this case, the correction would be expected to be sharper, potentially falling all the way to $47,700 or $43,100. These are the 0.5 and 0.618 Fib retracement support levels and a horizontal support area.

For BeInCrypto’s previous Bitcoin (BTC) analysis, click here.
Trusted
Disclaimer
In line with the Trust Project guidelines, this price analysis article is for informational purposes only and should not be considered financial or investment advice. BeInCrypto is committed to accurate, unbiased reporting, but market conditions are subject to change without notice. Always conduct your own research and consult with a professional before making any financial decisions. Please note that our Terms and Conditions, Privacy Policy, and Disclaimers have been updated.
