

Bitcoin (BTC) attempted to move above the $63,530 resistance area on Nov 2 but was rejected. It’s currently in the process of finding support before potentially making another breakout attempt.
BTC has been moving upwards since Oct 28, when it bounced at the 0.382 Fib retracement support level at $56,550 (green icon). So far, it has reached a high of $64,270 on Nov 2.
The increase on Nov 2 was especially significant since BTC created a bullish candlestick and the highest close since the all-time high price on Oct 20.
However, despite the upward move, technical indicators have yet to turn bullish.
The MACD, which is created by short and long-term moving averages (MA), is still decreasing. Moreover, it has generated 13 successive lower histogram bars. This means that the short-term trend is still decelerating. However, it’s still in positive territory, indicating that the short-term MA is still moving faster than the long-term one.
Similarly, the RSI is decreasing but is still above 50. The RSI is a momentum indicator, and this reading shows that despite the loss in strength, momentum is still bullish.

BTC breaks out
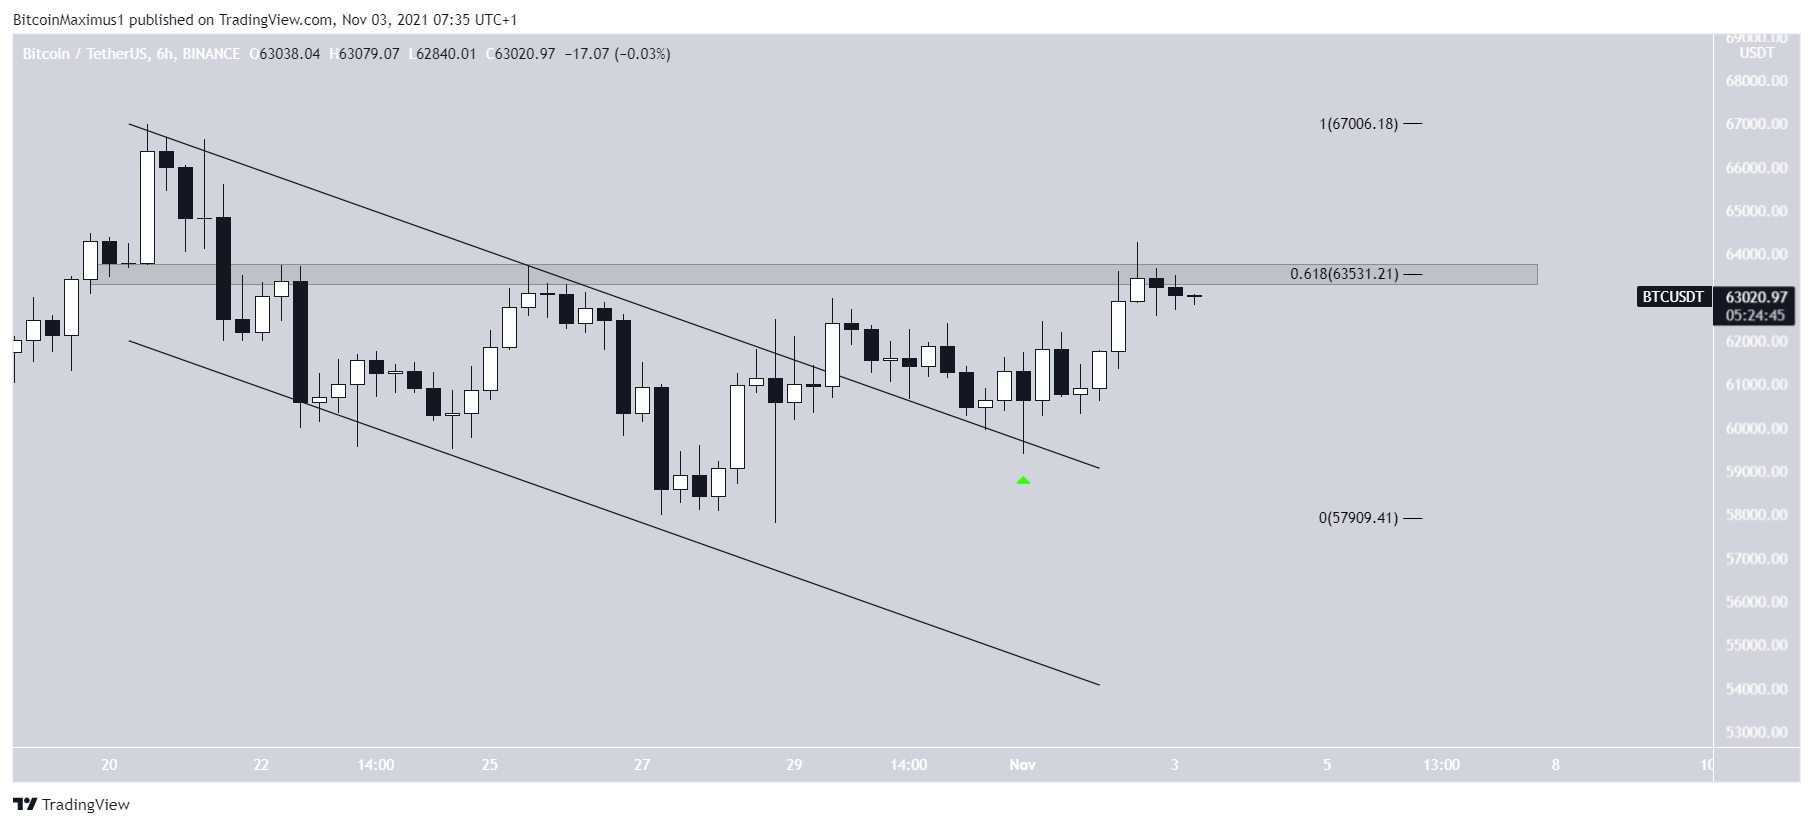
The six-hour chart shows that BTC has broken out from a descending parallel channel and validated it as support after (green icon). This is a very bullish sign that suggests the correction in place since the all-time high has come to an end.
On Nov 2, BTC unsuccessfully attempted to move above the 0.618 Fib retracement resistance level at $63,530. Since the 0.618 Fib level most commonly acts as resistance after price rebounds, a breakout would confirm that the correction is over. The wave count also supports the possibility that BTC will break out.
The two-hour chart provides the three main support areas where BTC would be likely to bounce prior to another attempt at moving upwards.
These supports are found at $62,400, $61,830, and $61,250 — the respective 0.382, 0.5, and 0.618 Fib retracement support levels. The latter also coincides with a potential ascending support line in place since Oct 28. Therefore, due to the confluence of support levels, it’s likely to provide strong support if BTC falls back.

For BeInCrypto’s previous Bitcoin (BTC) analysis, click here.
Trusted
Disclaimer
In line with the Trust Project guidelines, this price analysis article is for informational purposes only and should not be considered financial or investment advice. BeInCrypto is committed to accurate, unbiased reporting, but market conditions are subject to change without notice. Always conduct your own research and consult with a professional before making any financial decisions. Please note that our Terms and Conditions, Privacy Policy, and Disclaimers have been updated.
