

Bitcoin (BTC) has been moving upwards since June 18, but is still trading below crucial resistance levels for both the price action and technical indicators.
BTC has been falling since reaching an all-time high price of $69,000 on Nov 10. The downward movement has so far led to a low of $17,622 on June 18.
This week, the weekly RSI (green circle) reached a new all-time low. While it has increased since, it has yet to move outside of its oversold territory. Additionally, the bearish divergence trendline that has been in place since the beginning of 2021 has yet to be broken.
Another interesting reading is that the price has close below the 200-week moving average (MA) (green) for the second week in a row. While BTC has fallen below this MA several other times, it has never stayed below it for an extended period of time.
The MA is currently at $23,000 and expected to act as resistance. If the price is successful in moving above it, the main resistance area would be at $30,000, a level that had previously acted as support since the beginning of 2021.

Ongoing BTC bounce
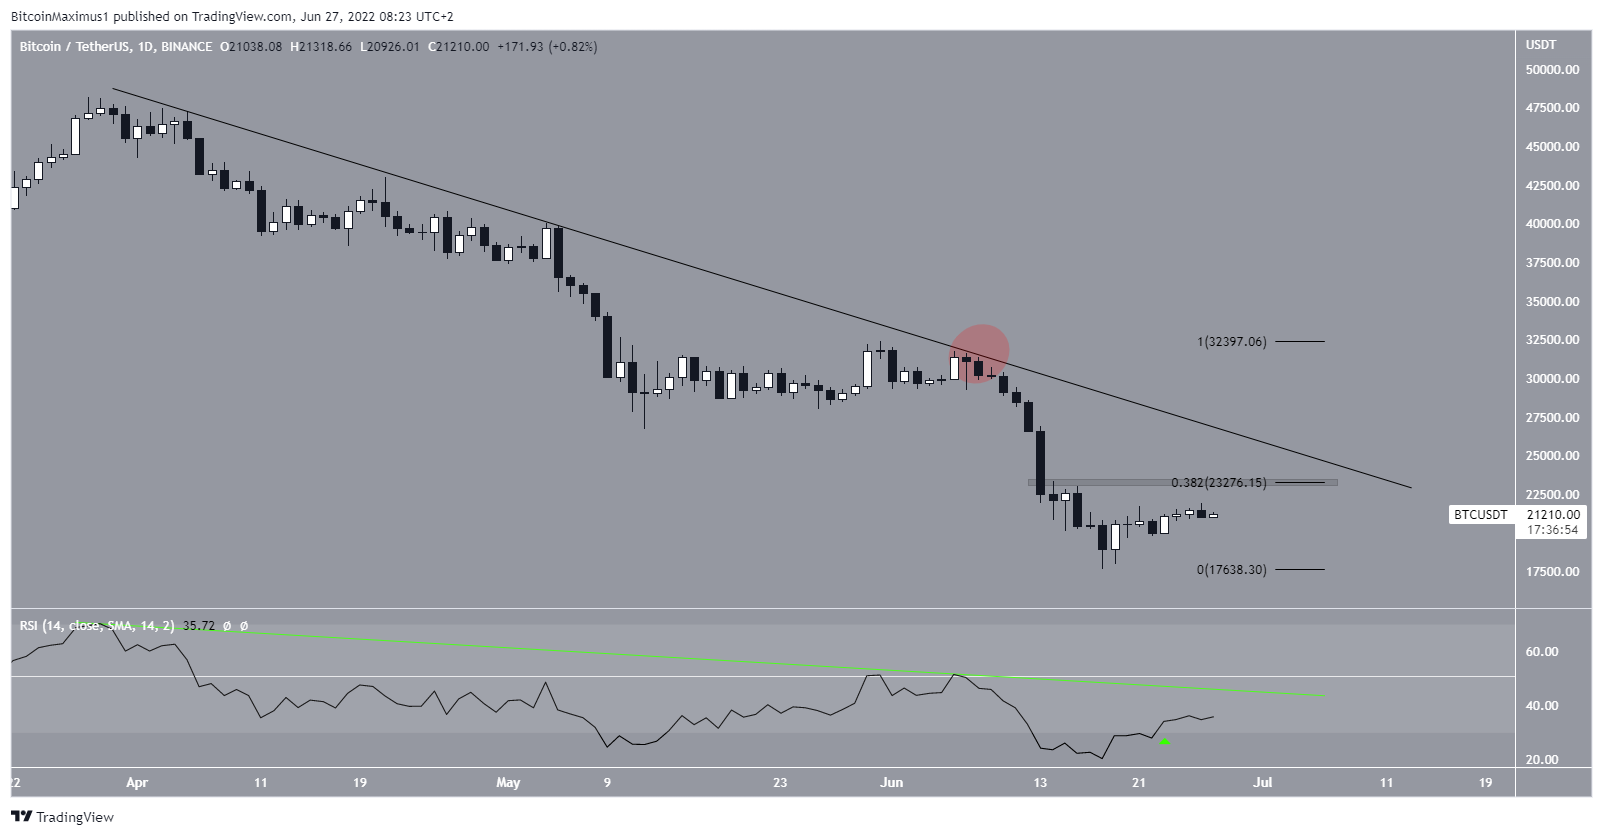
The daily chart shows that the price has been following a descending resistance line since the beginning of April. More recently, the line caused a rejection on June 7 (red circle).
Similarly to the weekly price, the RSI is falling underneath a descending resistance line (green line). The line is currently at 40.
As for the price action, the main resistance area is at $23,275, created by the 0.382 Fib retracement resistance level, which also coincides with the aforementioned resistance line.
A price breakout above this line/area alongside a RSI breakout would be required to confirm the possible bullish trend reversal.
Short-term movement
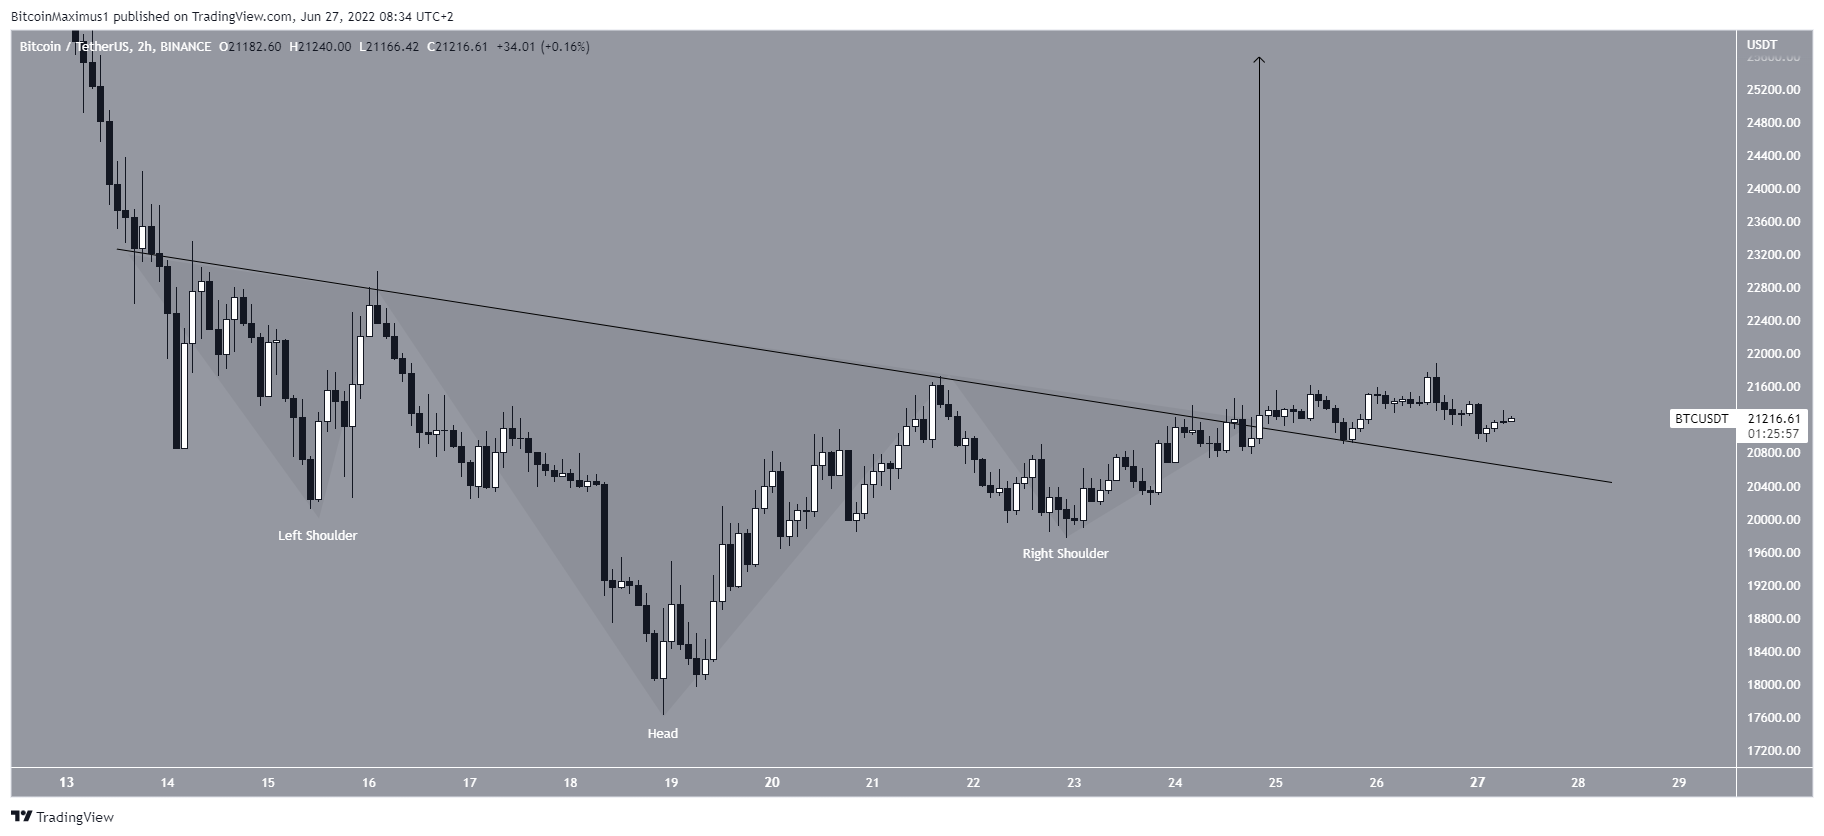
The two-hour chart shows that since June 14, BTC has created what looks like an inverse head and shoulders pattern. This is considered a bullish pattern that usually leads to upward movements.
The price broke from its trendline on June 25 but has increased only gradually since.
An increase that travels the entire height of the pattern would take the price to $25,000. This would cause a breakout from the aforementioned descending resistance line.
For Be[in]Crypto’s previous bitcoin (BTC) analysis, click here
Trusted
Disclaimer
In line with the Trust Project guidelines, this price analysis article is for informational purposes only and should not be considered financial or investment advice. BeInCrypto is committed to accurate, unbiased reporting, but market conditions are subject to change without notice. Always conduct your own research and consult with a professional before making any financial decisions. Please note that our Terms and Conditions, Privacy Policy, and Disclaimers have been updated.
