

Bitcoin (BTC) has broken out from a long-term descending resistance line and is in the process of reclaiming its 200-week moving average (MA).
Throughout its price history, the 200-week MA has acted as the price bottom for bitcoin numerous times (green icon). Additionally, the price did not reach a close below this MA for a sustained period of time. So far, BTC has reached five weekly closes below this MA. Historically, this is the longest period that BTC has spent under the 200-week MA.
Currently, the MA is near $22,700 and bitcoin is attempting to reclaim it. The first attempt is currently ongoing and failure to reclaim could force the price down further.

Ongoing breakout
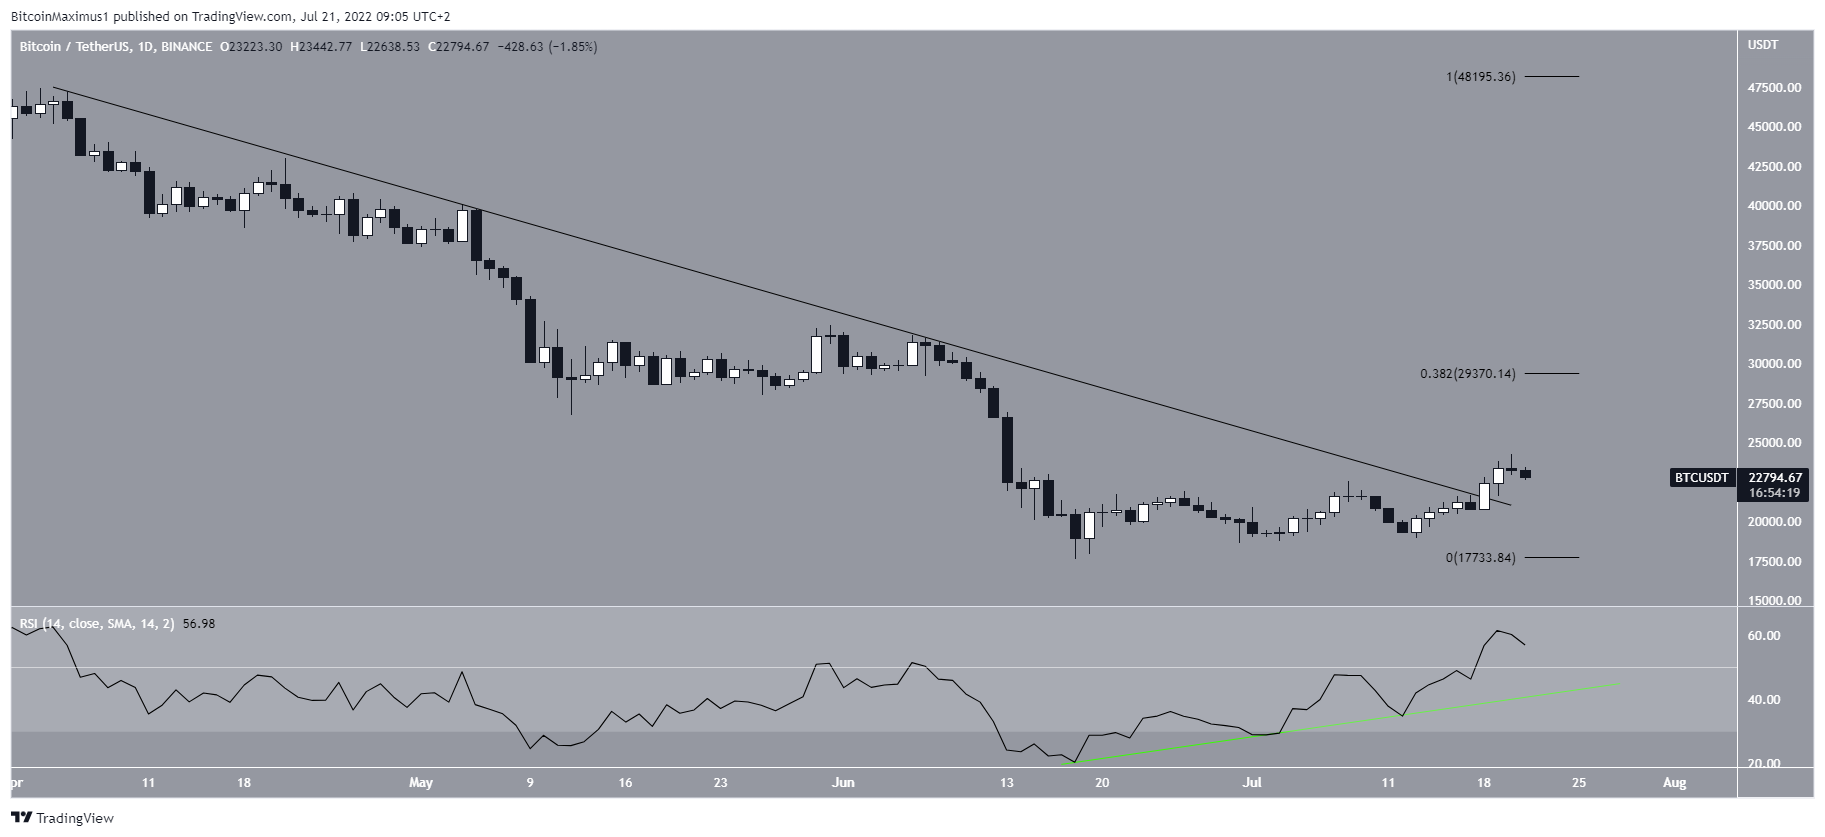
The daily chart indicates that Bitcoin will likely be successful in moving above this MA. There are two prime reasons for this:
- Bitcoin has broken out from a descending resistance line that had been in place since the beginning of April
- The daily RSI has moved above 50 and is following an ascending support line (green)
If the upward move continues, Bitcoin would be expected to reach the 0.382 Fib retracement resistance level near $29,400.
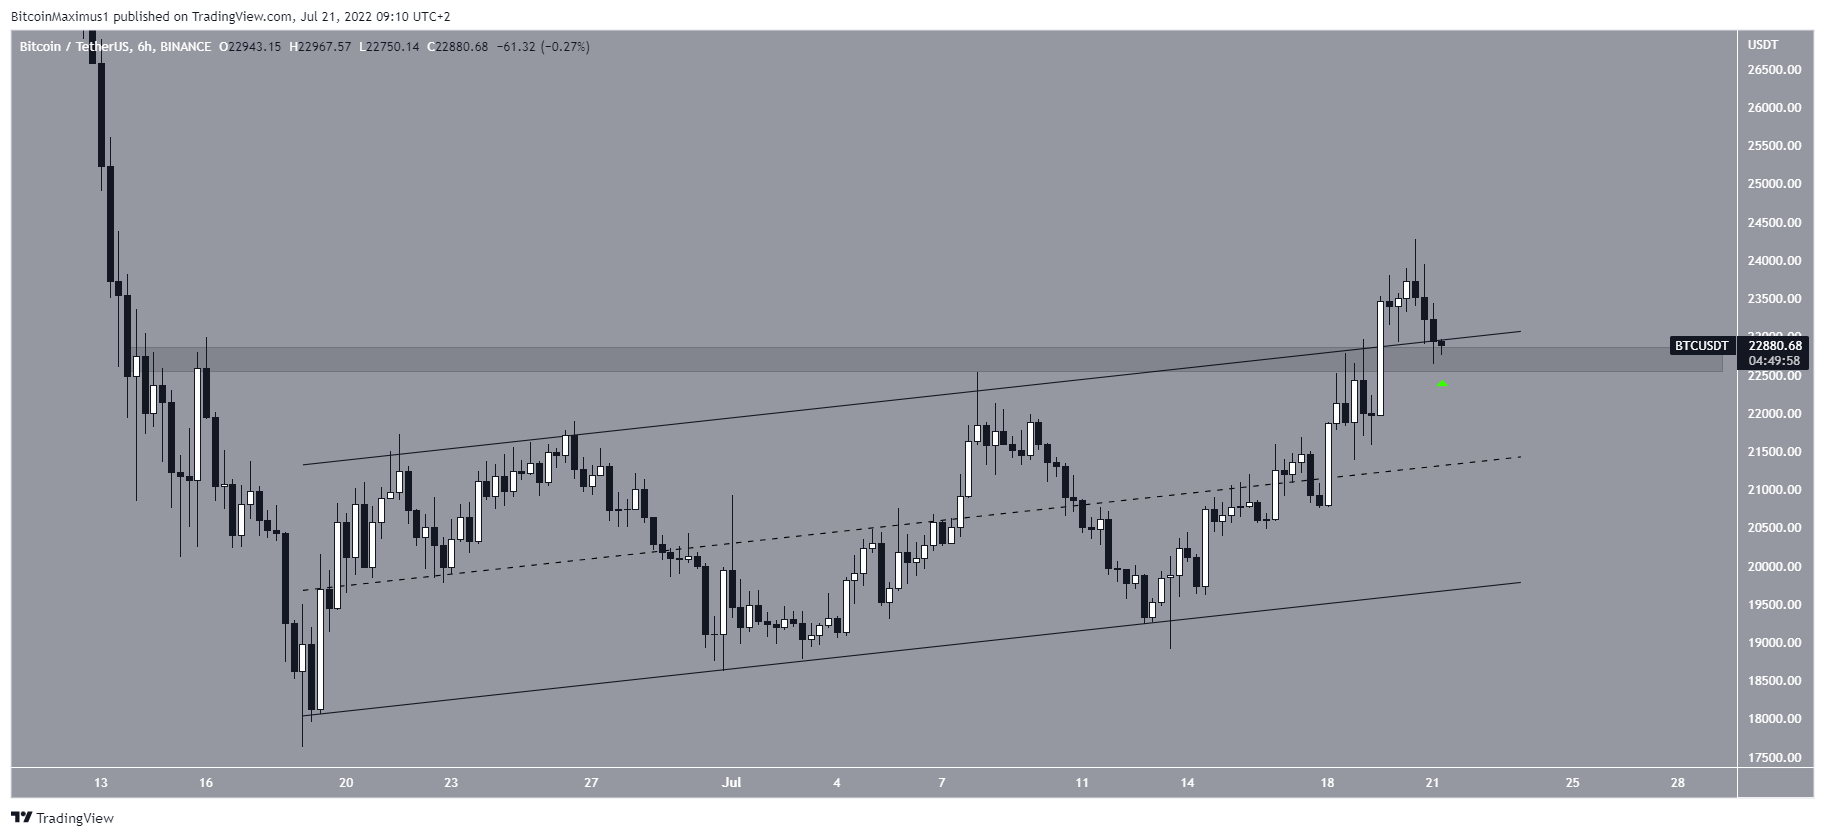
On July 20, the price broke out from a short-term ascending parallel channel and the $22,700 resistance area. However, the decrease that followed caused it to fall back inside the channel and area once again.
If the upward movement is to continue, it’s crucial that Bitcoin quickly moves above the channel confines.
BTC wave count analysis
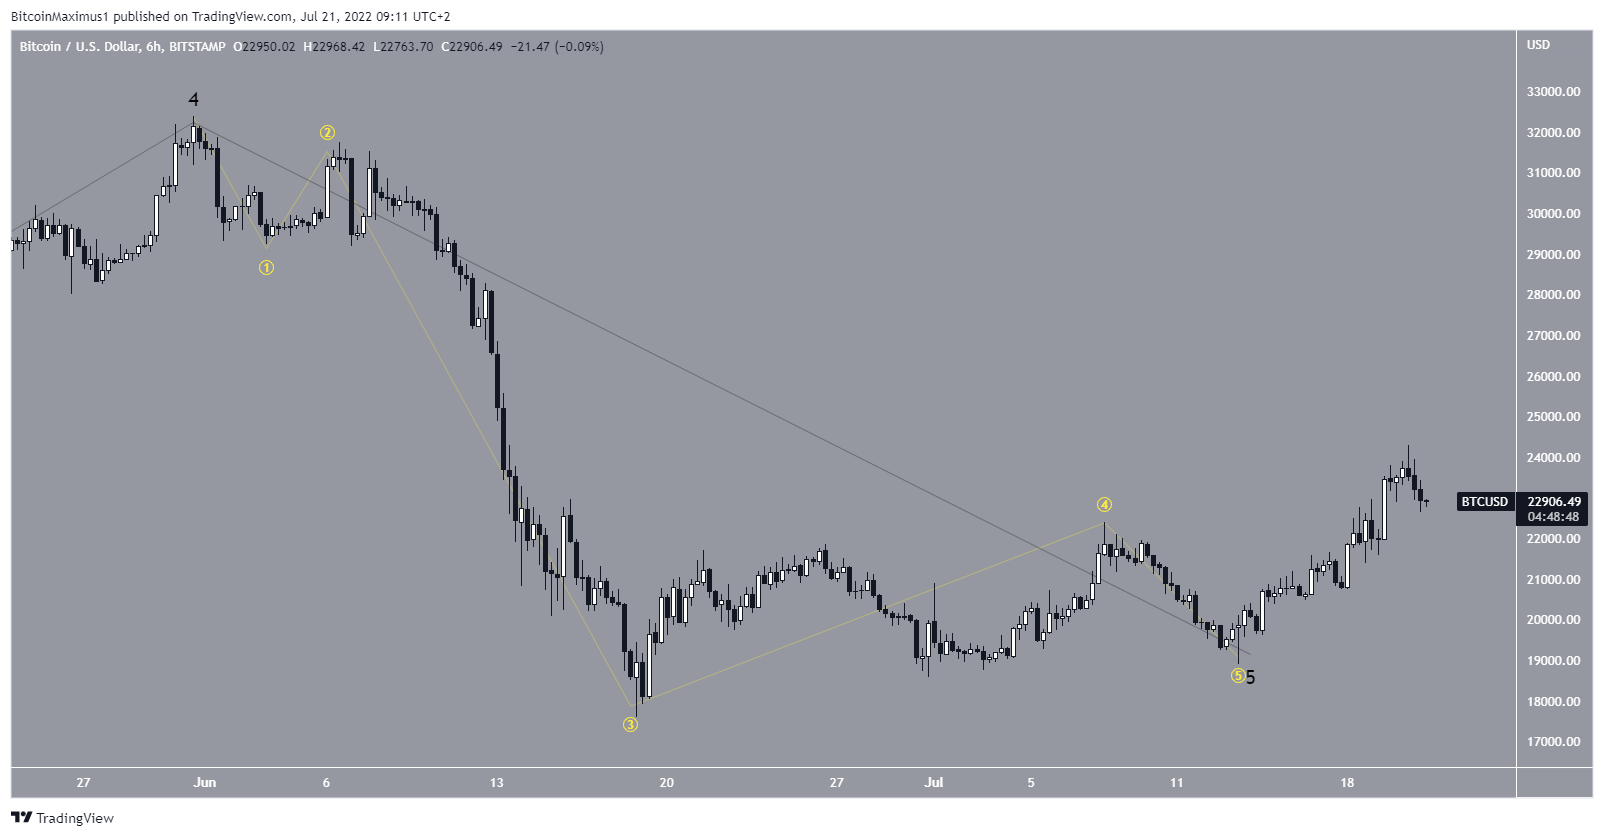
The most likely wave count suggests that BTC has completed the five-wave downward pattern (yellow) that began in April. If this is true, then wave five was truncated as it failed to move below the bottom of wave three.
If the wave count is correct, it could mean that Bitcoin has begun a new upward move that will take it towards the $29,500 resistance area and potentially higher.
For Be[in]Crypto’s previous bitcoin (BTC) analysis, click here
Trusted
Disclaimer
In line with the Trust Project guidelines, this price analysis article is for informational purposes only and should not be considered financial or investment advice. BeInCrypto is committed to accurate, unbiased reporting, but market conditions are subject to change without notice. Always conduct your own research and consult with a professional before making any financial decisions. Please note that our Terms and Conditions, Privacy Policy, and Disclaimers have been updated.
