

Be[in]Crypto takes a look at Bitcoin (BTC) on-chain indicators, focusing this week on the Market-Value-To-Realized-Value (MVRV) and its bounce back into positive territory.
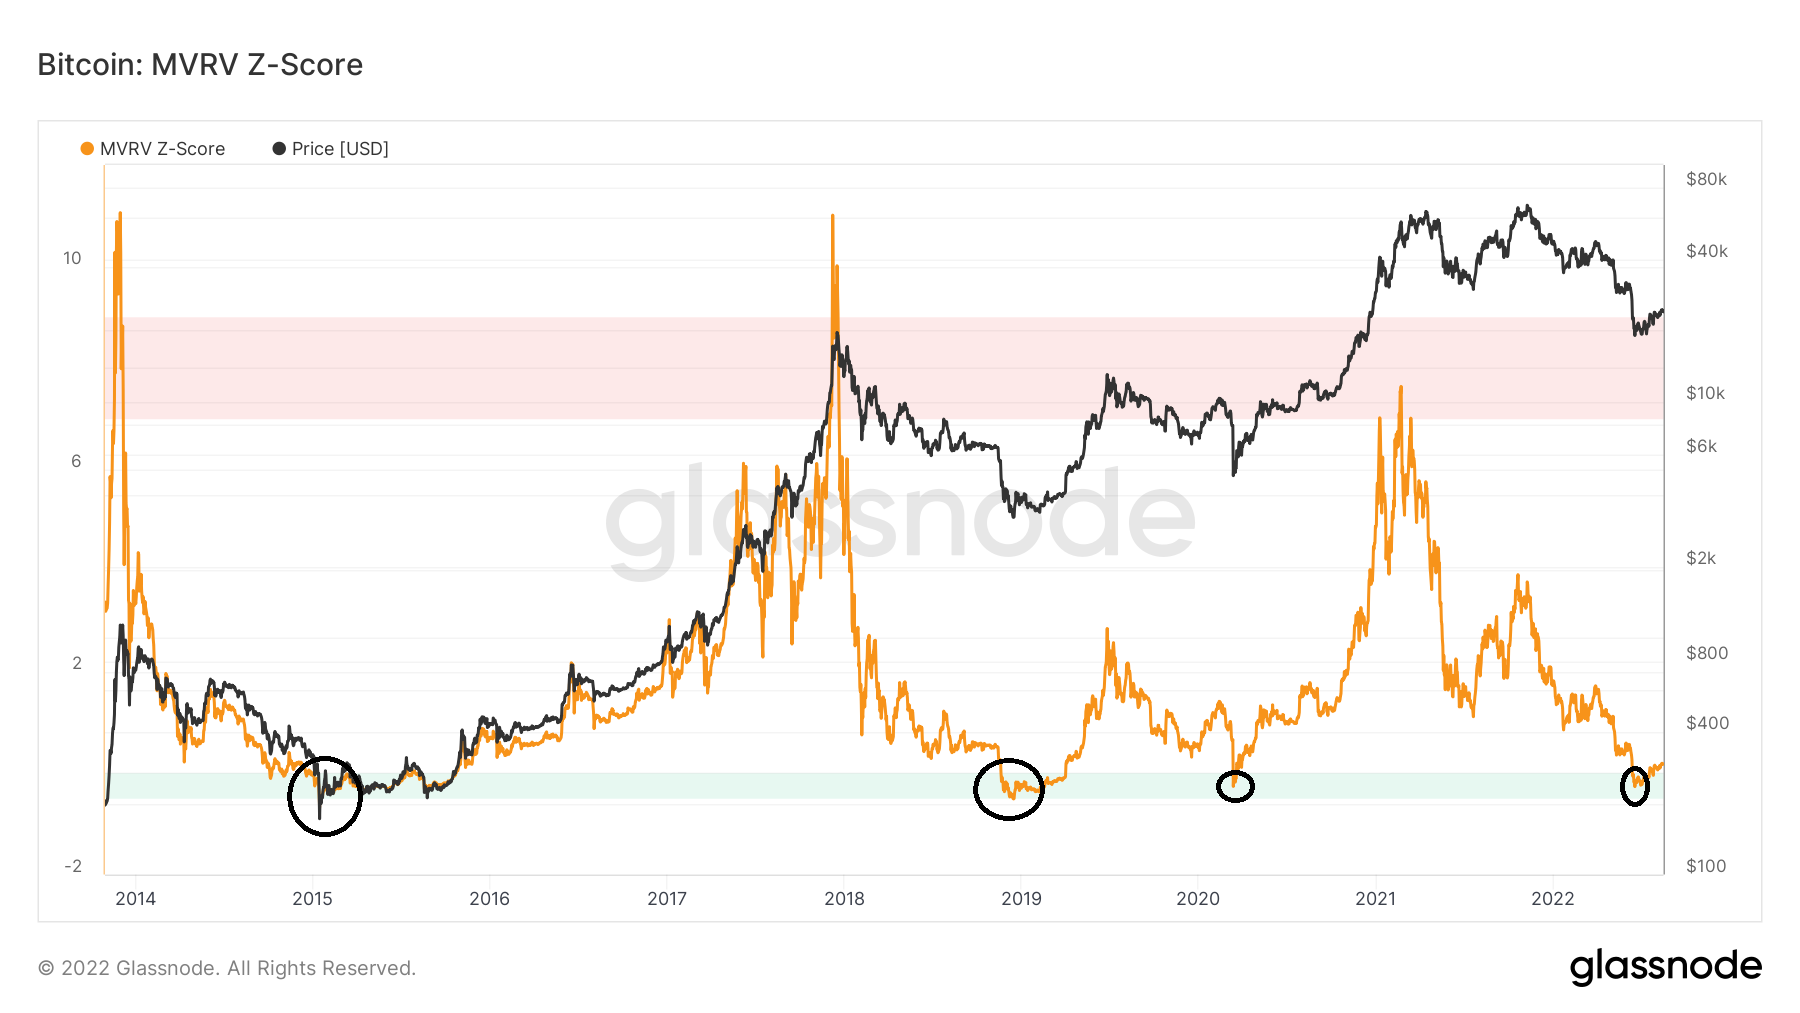
MVRV Z-Score
MVRV is an indicator that measures the ratio between the market and realized capitalization levels. Values above one show that the market cap is larger than the realized cap while those below one show the opposite. Afterward, the MVRV Z-score uses a standard deviation in order to normalize the values.
Historically, values between 7 and 9 have coincided with market cycle tops, while those below 0 with bottoms. The indicator has been decreasing since Feb 2021, when it reached a high of 7.53.
The indicator has fallen into negative territory four times since 2015 (black circles). It did so in:
- Jan 2015
- Dec 2018
- March 2020
- June 2022
Historically, after the indicator moves outside its oversold territory, it confirms that a bottom has been reached. In 2022, it did so on July 20. As a result, if previous history is followed, it would mean that BTC has reached a bottom.
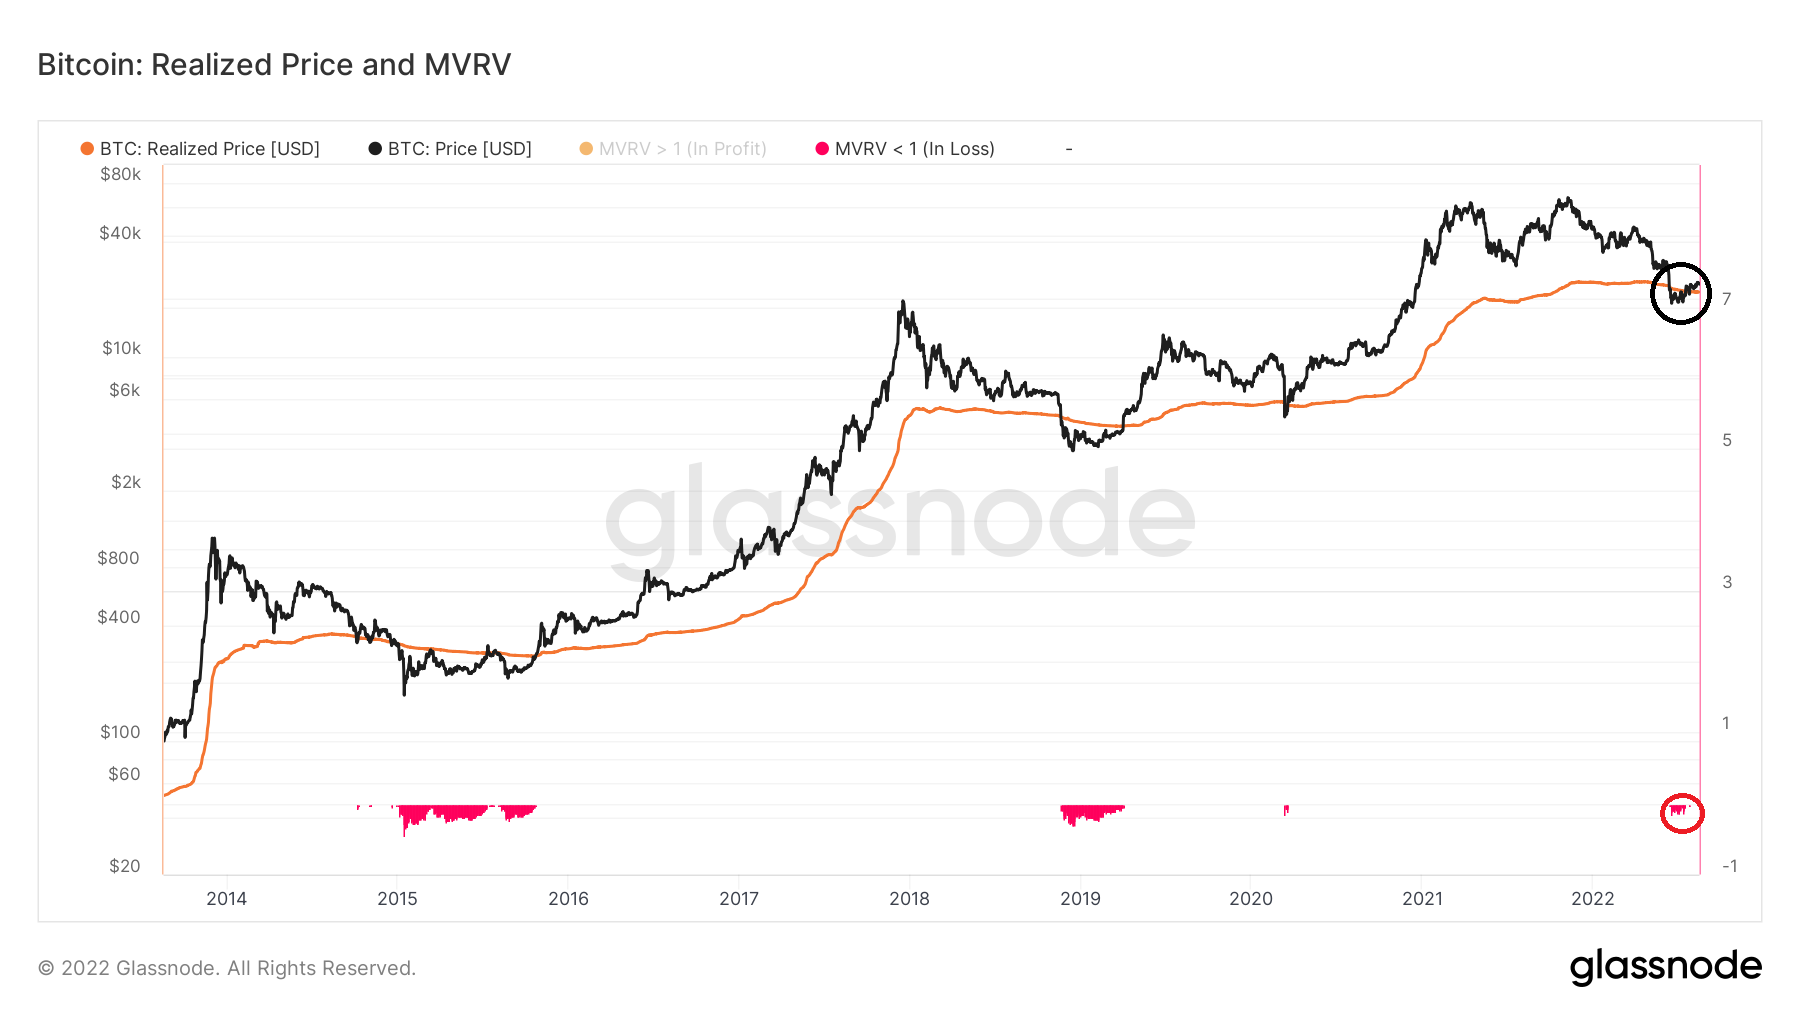
BTC realized price
The movement of the MVRV indicator can be better visualized by using the BTC and its realized price, an indicator that measures the price at the time it last transacted.
While BTC decreased below it, it has now reclaimed its realized price (black circle) which is currently at $21,700. Historically, once the realized price is reclaimed, BTC has never fallen below it prior to initiating a significant bull run.
Additionally, the time in which MVRV was negative (red circle) was roughly 40 days, being longer than in March 2020 but shorter than in Dec 2018 and Jan 2015.
Therefore, these two indicators are in alignment, insinuating that a bottom has been reached.
For Be[in]Crypto’s latest Bitcoin (BTC) analysis, click here
Trusted
Disclaimer
In line with the Trust Project guidelines, this price analysis article is for informational purposes only and should not be considered financial or investment advice. BeInCrypto is committed to accurate, unbiased reporting, but market conditions are subject to change without notice. Always conduct your own research and consult with a professional before making any financial decisions. Please note that our Terms and Conditions, Privacy Policy, and Disclaimers have been updated.
