
On April 13, bitcoin (BTC) broke out above the previous resistance area and managed to reach a new all-time high price.
BTC has continued its ascent today, so far reaching a high of $64,854.
New BTC all-time high
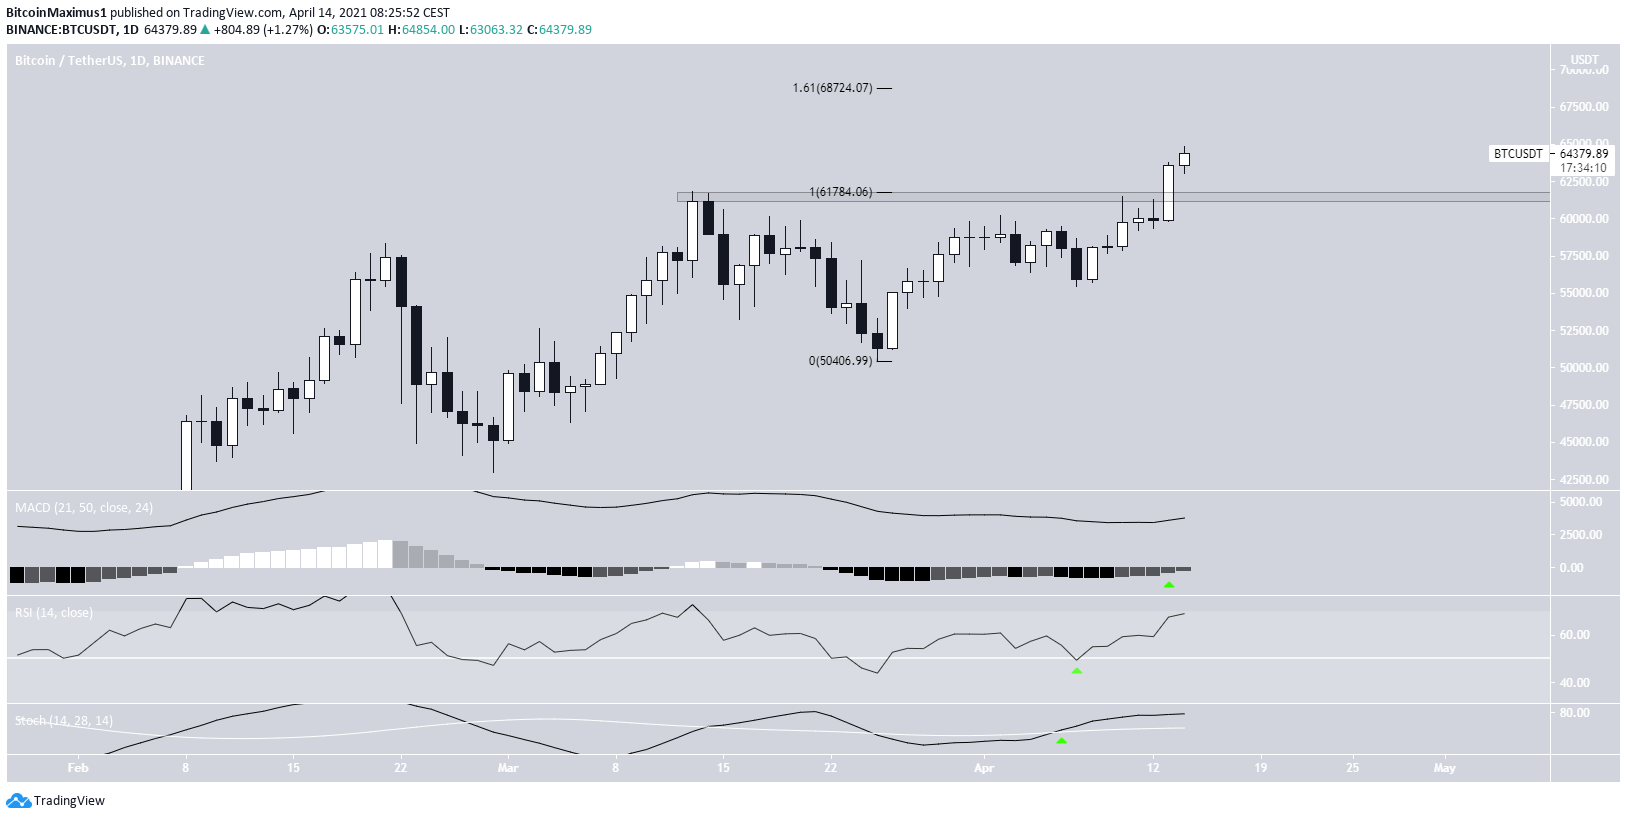
BTC had been struggling to move above the $61,500 resistance area since reaching the level for the first time on March 13.
Yesterday, it finally managed to break out and has reached a new high of $64,854 on April 14.
Technical indicators are bullish and support the continuation of the upward movement. The MACD has given a bullish reversal signal and both the RSI and Stochastic oscillator are increasing. The former is very close to crossing above 70.
The closest resistance area is found at $68,724. It’s found by using the 1.61 external retracement on the most recent drop.
Due to the readings from technical indicators, BTC is expected to reach this level.
Short-term movement
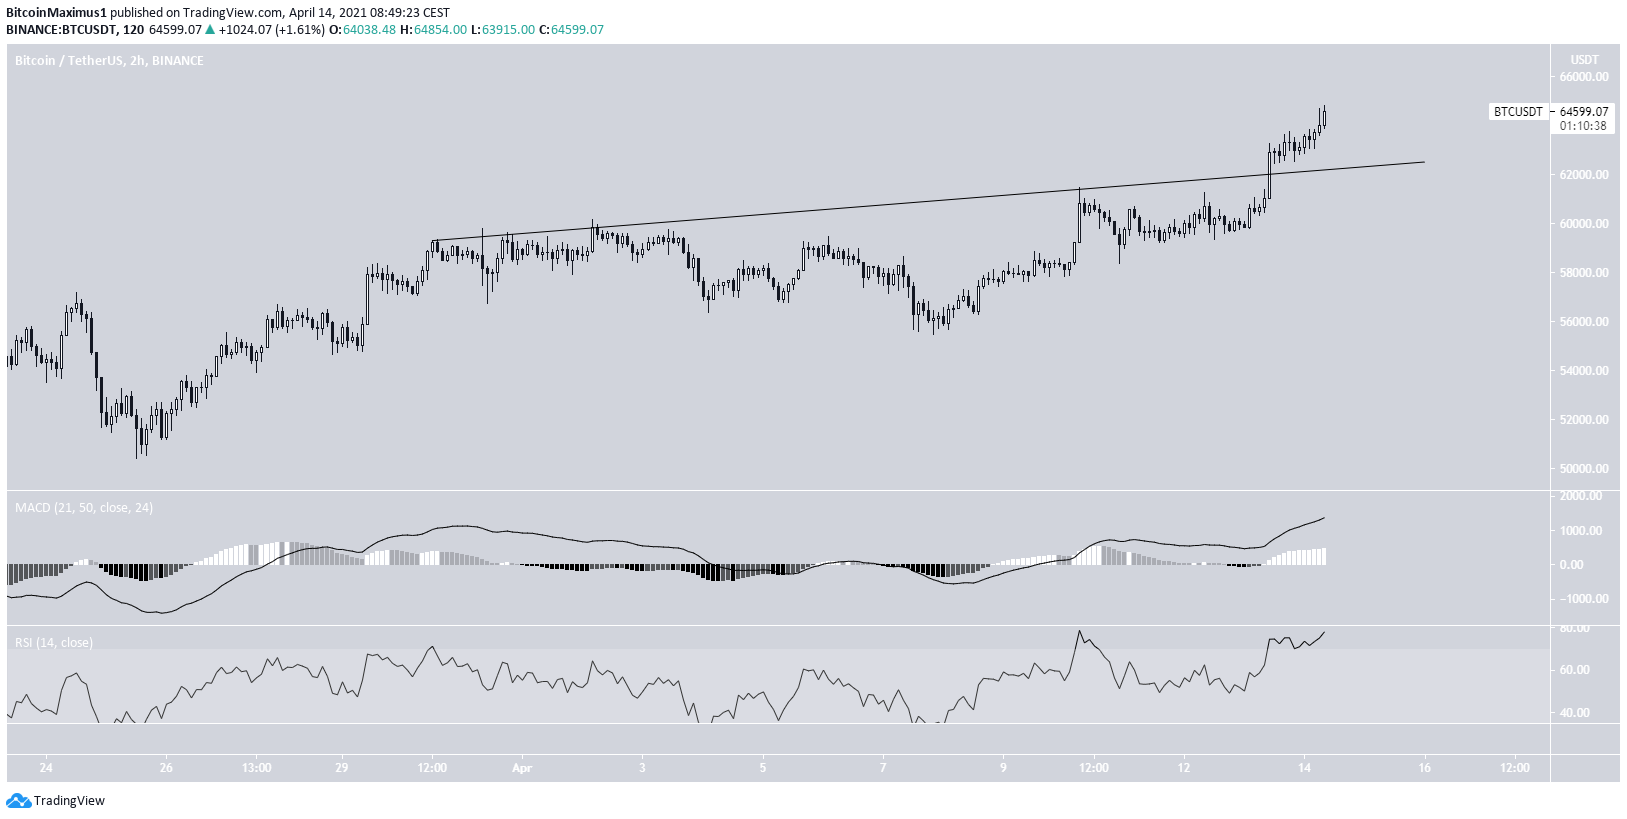
The two-hour chart shows a breakout from an ascending resistance line. After this movement, the BTC increased to the new all-time high.
Neither the MACD nor the RSI show any clear signs of weakness in the form of bearish divergences. Despite this, the latter has reached overbought territory.
Significant increases can still occur inside the overbought region. Therefore, this doesn’t appear to be a cause for concern.
BTC is expected to reach the aforementioned resistance area.
The resistance line from which it broke out from is now likely to act as support.
BTC wave count
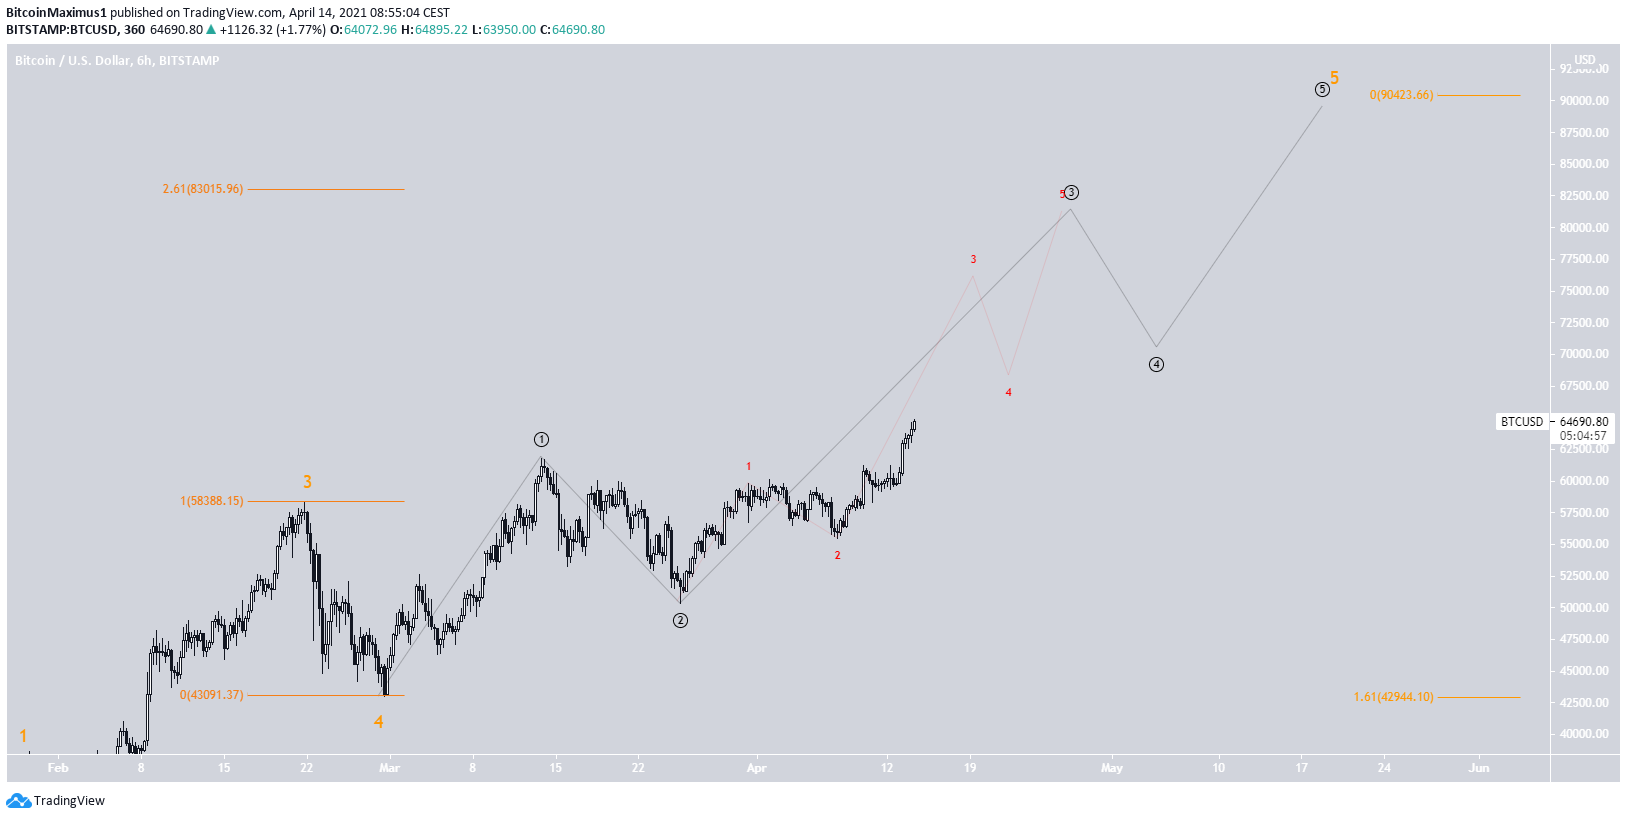
The wave count indicates that BTC is in minor sub-wave three (black) of sub-wave five (orange). The entire move has a target between $83,000-$90,423.
The short-term time-frame count is shown in orange.
For the longer-term count, click here.
After the move is done, a correction is expected.
Conclusion
BTC is likely to continue increasing toward the minor resistance area at $68,724.
In the long-term, an upward move that goes all the way to a high between $83,000-$90,000 is a likely scenario.
For BeInCrypto’s previous bitcoin (BTC) analysis, click here.
Trusted
Disclaimer
In line with the Trust Project guidelines, this price analysis article is for informational purposes only and should not be considered financial or investment advice. BeInCrypto is committed to accurate, unbiased reporting, but market conditions are subject to change without notice. Always conduct your own research and consult with a professional before making any financial decisions. Please note that our Terms and Conditions, Privacy Policy, and Disclaimers have been updated.
