
Bitcoin (BTC) hit new all-time highs on both Dec. 30 and 31. The price briefly hit $29,300 on some exchanges this morning before a small pullback.
The rally has begun to show short-term signs of weakness and BTC is expected to soon reach a top.
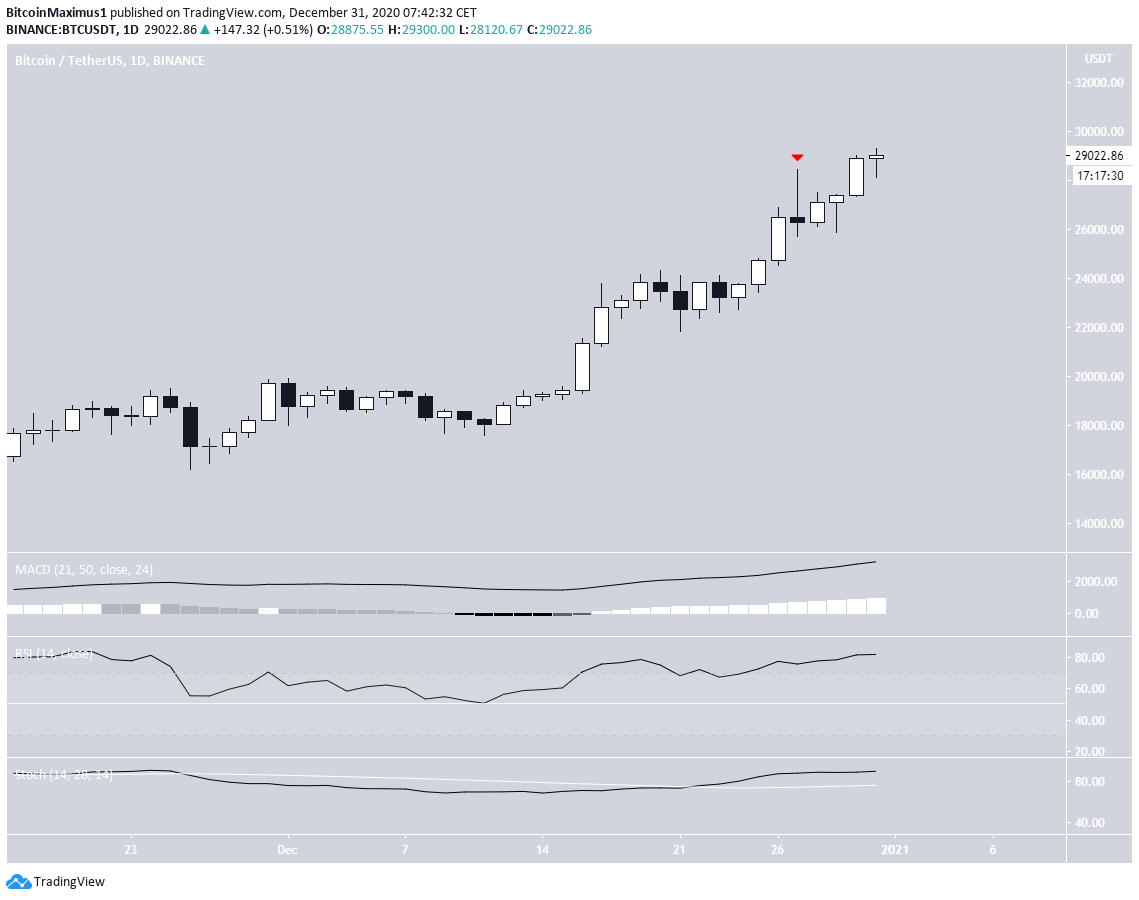
New Bitcoin All-Time High
Bitcoin continued its ascent on Dec. 30, creating a bullish candlestick and reaching a high of $28,996. Yesterday’s close was above that of the shooting star on Dec. 27, a bullish sign that indicates a dissipation of the previous resistance
Technical indicators are bullish and have yet to show any weakness, suggesting that the upward move is expected to continue.
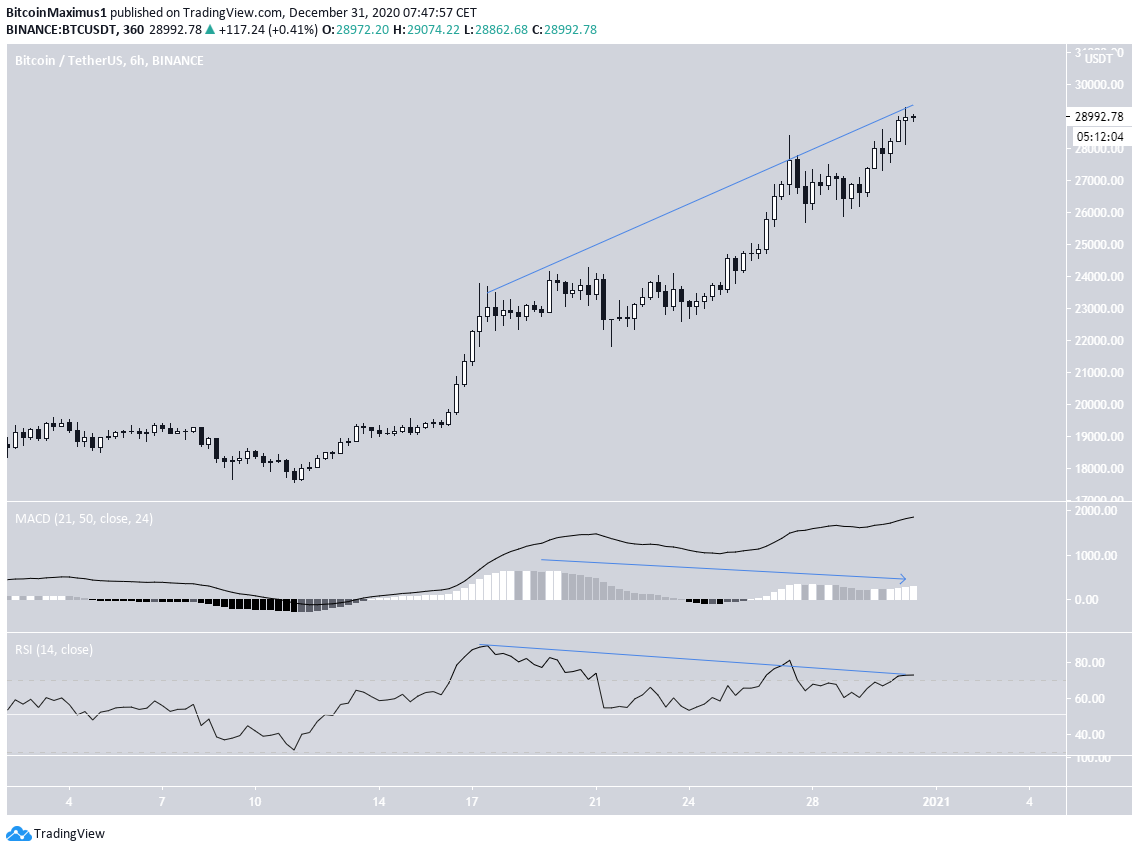
Future Movement
The six-hour chart shows that while BTC has been increasing at an accelerated rate over the past week, there is a very significant bearish divergence developing in both the RSI and the MACD.
This is a sign that the rally may be overextended and a correction is expected.
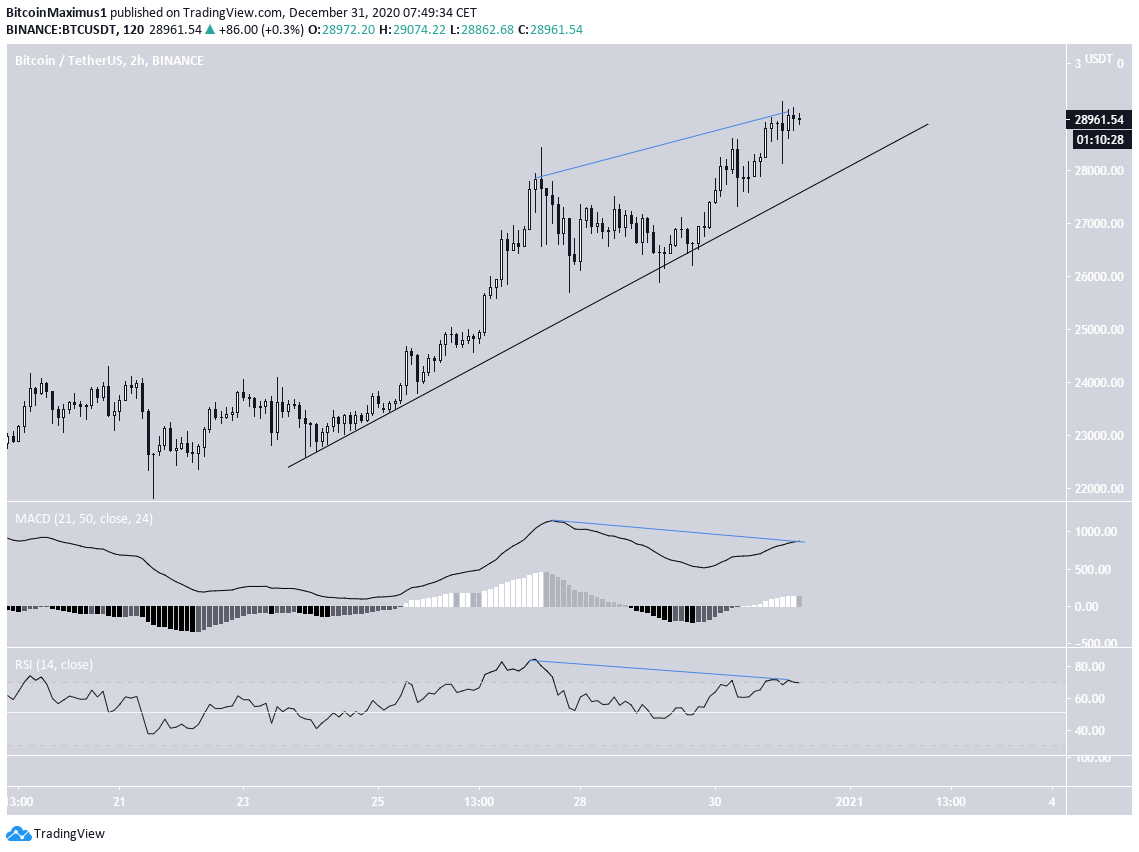
The two-hour chart shows more of the same bearish divergence.
Furthermore, BTC is following a very steep ascending support line, which is unsustainable in the long-run.
If a breakdown from the support line occurs, it’s possible that BTC will undergo a very sharp drop.
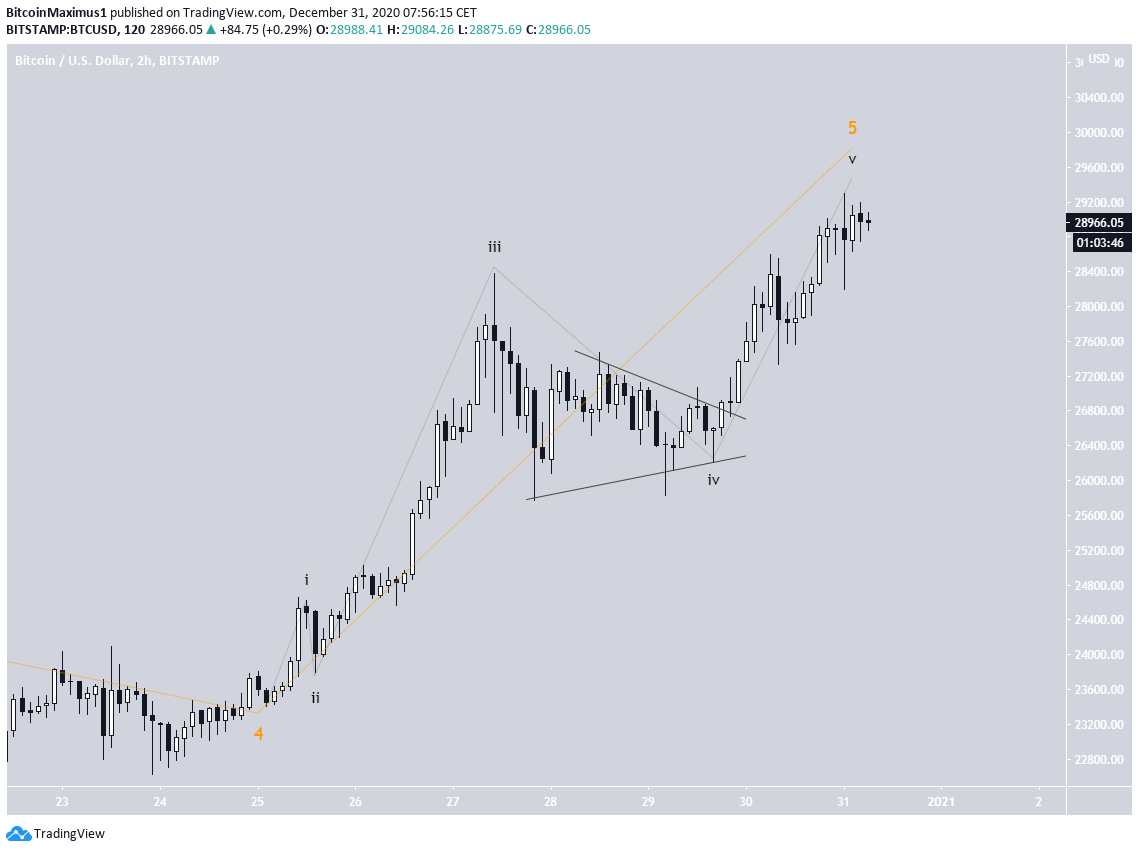
BTC Wave Count
The wave count suggests that BTC is in sub-wave 5 (shown in orange in the image below) of wave 5 (blue).
A possible target for the top of the move is found at $29,800 — the 3.61 Fib extension of sub-wave 5 (orange fib).
Once the correction begins, we would expect the entire move which began in September to be corrected.
In that case, the two most important support areas would be the 0.382 and 0.5 Fib retracement levels, respectively found at $21,838 and $19,538.
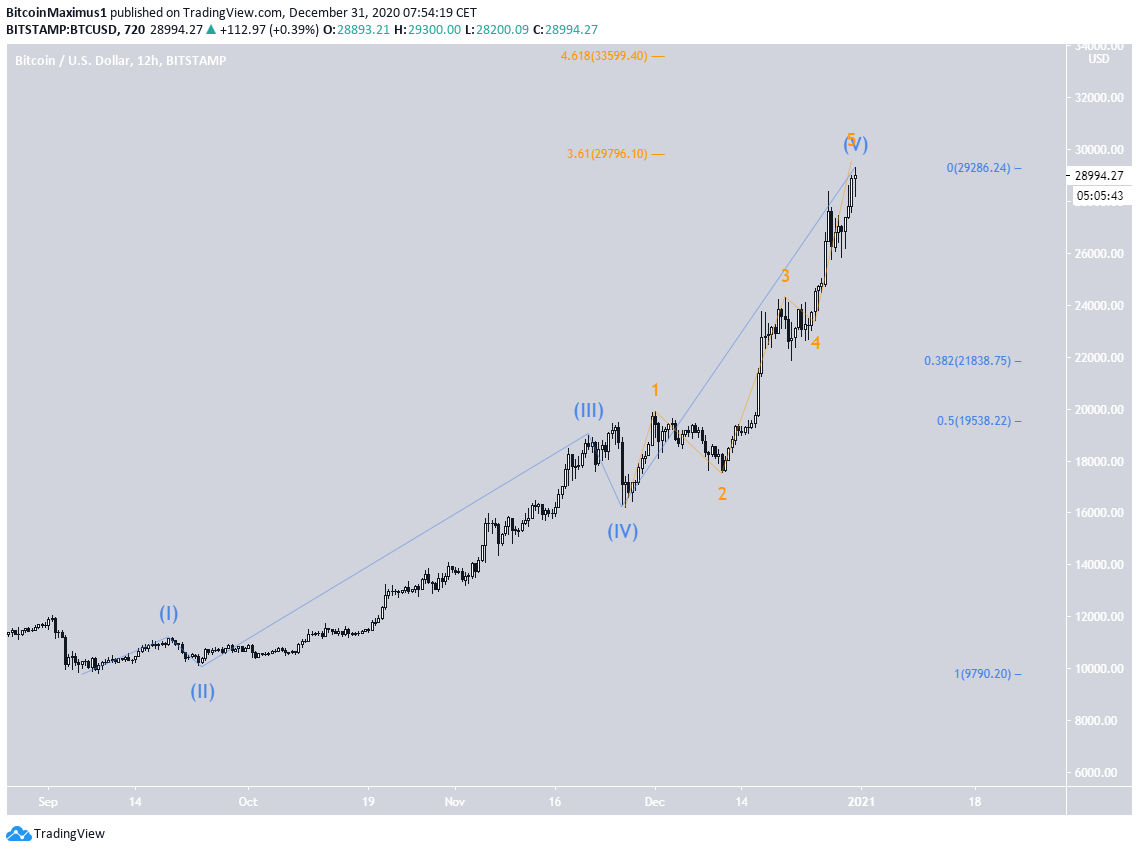
A closer look at the minor sub-wave count (black) shows that BTC is likely in minor sub-wave 5. This is also accentuated by the fourth minor sub-wave triangle, after which BTC moved upwards at a more accelerated rate.
Conclusion
Bitcoin is expected to reach a high near $29,800 before undergoing a significant correction.
For BeInCrypto’s previous Bitcoin (BTC) analysis, click here!
Disclaimer: Cryptocurrency trading carries a high level of risk and may not be suitable for all investors. The views expressed in this article do not reflect those of BeInCrypto.
Trusted
Disclaimer
In line with the Trust Project guidelines, this price analysis article is for informational purposes only and should not be considered financial or investment advice. BeInCrypto is committed to accurate, unbiased reporting, but market conditions are subject to change without notice. Always conduct your own research and consult with a professional before making any financial decisions. Please note that our Terms and Conditions, Privacy Policy, and Disclaimers have been updated.
