

Bitcoin (BTC) is rapidly approaching its final resistance area and is currently less than $2,000 below the all-time high price. While technical readings are still bearish, the wave count indicates that BTC is approaching the top of its upward move.
The daily chart provides a bullish outlook for BTC, which has broken out above the $57,200 resistance. This is the final resistance area prior to a new all-time high and also is the 0.786 Fib retracement resistance level.
Therefore, there is no more resistance until the all-time high of $64,854, which was reached in April 2021.
Technical indicators also paint a bullish picture.
The MACD, which is created by short and long-term moving averages is moving upwards and is positive. This means that the short-term trend is moving faster than the long-term trend and is a positive sign during upward movements.
The RSI, which is a momentum indicator, has moved above 70. This shows that the momentum is clearly bullish, though the trend is getting overbought.
Therefore, the daily chart paints a bullish picture.

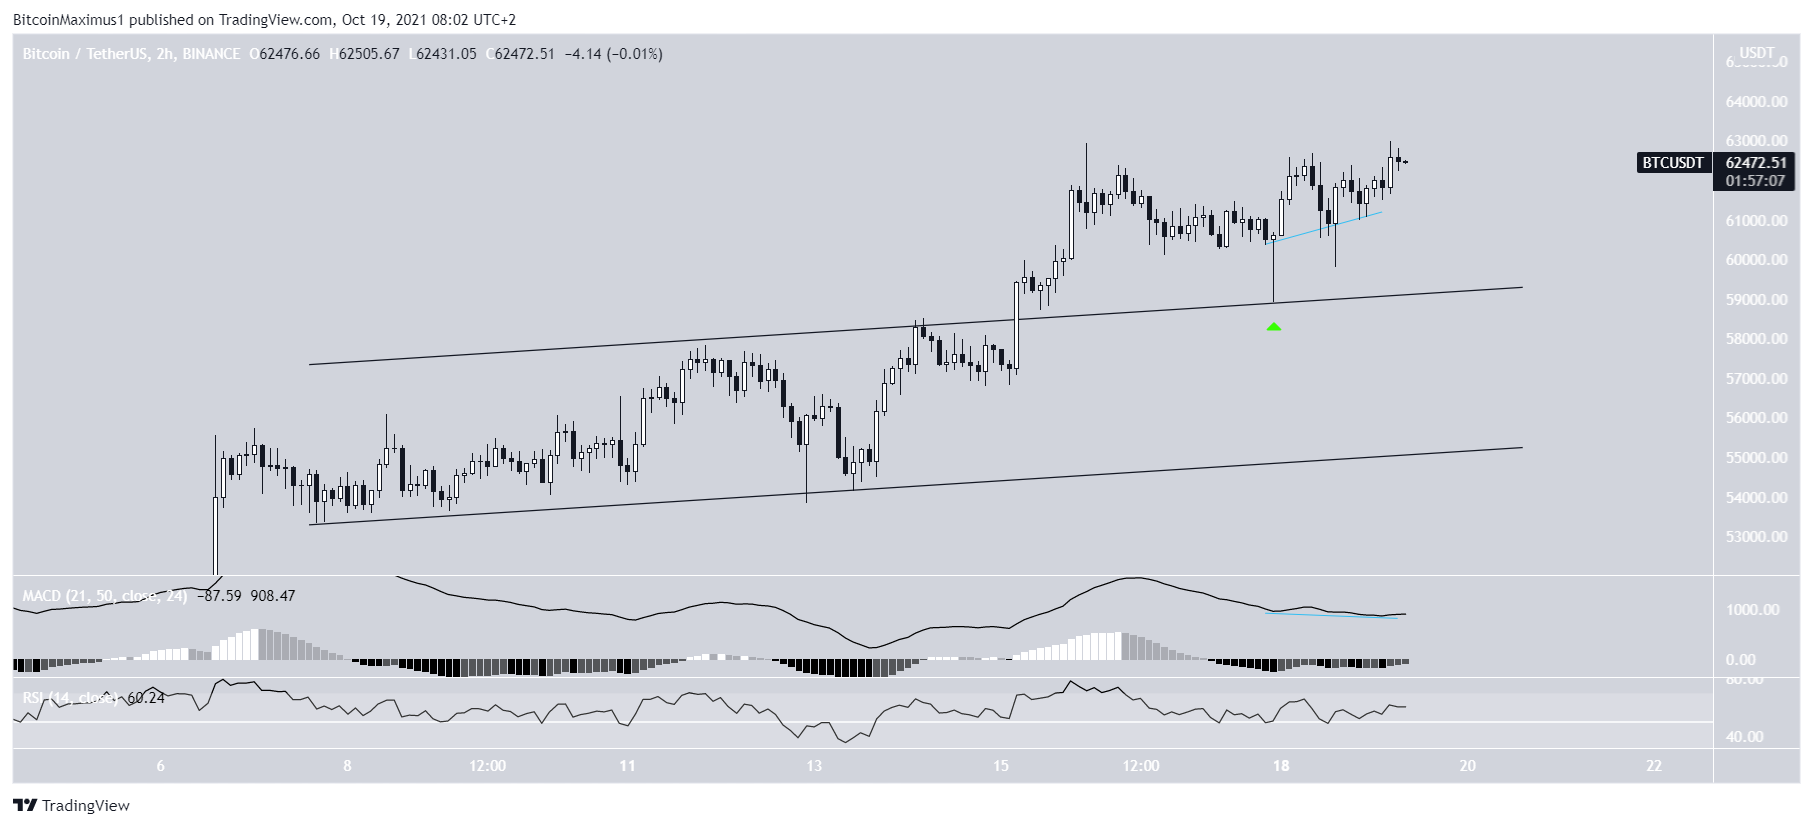
Short-term movement
The two-hour chart shows that BTC has broken out from a parallel channel and rebounded from its resistance line after (green icon).
This suggests that the line is now expected to act as support.
Technical indicators also support the continuation of the trend. The RSI is above 50, a sign of a short-term bullish trend.
More importantly, the MACD has generated a hidden bullish divergence. This is a strong sign of trend continuation.
Therefore, the readings from the two-hour time frame indicate that the upward move is expected to continue in the short term.
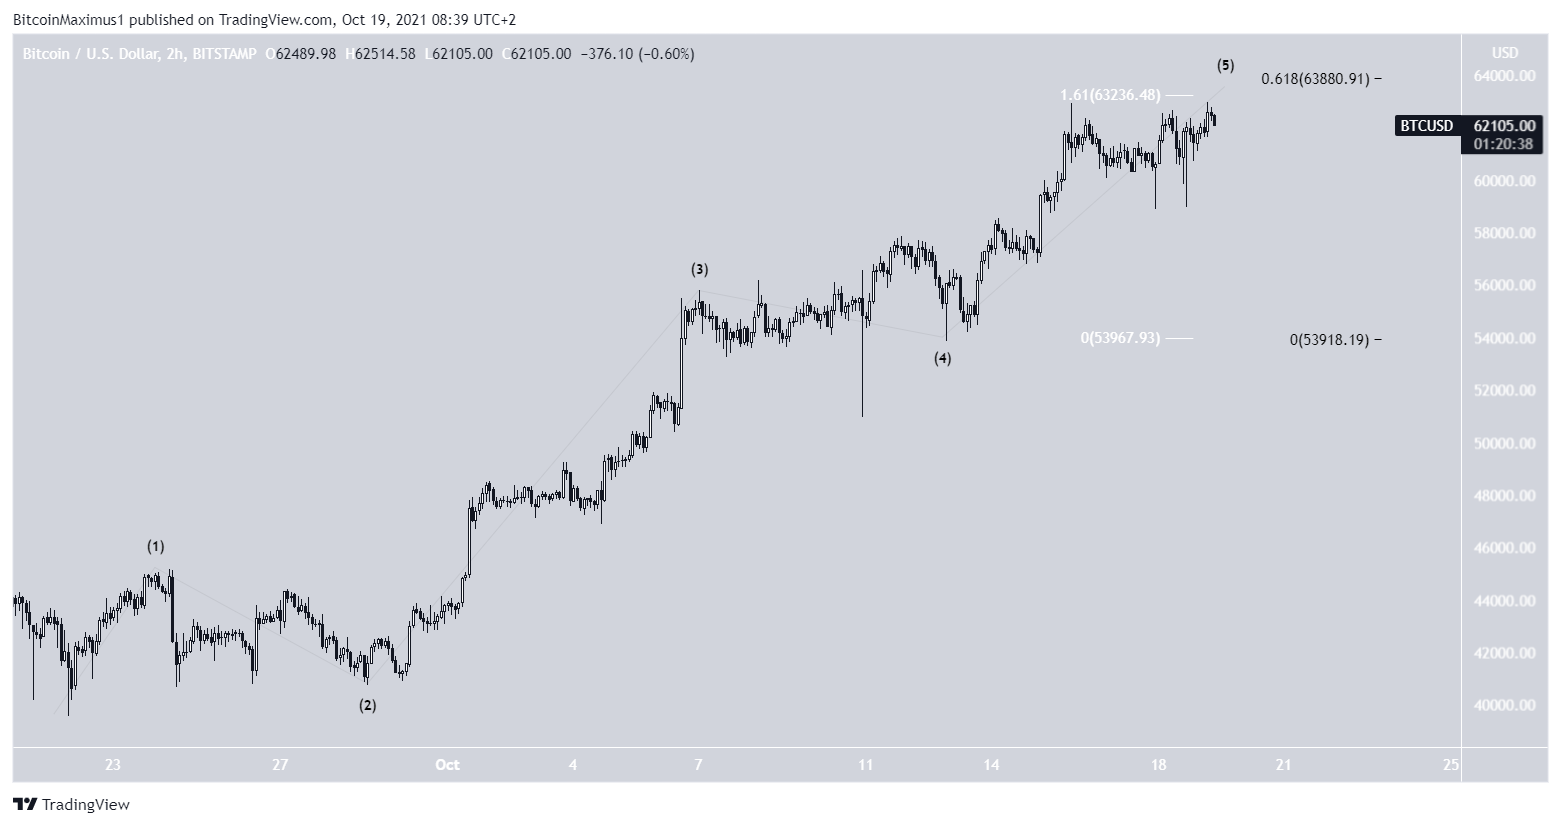
Bitcoin wave count
The short-term wave count indicates that BTC is in the fifth wave of a bullish impulse. This is the final wave, after which a correction would be likely. The long-term wave count is bullish, but also presents the possibility of an initial correction prior to the resumption of the upward movement.
BTC appears to be very close to the top of its rally when using Fib tools in order to determine the length of the increase.
A likely area for a top measure between $63,250 and $63,850. The area is found by projection the 1.61 length of wave one (white) and the 0.618 length of waves 1-3 (black).
Therefore, unless the wave extends further, BTC is likely to reach a top soon.
For BeInCrypto’s previous Bitcoin (BTC) analysis, click here.
Trusted
Disclaimer
In line with the Trust Project guidelines, this price analysis article is for informational purposes only and should not be considered financial or investment advice. BeInCrypto is committed to accurate, unbiased reporting, but market conditions are subject to change without notice. Always conduct your own research and consult with a professional before making any financial decisions. Please note that our Terms and Conditions, Privacy Policy, and Disclaimers have been updated.
