

Bitcoin (BTC) saved its bullish structure with a bullish hammer candlestick on Sunday. It also validated a crucial horizontal support area.
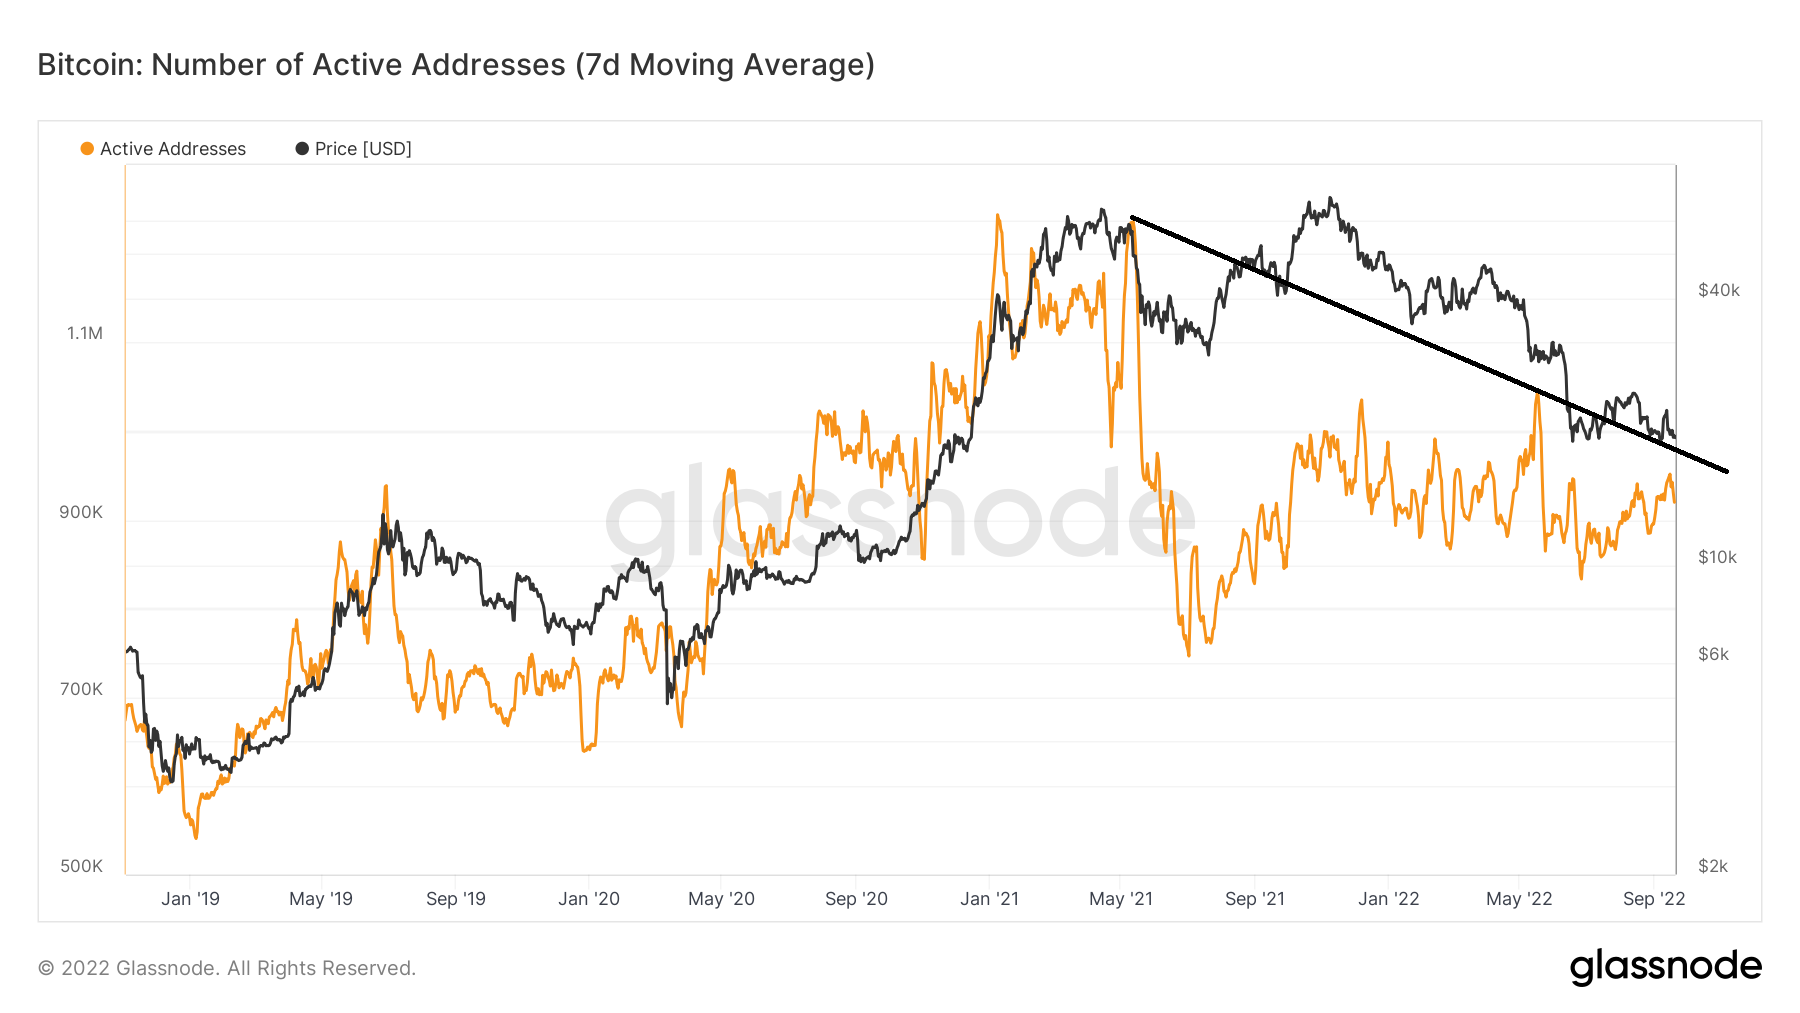
Network Growth is a measure of the health of a network based on the number of new entries. The metric shows the number of new addresses that are being created in the network. So, it shows whether network adoption is occurring and whether the project is gaining or losing traction.
Most often, an increase in the number of new addresses leads to an increase in price and vice versa.
This effect was visible at the current BTC all-time high, in which there was an extremely pronounced bearish divergence in the number of new addresses.
Therefore, while the Bitcoin price has jumped to a new all-time high, interest in the network was not following suit.
However, the number of addresses has been increasing over the past month and is very close to reaching the descending resistance line of the divergence. A continued increase could mean that the downtrend is over.
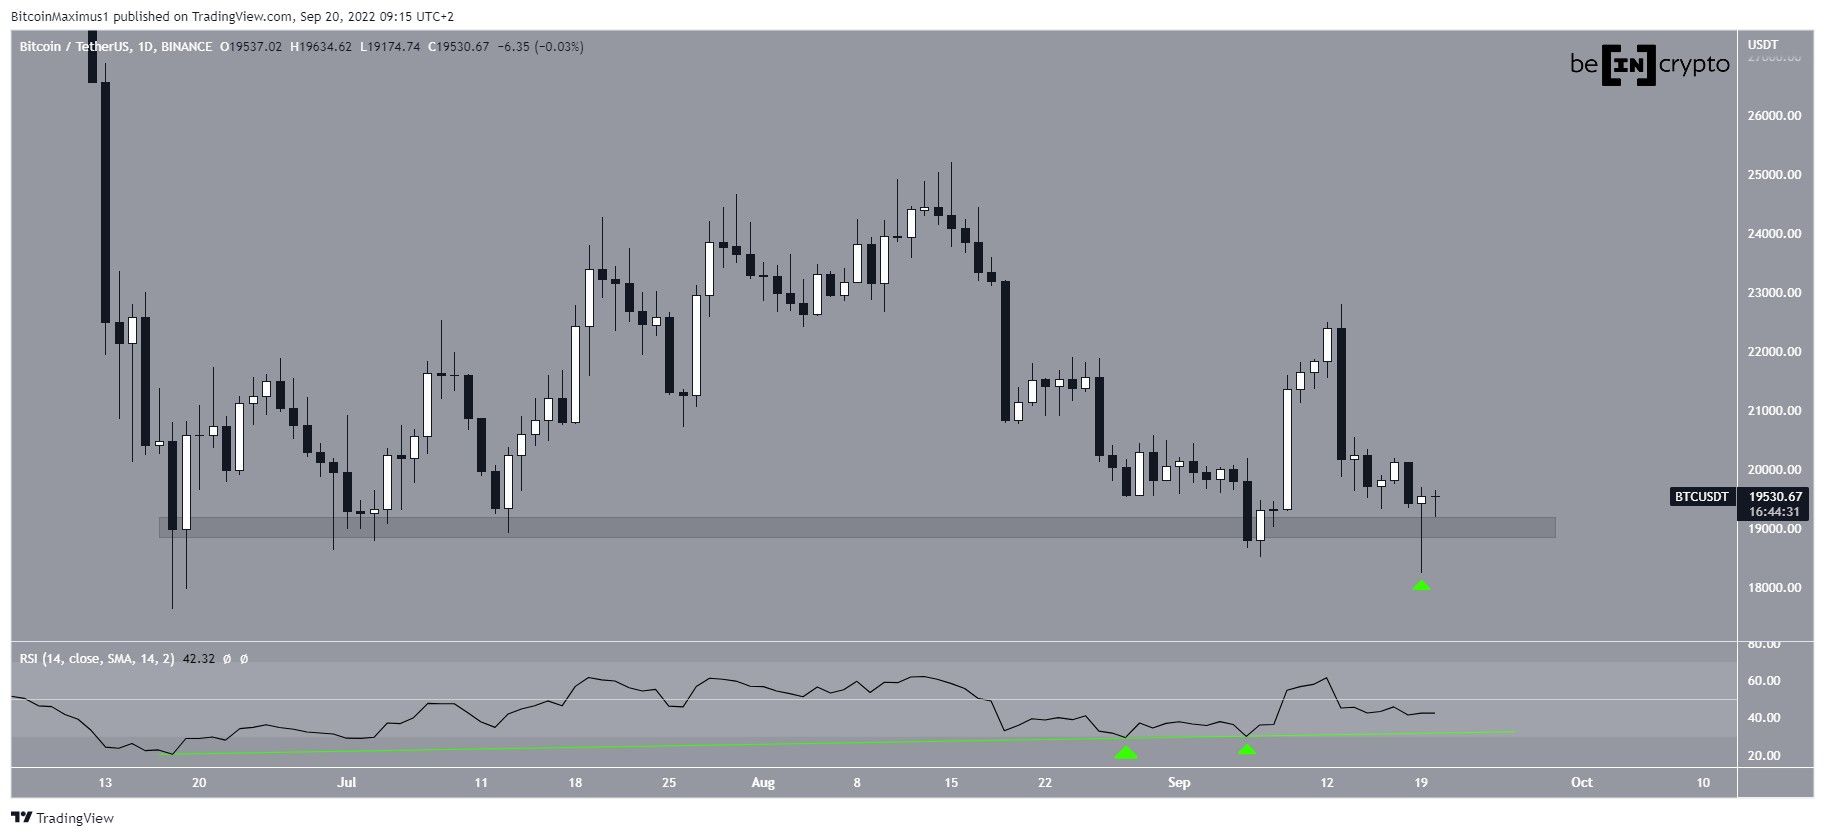
BTC creates bullish hammer
The daily chart shows that BTC bounced sharply on Sunday creating a bullish hammer candlestick (green icon) in the process. This is a type of bullish candlestick which is characterized by a long lower wick and a bullish close.
Besides showing strong buying pressure, the candle served to validate the $19,000 area as support.
Moreover, the daily RSI has generated bullish divergence and its trend line is still intact. As long as the trend line is in place, the bullish structure remains intact.
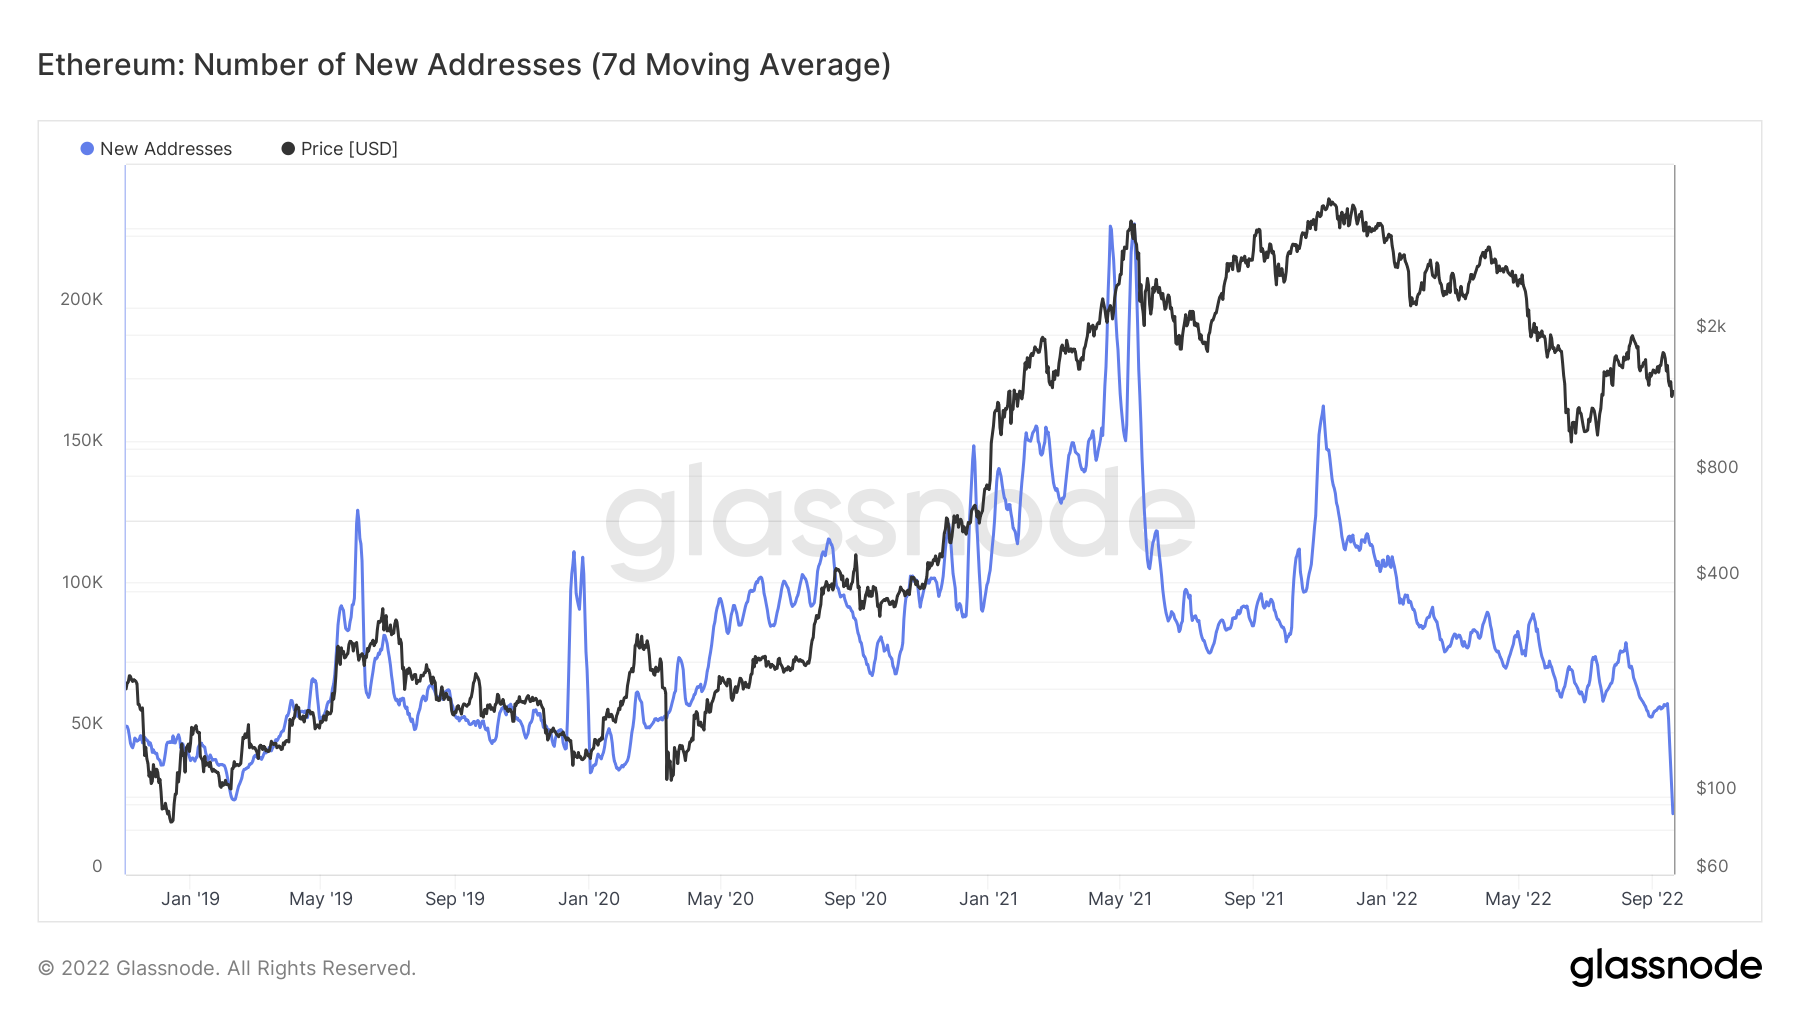
Ethereum
The same cannot be said of Ethereum. The number of new addresses has been steadily falling since May 2021. It has currently fallen below March 2020 levels. Due to the sharp sell-off last week, it seems that this occurred as a result of the Merge.
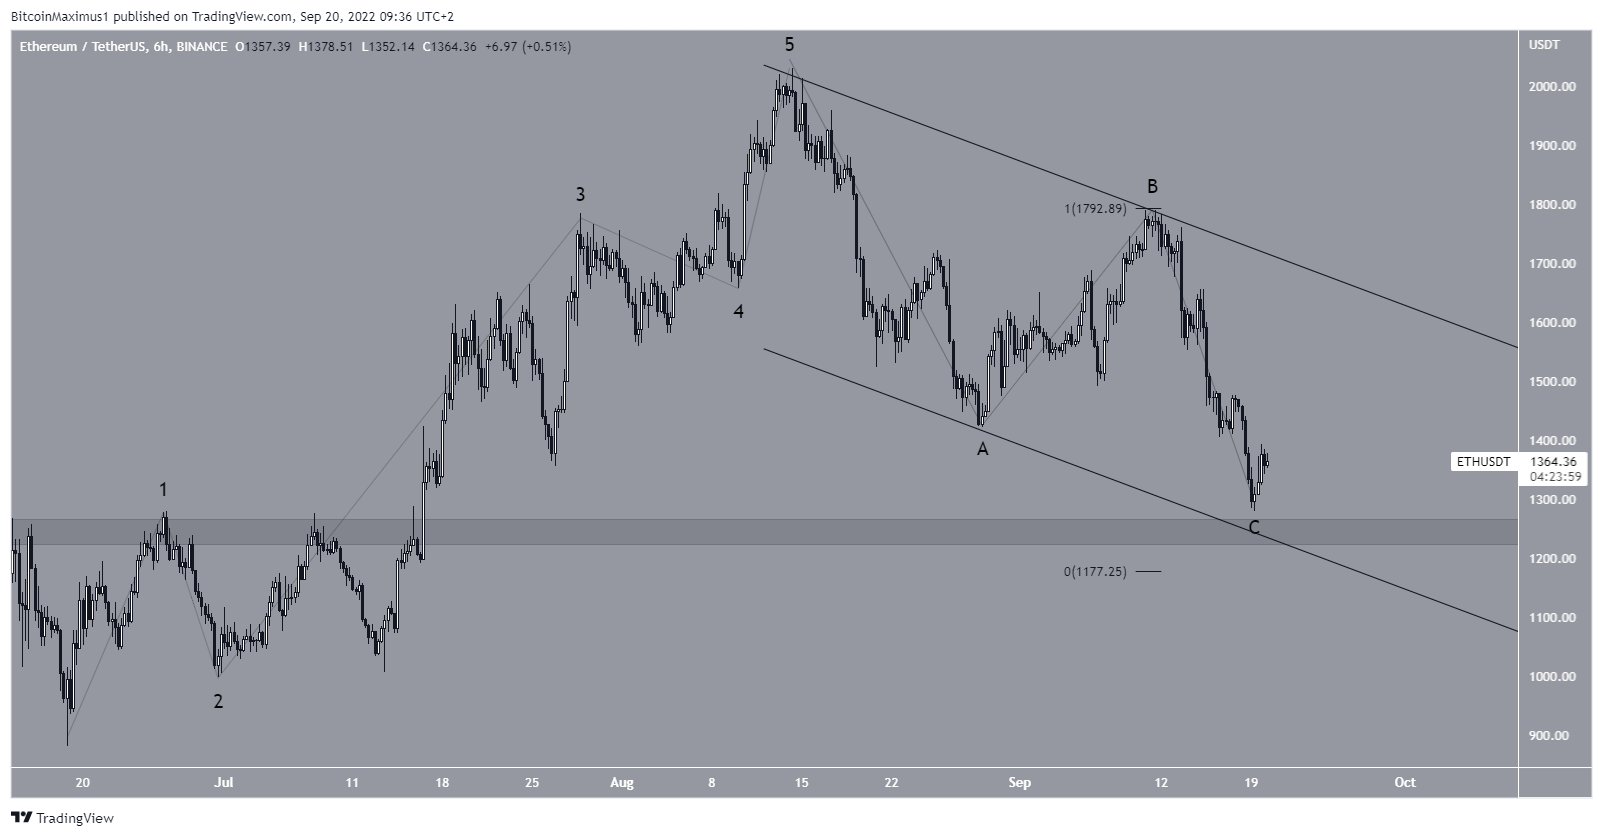
However, the price movement still shows bullish signs. While ETH has been falling since Sept. 11, it is approaching a confluence of support levels close to $1,200, created by the support line of a descending parallel channel, $1,250 horizontal support area and the 1:1 length of waves A:C.
So, it is likely that it will bounce soon, in turn completing the correction.
For Be[In]Crypto’s previous Bitcoin (BTC) analysis, click here.
Trusted
Disclaimer
In line with the Trust Project guidelines, this price analysis article is for informational purposes only and should not be considered financial or investment advice. BeInCrypto is committed to accurate, unbiased reporting, but market conditions are subject to change without notice. Always conduct your own research and consult with a professional before making any financial decisions. Please note that our Terms and Conditions, Privacy Policy, and Disclaimers have been updated.
