

The Bitcoin (BTC) price has been moving upwards since breaking out on March 8.
Bitcoin is expected to continue increasing towards the resistance line of its current short-term pattern.
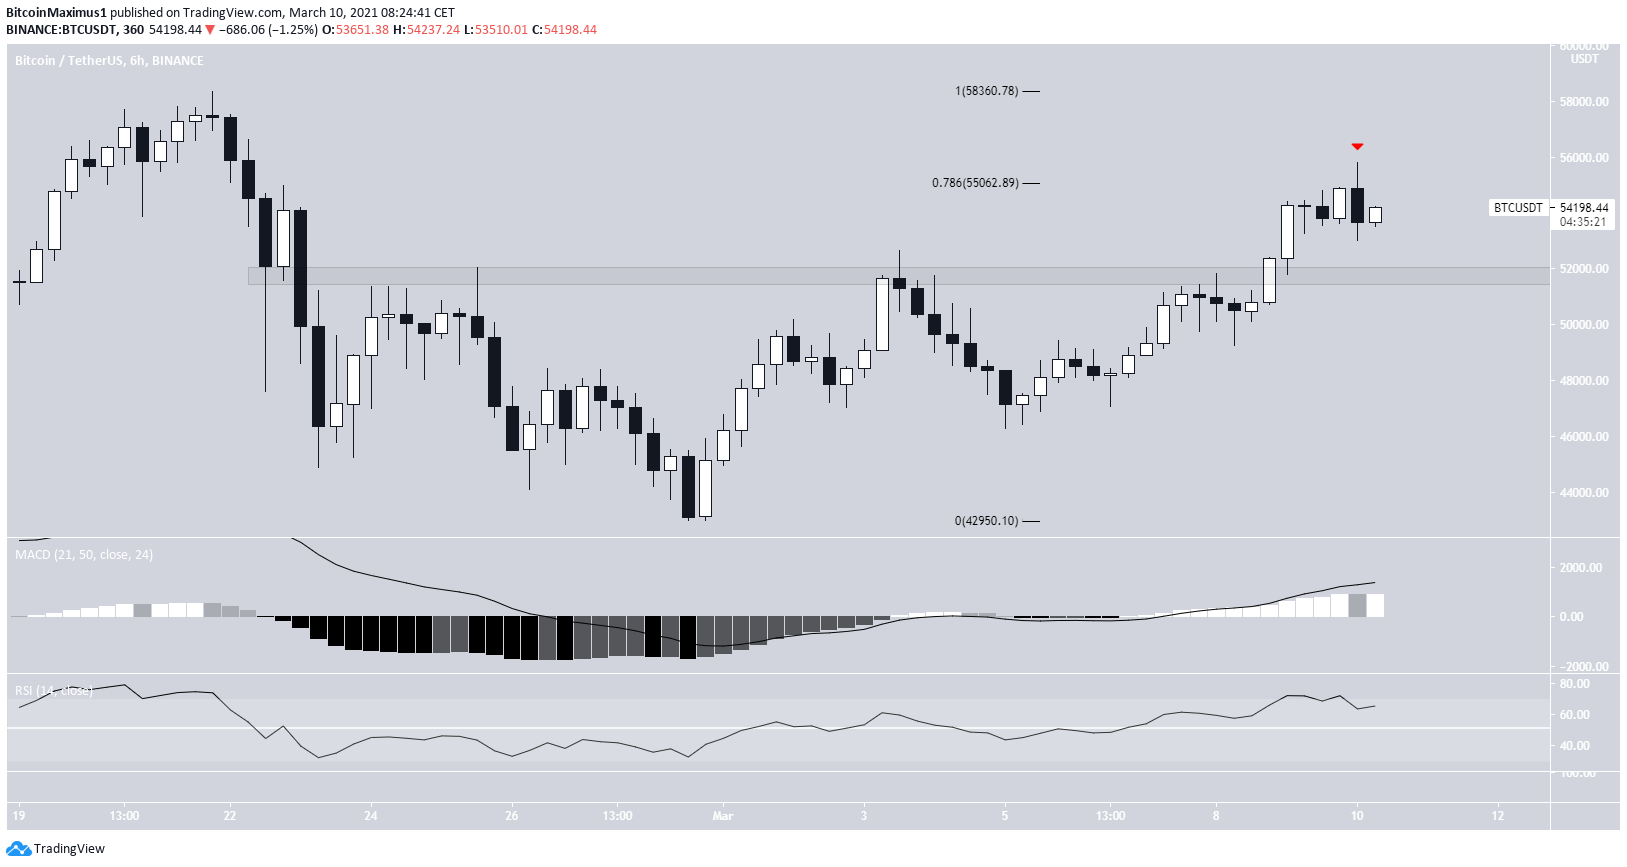
Bitcoin Shoots for $56,000
BTC has been moving upwards since breaking out from the $51,900 resistance area on March 8.
On March 9, it reached a high of $55,803 before creating a bearish candlestick and decreasing sharply. The high was made just above the 0.786 Fib retracement level of the most recent decrease.
Therefore, we could say that BTC is trading between support and resistance at $51,900 and $55,000 respectively.
Both the MACD and RSI are increasing, supporting the continuation of the upward movement.
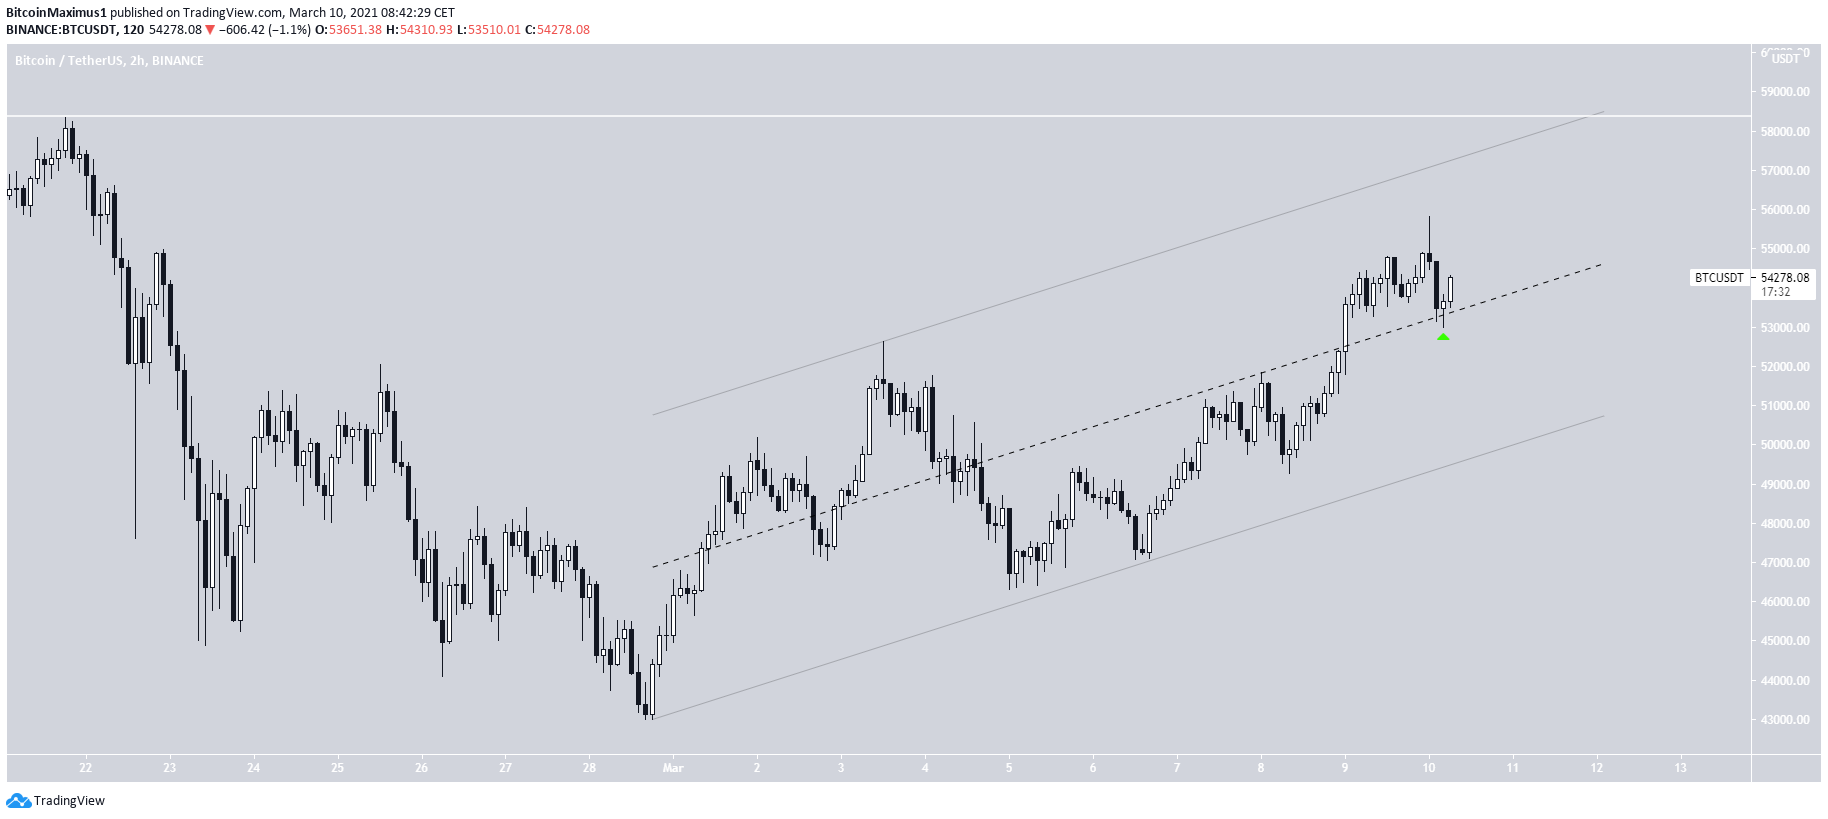
Parallel Channel
A closer look at the movement shows that BTC has been trading inside a parallel ascending channel since Feb. 28. Parallel channels are often corrective movements, which would mean that a breakdown is expected.
However, BTC has bounced from the middle of the channel and is increasing. Currently, it’s moving towards the resistance line of the channel. Depending on when it reaches the resistance of the channel, it could coincide with the all-time high price of $58,532 from Feb. 21.
Whether BTC gets rejected by the resistance line or breaks out will likely determine if this is a new impulse or a corrective increase.
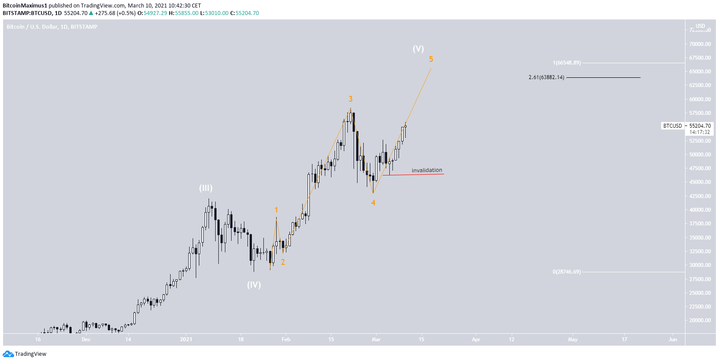
Wave Count For Bitcoin
The wave count indicates that BTC is in the fifth and final sub-wave (orange) of a long-term fifth wave (white).
A target for the top of this movement is found between $63,882-$66,548.
The invalidation level has moved higher now, being just below $46,294 (red line). Therefore, a decrease below $46,294 would mean that BTC is most likely heading lower.
Conclusion
BTC is expected to continue increasing towards the resistance line of the current channel. Whether it breaks out or gets rejected will likely help determine the direction of the trend.
For BeInCrypto’s previous Bitcoin (BTC) analysis, click here.
Trusted
Disclaimer
All the information contained on our website is published in good faith and for general information purposes only. Any action the reader takes upon the information found on our website is strictly at their own risk.
