

Bitcoin (BTC) fell considerably on Sept 20, breaking down from the $44,000 support area in the process.
It rebounded after hitting the $40,000 support and created a long lower wick. However, the main support area still lies close to $38,000.
Ongoing BTC breakdown
BTC decreased sharply on Sept 20, creating a large bearish candlestick and falling below the $44,000 area, which previously had acted as support. Now, the area is expected to act as resistance.
Currently, BTC has found support above the 0.5 Fib retracement support level at $40,800 and created a long lower wick.
Despite the bounce, technical indicators are firmly bearish. The MACD and RSI are both falling, and the latter has already moved below the 50-line. In addition to this, the Supertrend is bearish (red line).
If another drop were to occur, the next major support level would be found at $38,000. This target is the 0.618 Fib retracement support level.

Future movement
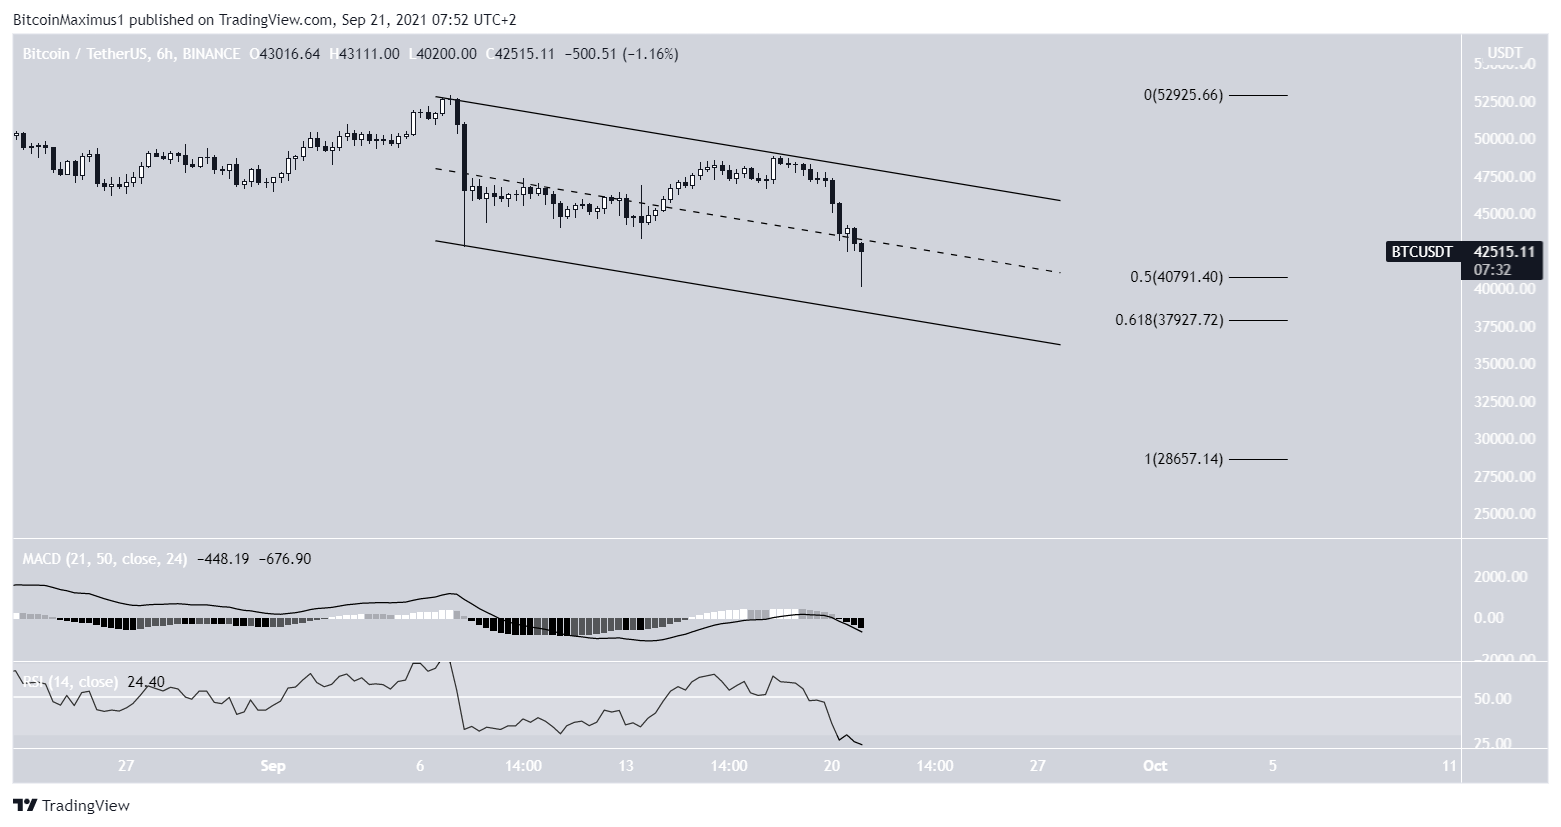
The six-hour chart provides similar bearish readings in both the RSI and MACD.
However, it shows a potential descending channel in place with a support line near the 0.618 Fib retracement support level at $38,000.
Therefore, there is a further confluence of support levels near $38,000 that indicates BTC is likely to bounce back if it gets there.
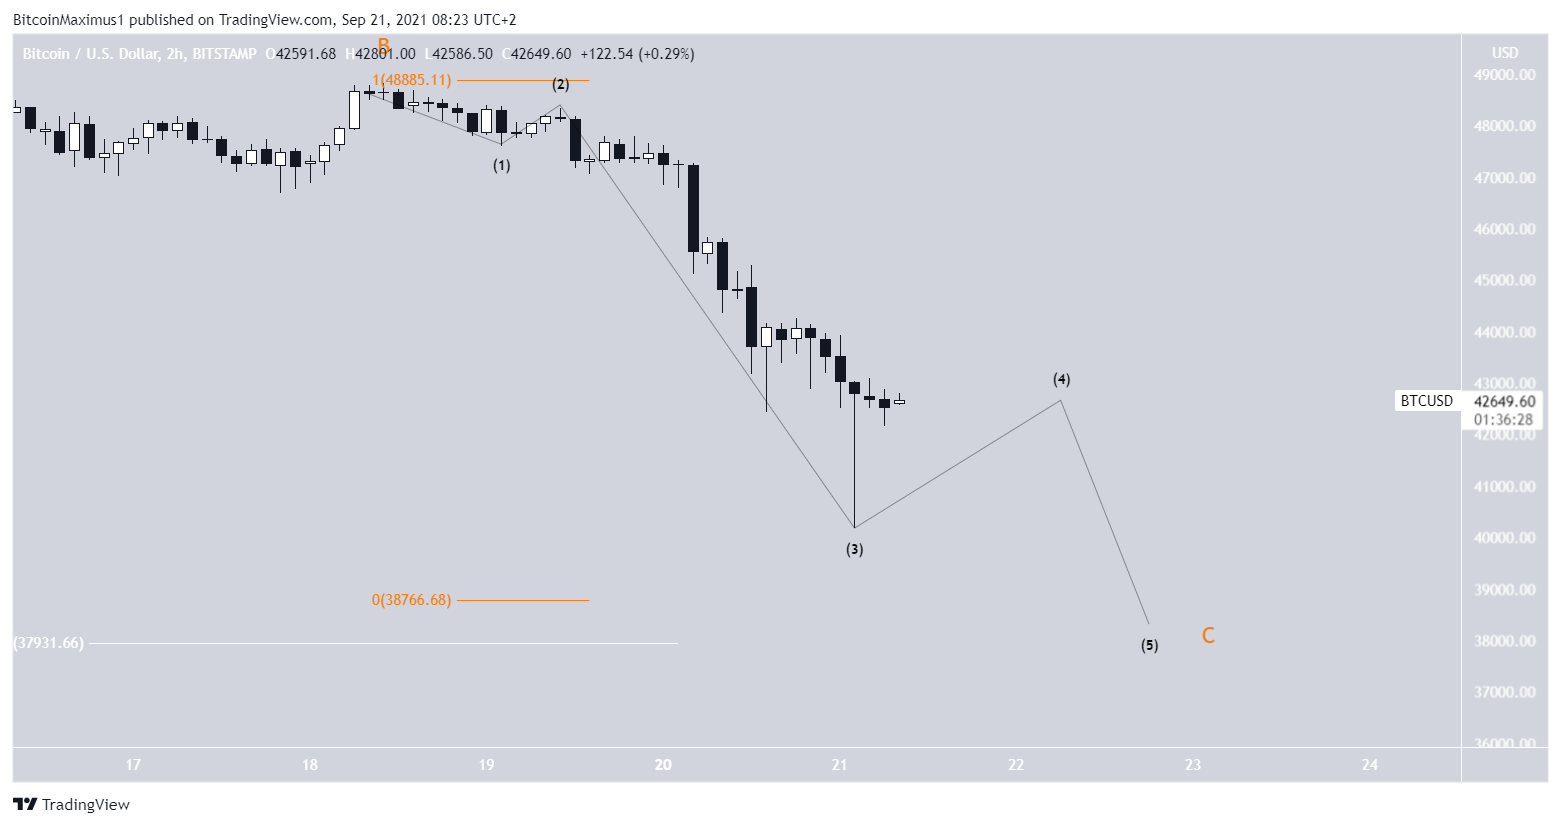
Finally, the two-hour chart fails to show any clear bullish signs.
So, a decrease towards the 0.618 Fib retracement support level at $38,000 does seem like the most likely scenario.

Wave count
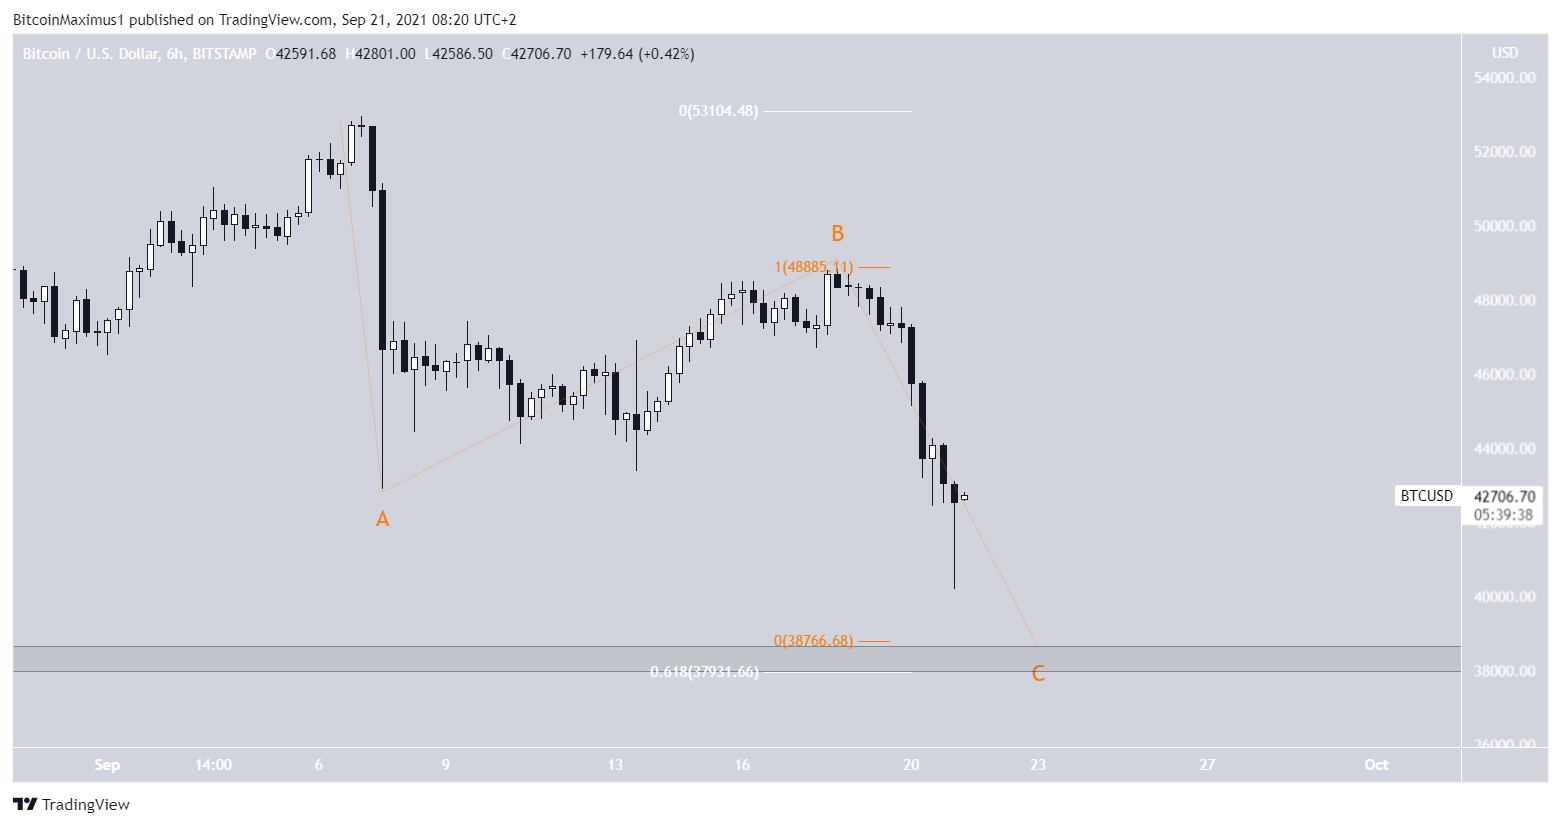
The wave count suggests that BTC in wave C of an A-B-C corrective structure (orange).
The most likely target for the bottom of the move falls between $37,930 and $38,750. The target is found by the 0.618 Fib retracement support level (white) and by giving waves A:C a 1:1 ratio.
So far, BTC has yet to reach this target.
The sub-wave count (black) indicates that the current drop and bounce were most likely as part of sub-wave three (black), and BTC is currently in sub-wave four.
Another drop toward the previously outlined target near $38,000 would complete the entire impulse.
For BeInCrypto’s previous Bitcoin (BTC) analysis, click here.
Trusted
Disclaimer
In line with the Trust Project guidelines, this price analysis article is for informational purposes only and should not be considered financial or investment advice. BeInCrypto is committed to accurate, unbiased reporting, but market conditions are subject to change without notice. Always conduct your own research and consult with a professional before making any financial decisions. Please note that our Terms and Conditions, Privacy Policy, and Disclaimers have been updated.
