

Bitcoin (BTC) reached a high above $48,000 on March 28 and is now approaching an important resistance level near $51,000.
Bitcoin has been moving upwards since Jan. 24 and has so far reached a high of $48,189 on March 28. It’s possible that the entire movement has been contained inside an ascending parallel channel.
However, due to the numerous long wicks, the exact slope of the channel is undetermined.
If the upward move continues, the closest resistance area would be found near $51,000. This is the 0.5 Fib retracement resistance level and a long-term horizontal resistance area. Furthermore, it coincides with the resistance line of the channel.
Technical indicators in the daily time frame are bullish. Both the MACD and RSI are increasing. The MACD is currently positive and the RSI has moved above 70, both of which are common signs of a bullish trend.

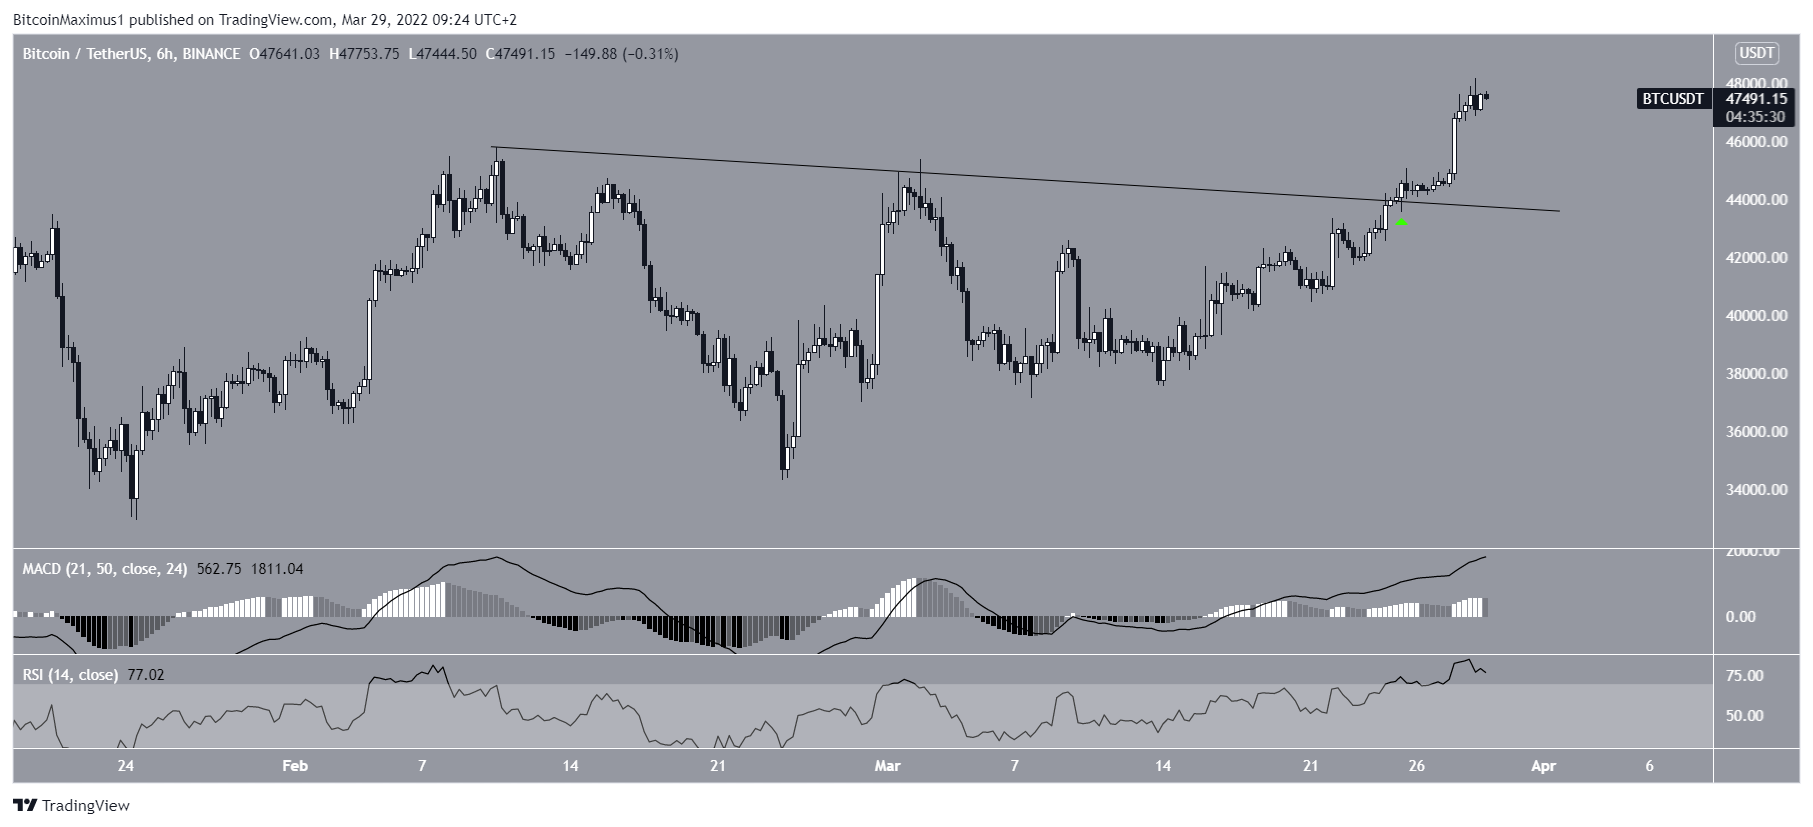
Short-term BTC breakout
The six-hour chart shows that BTC has broken out from a descending resistance line that had previously been in place since Feb. 10. It did so after three attempts and already validated the line as support (green icon).
Neither the MACD nor RSI are showing any signs of weakness, meaning that it’s possible that the upward trend will continue without any considerable retracement.
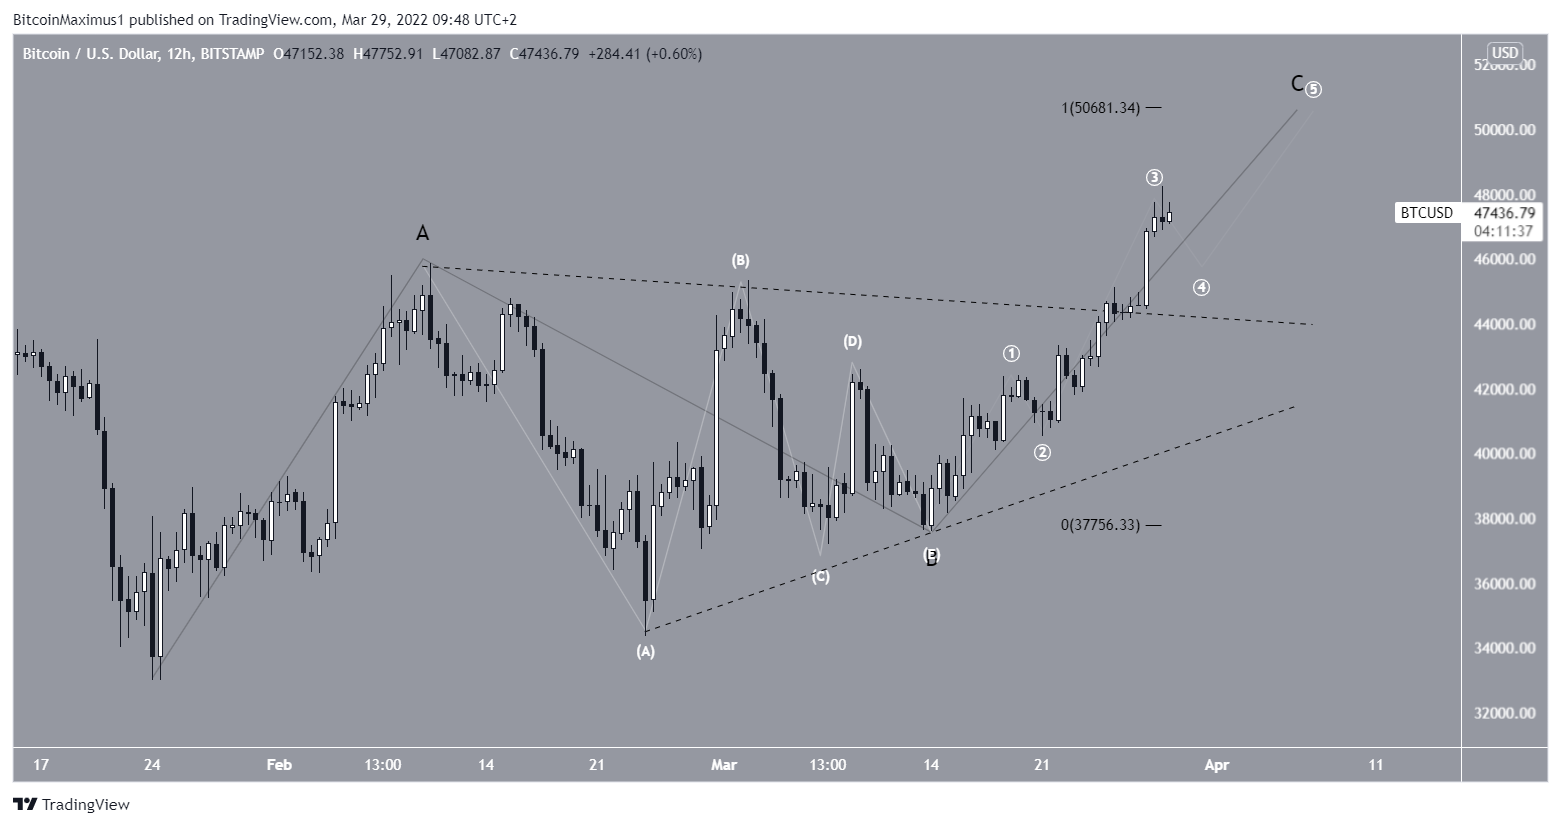
Wave count analysis
The most likely wave count suggests that BTC has begun wave C of an A-B-C structure (black). The beginning of the wave was on March 14 and was validated on March 23 with the breakout from the symmetrical triangle.
The sub-wave count is shown in white and suggests that BTC is now in sub-wave three or four.
If BTC reaches a high close to $50,700, it would give waves A and C a 1:1 ratio. This would also fall close to the $51,000 resistance area outlined in the first section, creating a confluence of resistance levels between $50,700-$51,000.
For BeInCrypto’s previous Bitcoin (BTC) analysis, click here
Trusted
Disclaimer
In line with the Trust Project guidelines, this price analysis article is for informational purposes only and should not be considered financial or investment advice. BeInCrypto is committed to accurate, unbiased reporting, but market conditions are subject to change without notice. Always conduct your own research and consult with a professional before making any financial decisions. Please note that our Terms and Conditions, Privacy Policy, and Disclaimers have been updated.
