

The Bitcoin (BTC) price was able to bounce and recover slightly from the dip that occurred on March 25.
Bitcoin is currently trading just below the $53,600 resistance area. Reclaiming this level would be a major bullish development.
Bitcoin Bounces at Support
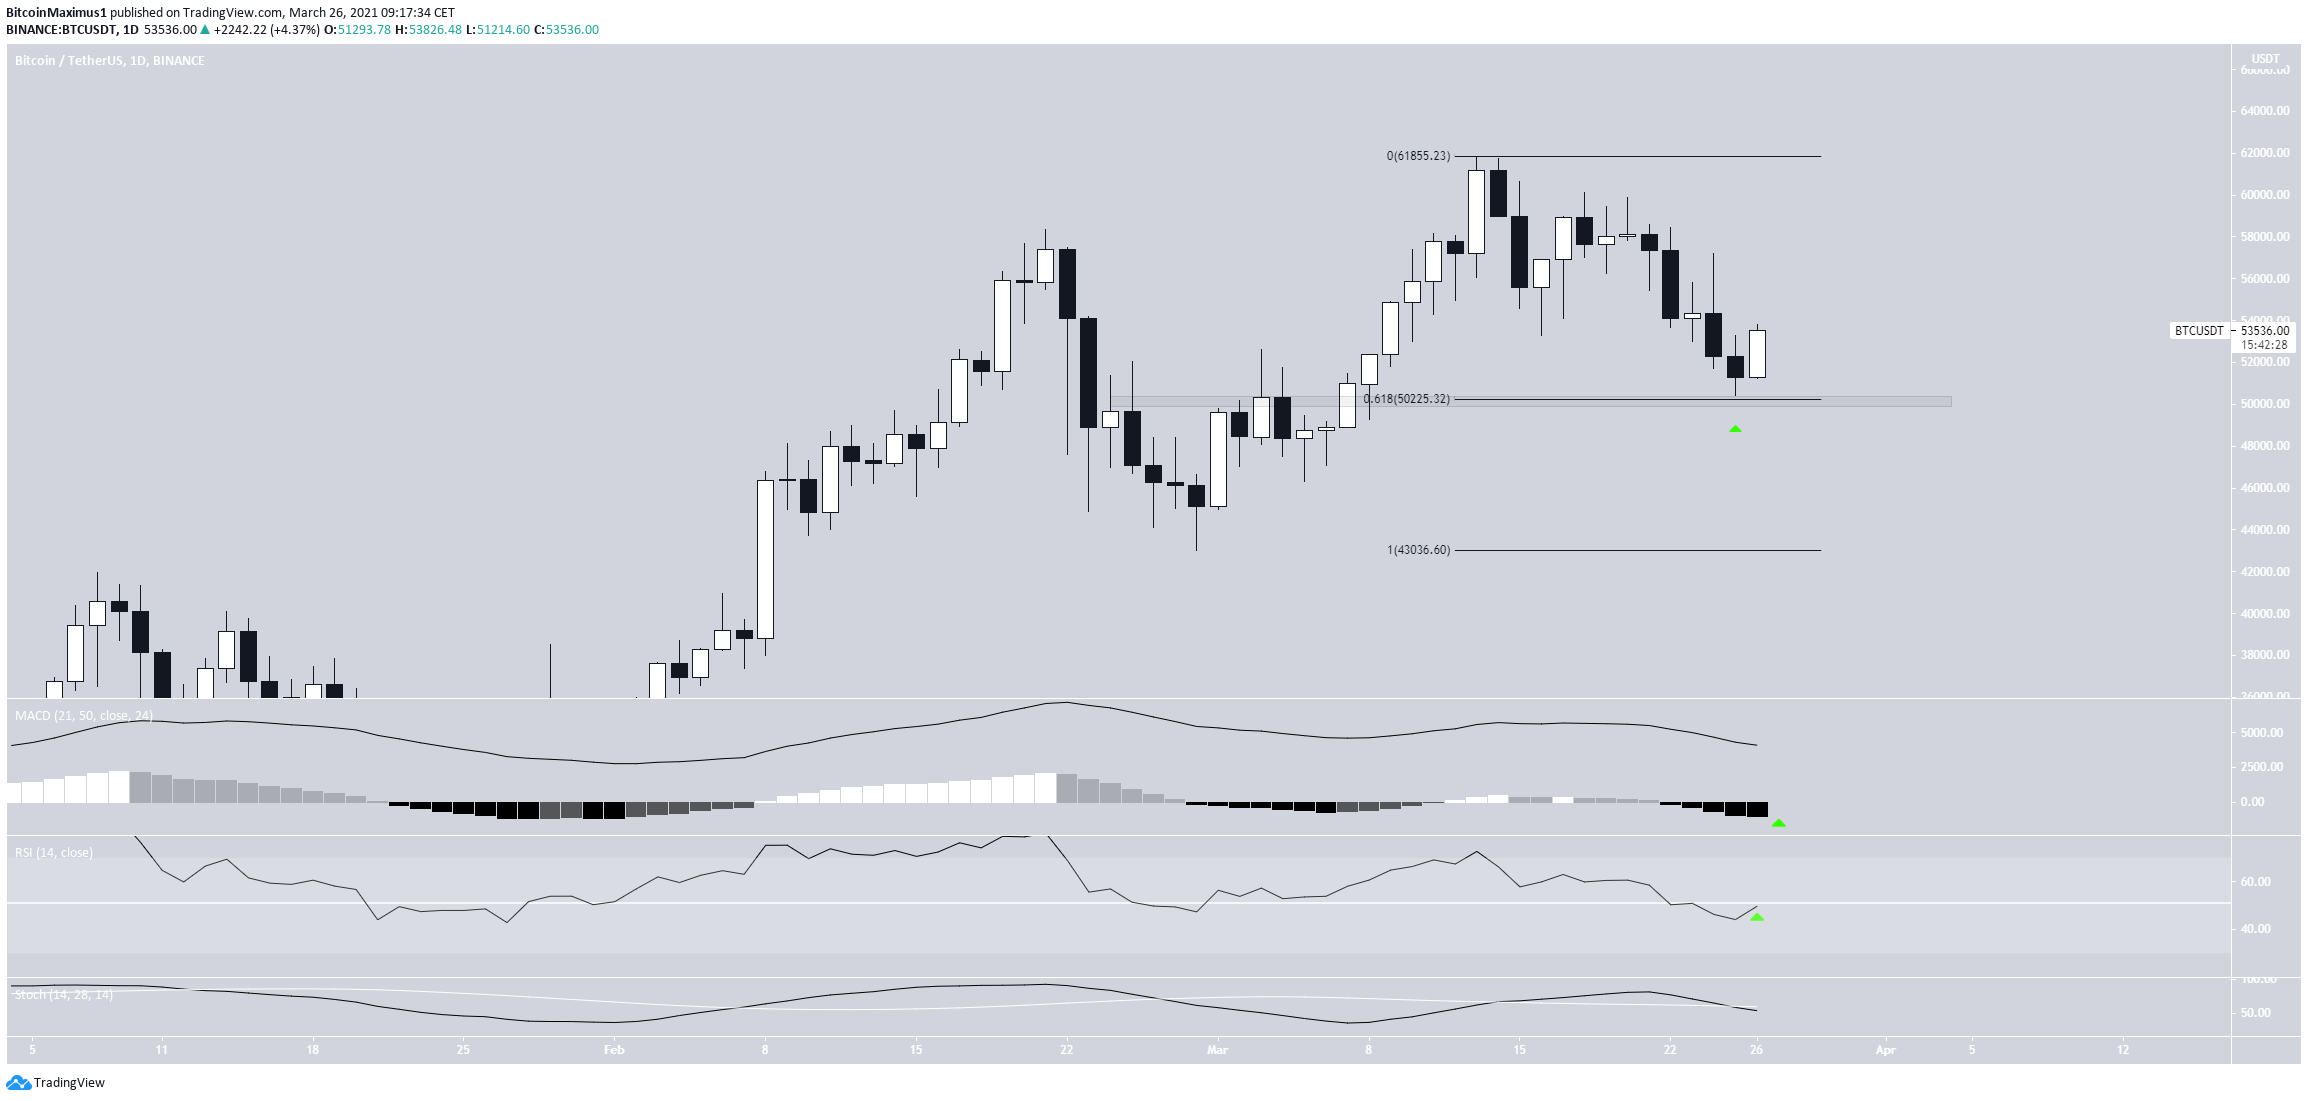
BTC has been moving downwards since March 13, when it reached an all-time high price of $61,884.
On March 25, it reached a local low of $50,427.
The low was made just slightly above the 0.618 Fib retracement support level at $50,250. Since then, BTC has been moving upwards.
Despite the bounce, technical indicators in the daily time frame are bearish.
A bullish reversal in the MACD and/or an RSI cross above 50 would be required for the trend to be considered bullish.
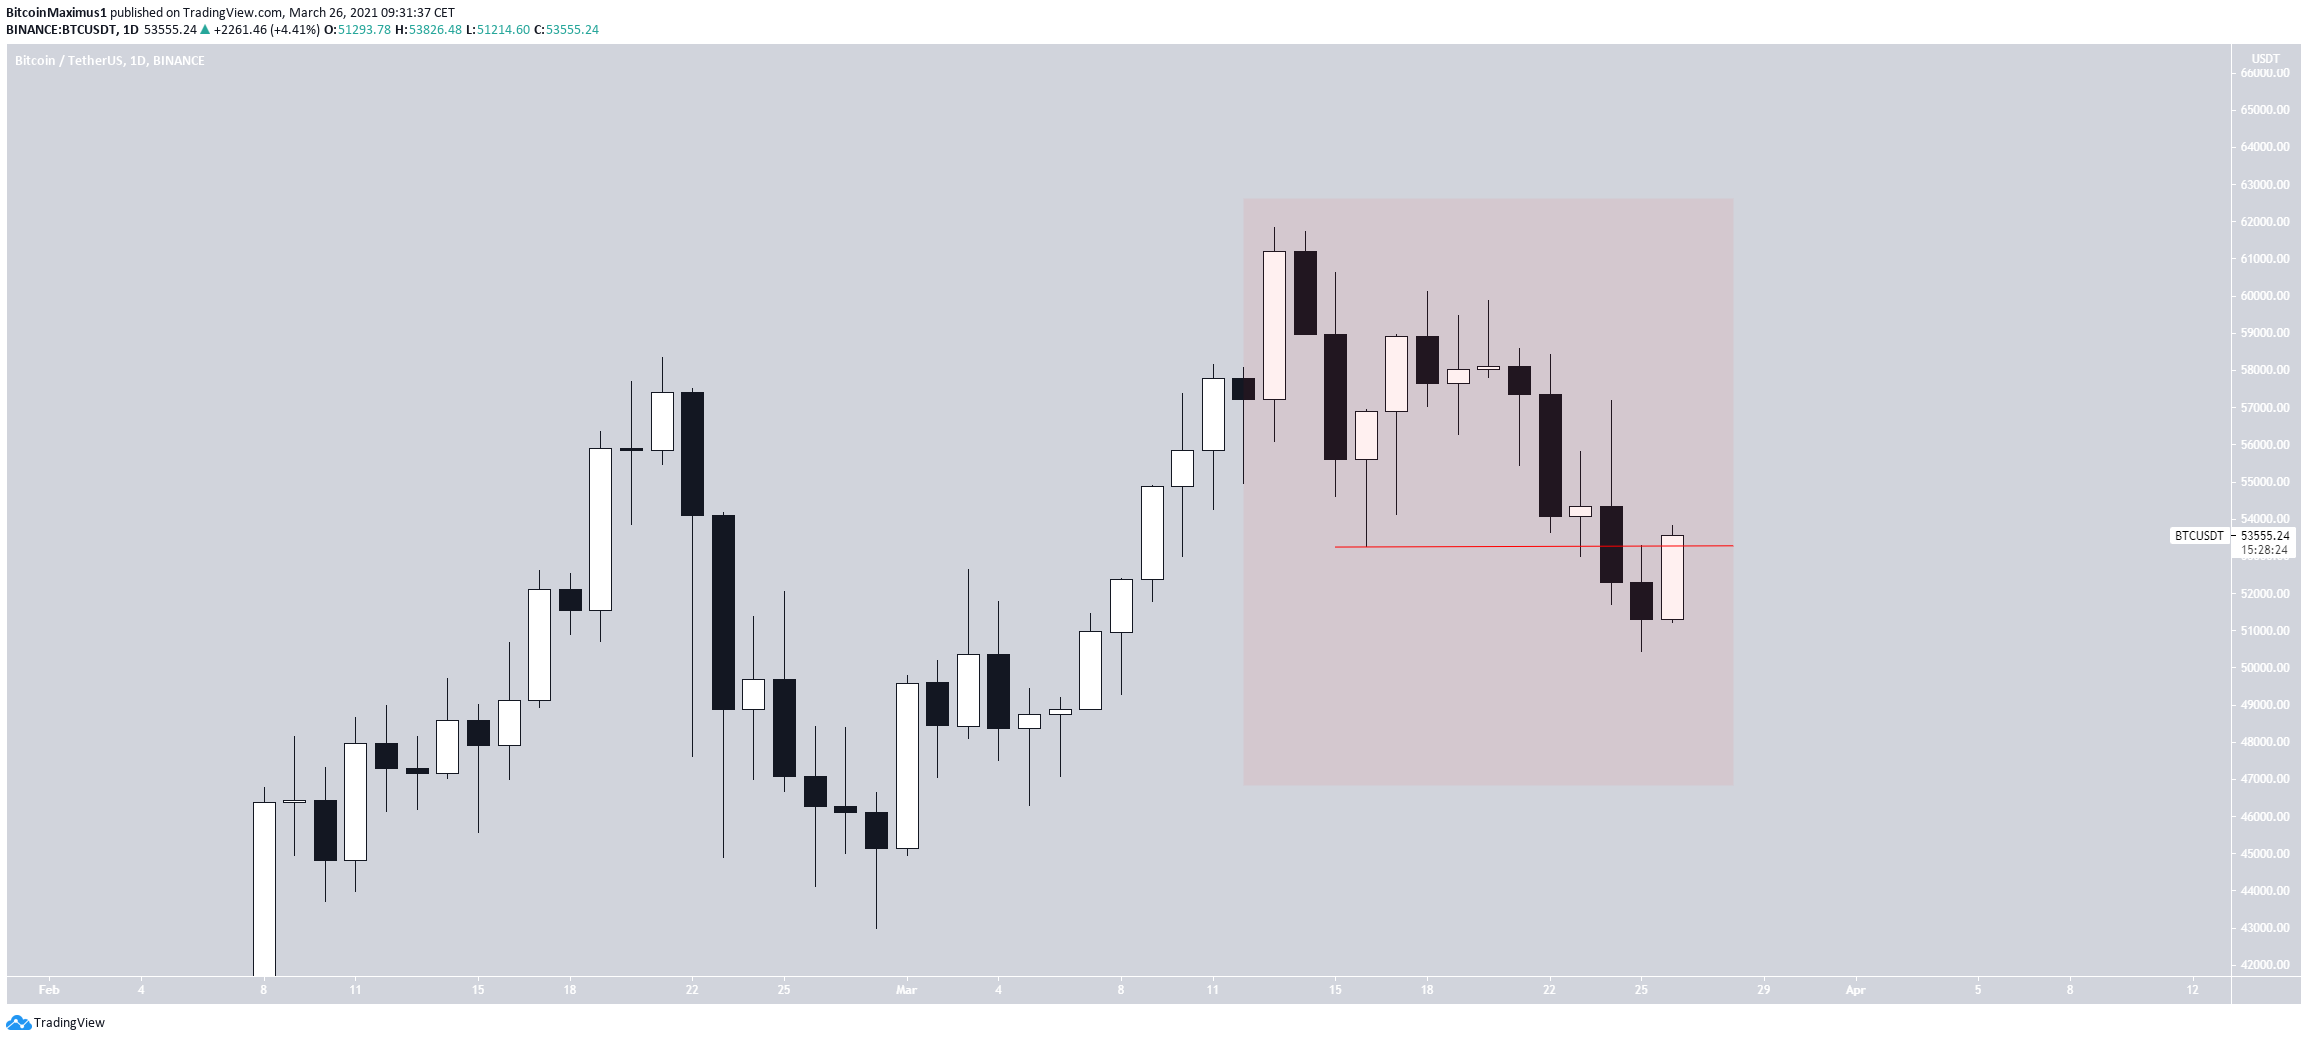
While it’s not yet confirmed if BTC will eventually make a lower low, the move from the all-time high does not look impulsive at all. This is further confirmed by today’s overlap with the March 16 high.
Therefore, it’s very unlikely that this is the beginning of a new downward movement. In the most plausible scenario, BTC is correcting in some sort of wave four or sub-wave four, and will eventually make a new all-time high price.
Short-Term BTC Movement
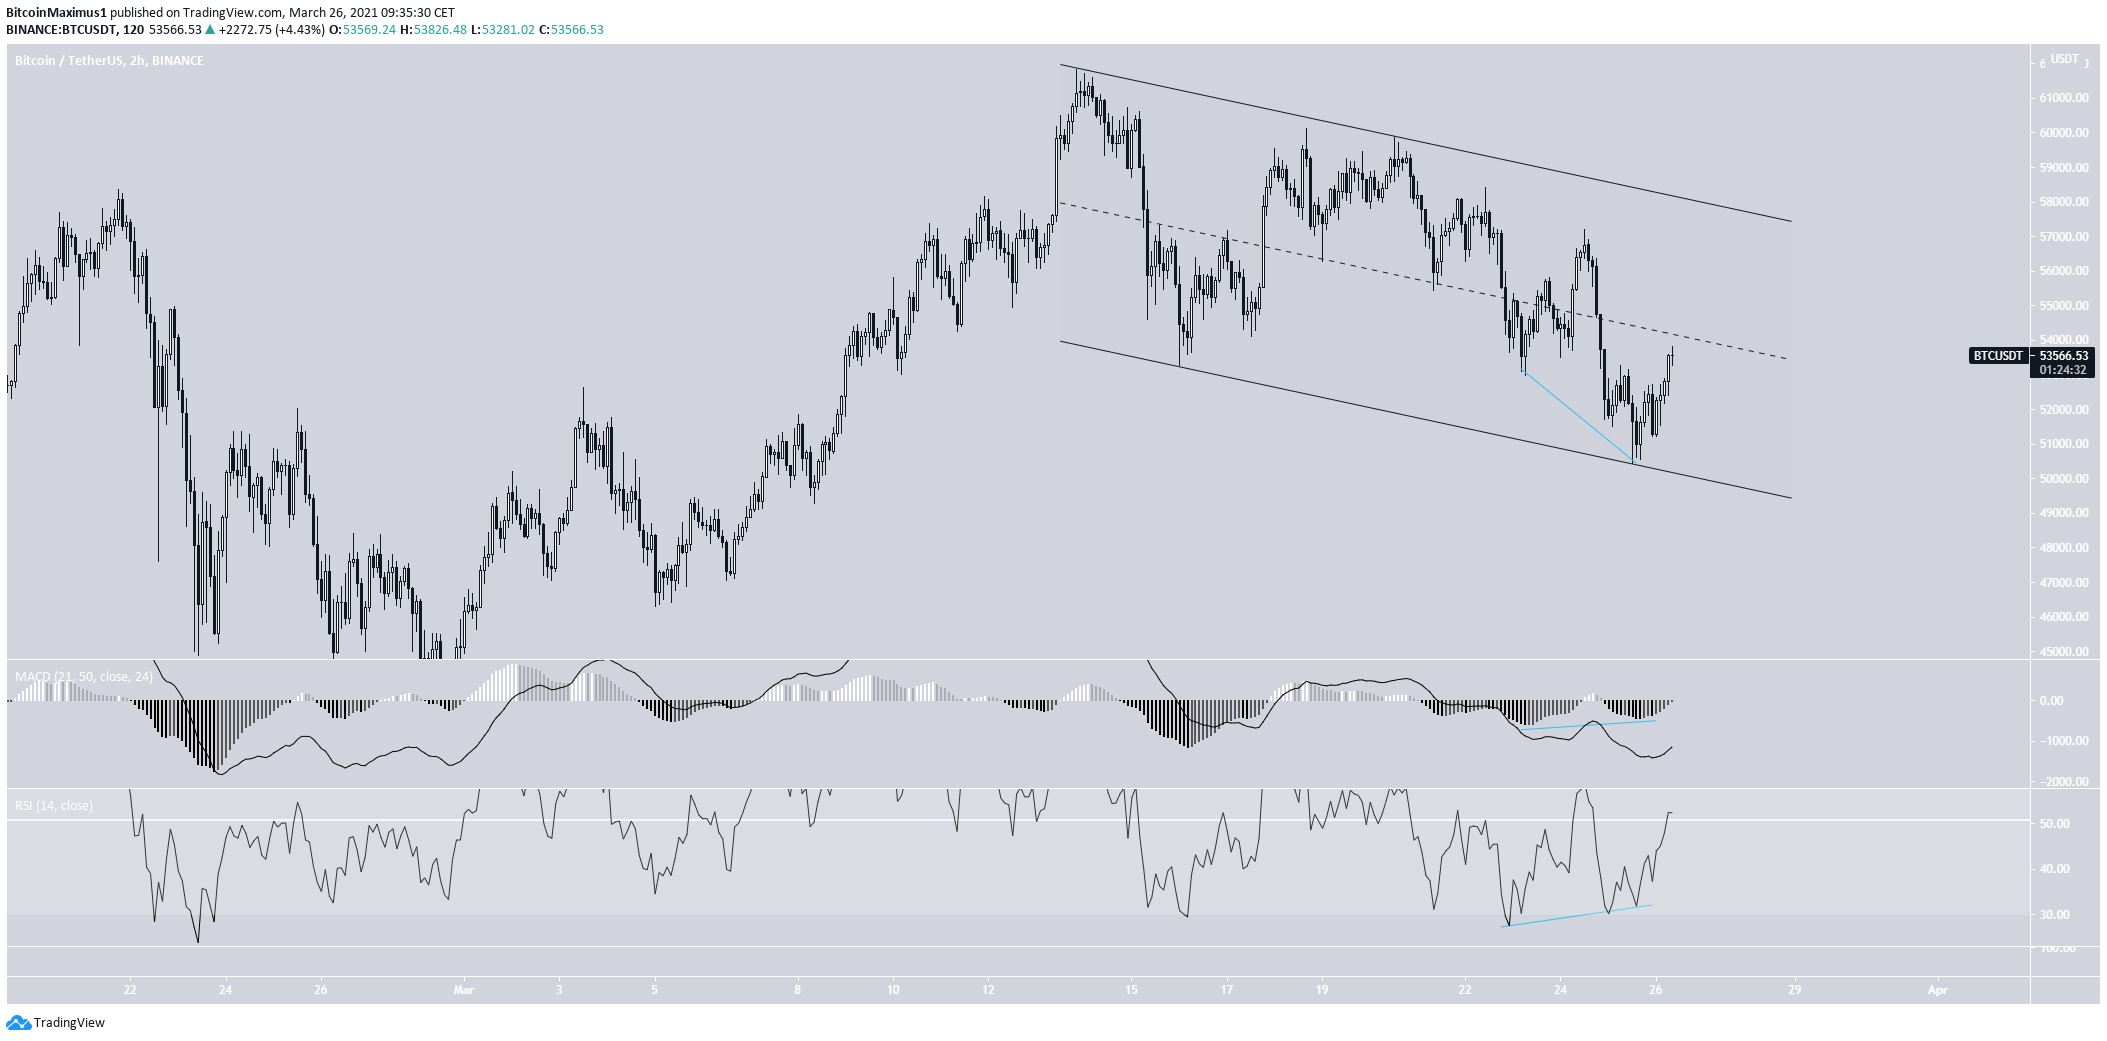
The two-hour chart shows that BTC is trading inside a parallel descending channel. This is often a corrective movement.
Because of this, a breakout from the channel would be expected. This is also supported by the bullish divergence in both the RSI and MACD.
Currently, BTC is trading right in the middle of the channel. Reclaiming the midline would also cause the RSI to move above 50 and the MACD to turn positive.
A look at the six-hour chat shows a similar bullish divergence in the RSI. While the MACD has not generated any bullish divergence, it’s close to giving a bullish reversal signal.
Furthermore, the midline of the channel coincides with the $53,600 resistance area.
Reclaiming this level would indicate that the low is likely already in and BTC will head higher.

Conclusion
While it’s not clear if BTC will eventually make a lower low, the current drop looks corrective. Therefore, a new all-time high price is eventually expected.
Reclaiming the $53,600 resistance area would go a long way in suggesting that the upward movement hasn’t stalled.
For BeInCrypto’s previous bitcoin (BTC) analysis, click here.
Trusted
Disclaimer
In line with the Trust Project guidelines, this price analysis article is for informational purposes only and should not be considered financial or investment advice. BeInCrypto is committed to accurate, unbiased reporting, but market conditions are subject to change without notice. Always conduct your own research and consult with a professional before making any financial decisions. Please note that our Terms and Conditions, Privacy Policy, and Disclaimers have been updated.
