

The Bitcoin (BTC) price has been increasing since pivoting on March 25.
Bitcoin is expected to break out from the current short-term descending parallel channel. A short-term decrease could transpire prior to the breakout.
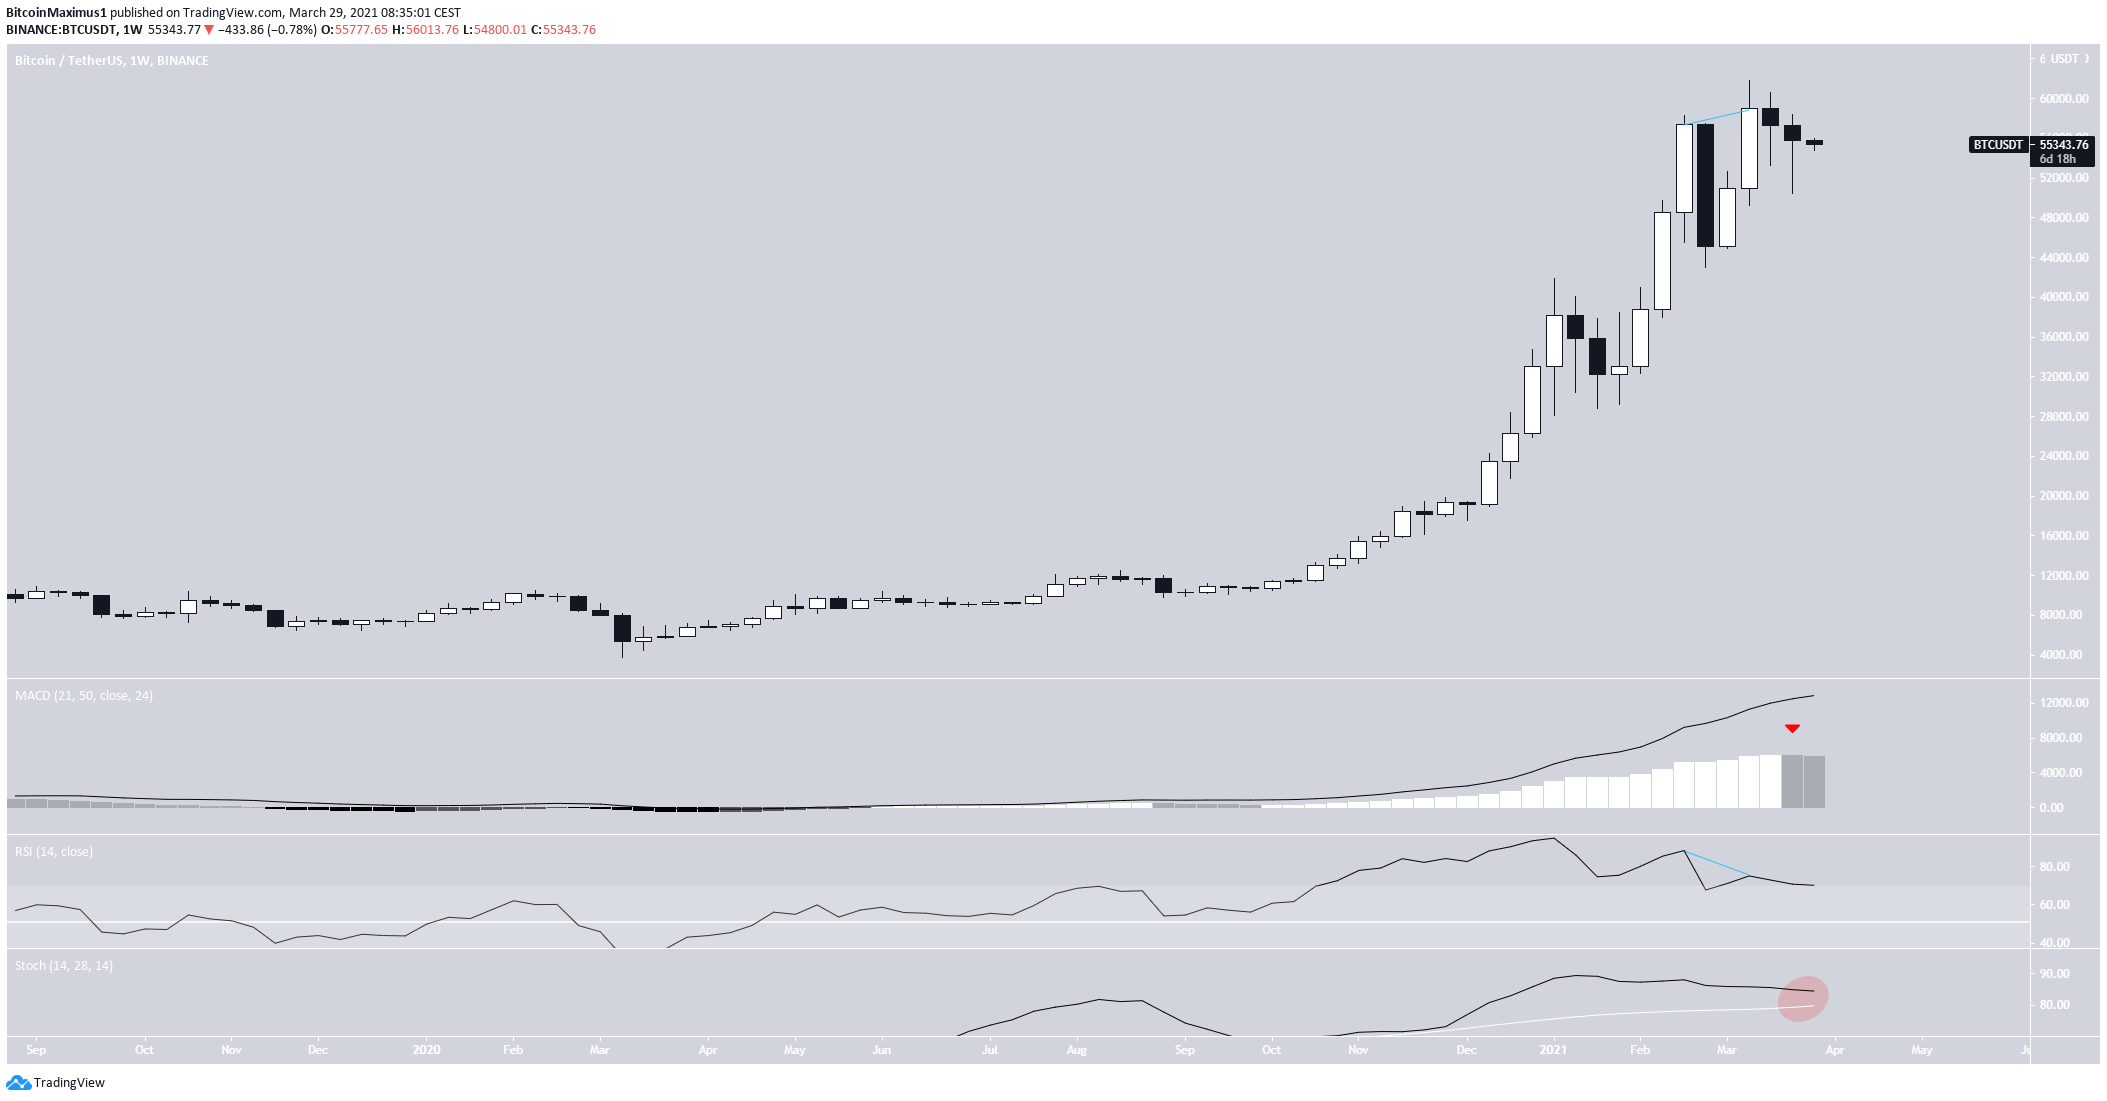
Weekly Outlook for BTC
The weekly chart shows that BTC created a hanging man candlestick last week. While this can be seen as a sign of weakness, BTC also created a long lower wick, a sign of buying pressure.
Nevertheless, technical indicators have begun to show weakness. The MACD has created the first lower momentum bar since September 2020.
However, the weakness is not sufficient to call for a reversal. While the RSI generated a bearish divergence, a drop already occurred as a result. In addition, the Stochastic oscillator is decreasing but has yet to make a bearish cross.
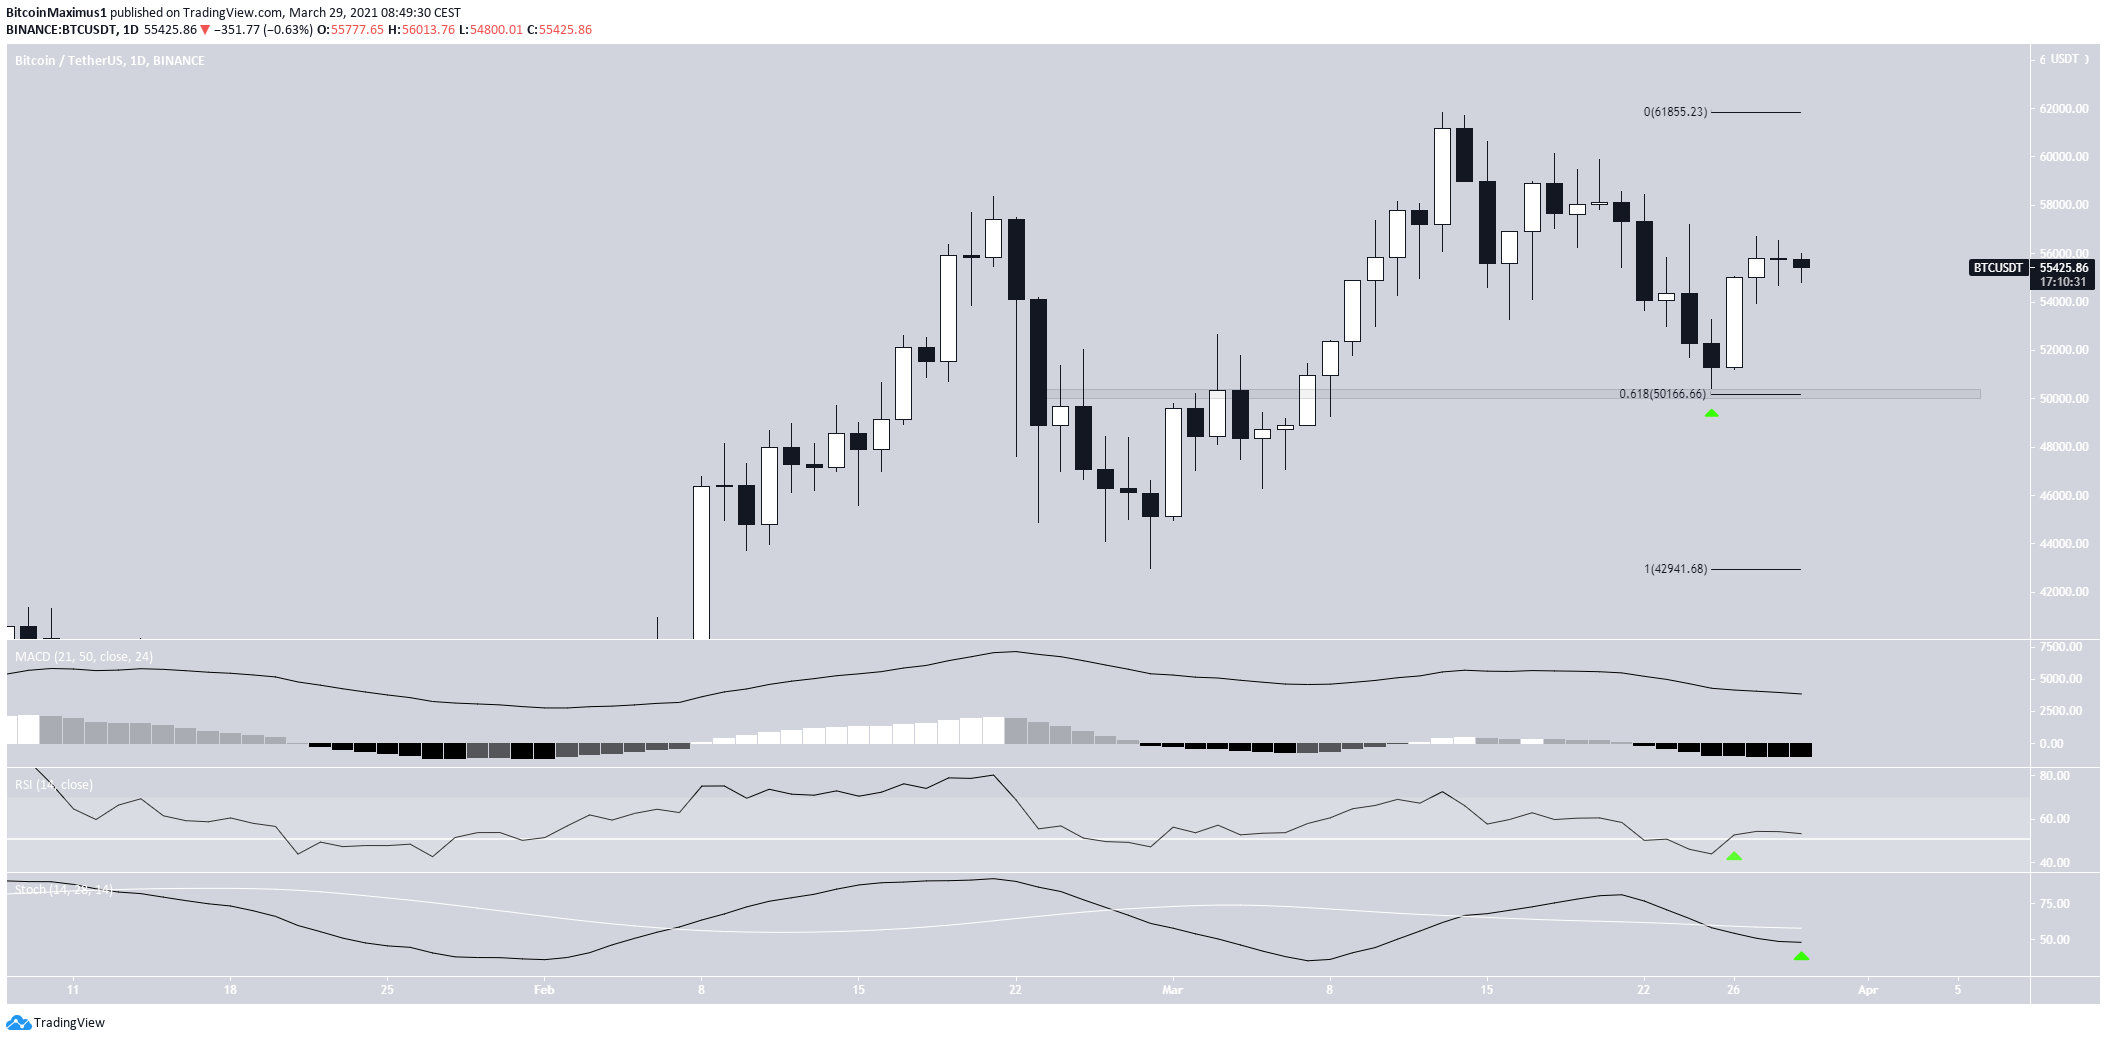
Ongoing BTC Bounce
The weekly chart shows that BTC has been decreasing since reaching an all-time high price of $61,884 on March 13.
The downward move ended with a pivot on March 25. This occurred right at the 0.618 Fib retracement level of $50,250. The next day, BTC created a bullish engulfing candlestick.
Technical indicators in the daily time-frame, however, still lack conviction. While the RSI has crossed back above 50, the MACD and Stochastic oscillator are bearish. However, the latter is showing signs of a potential reversal.
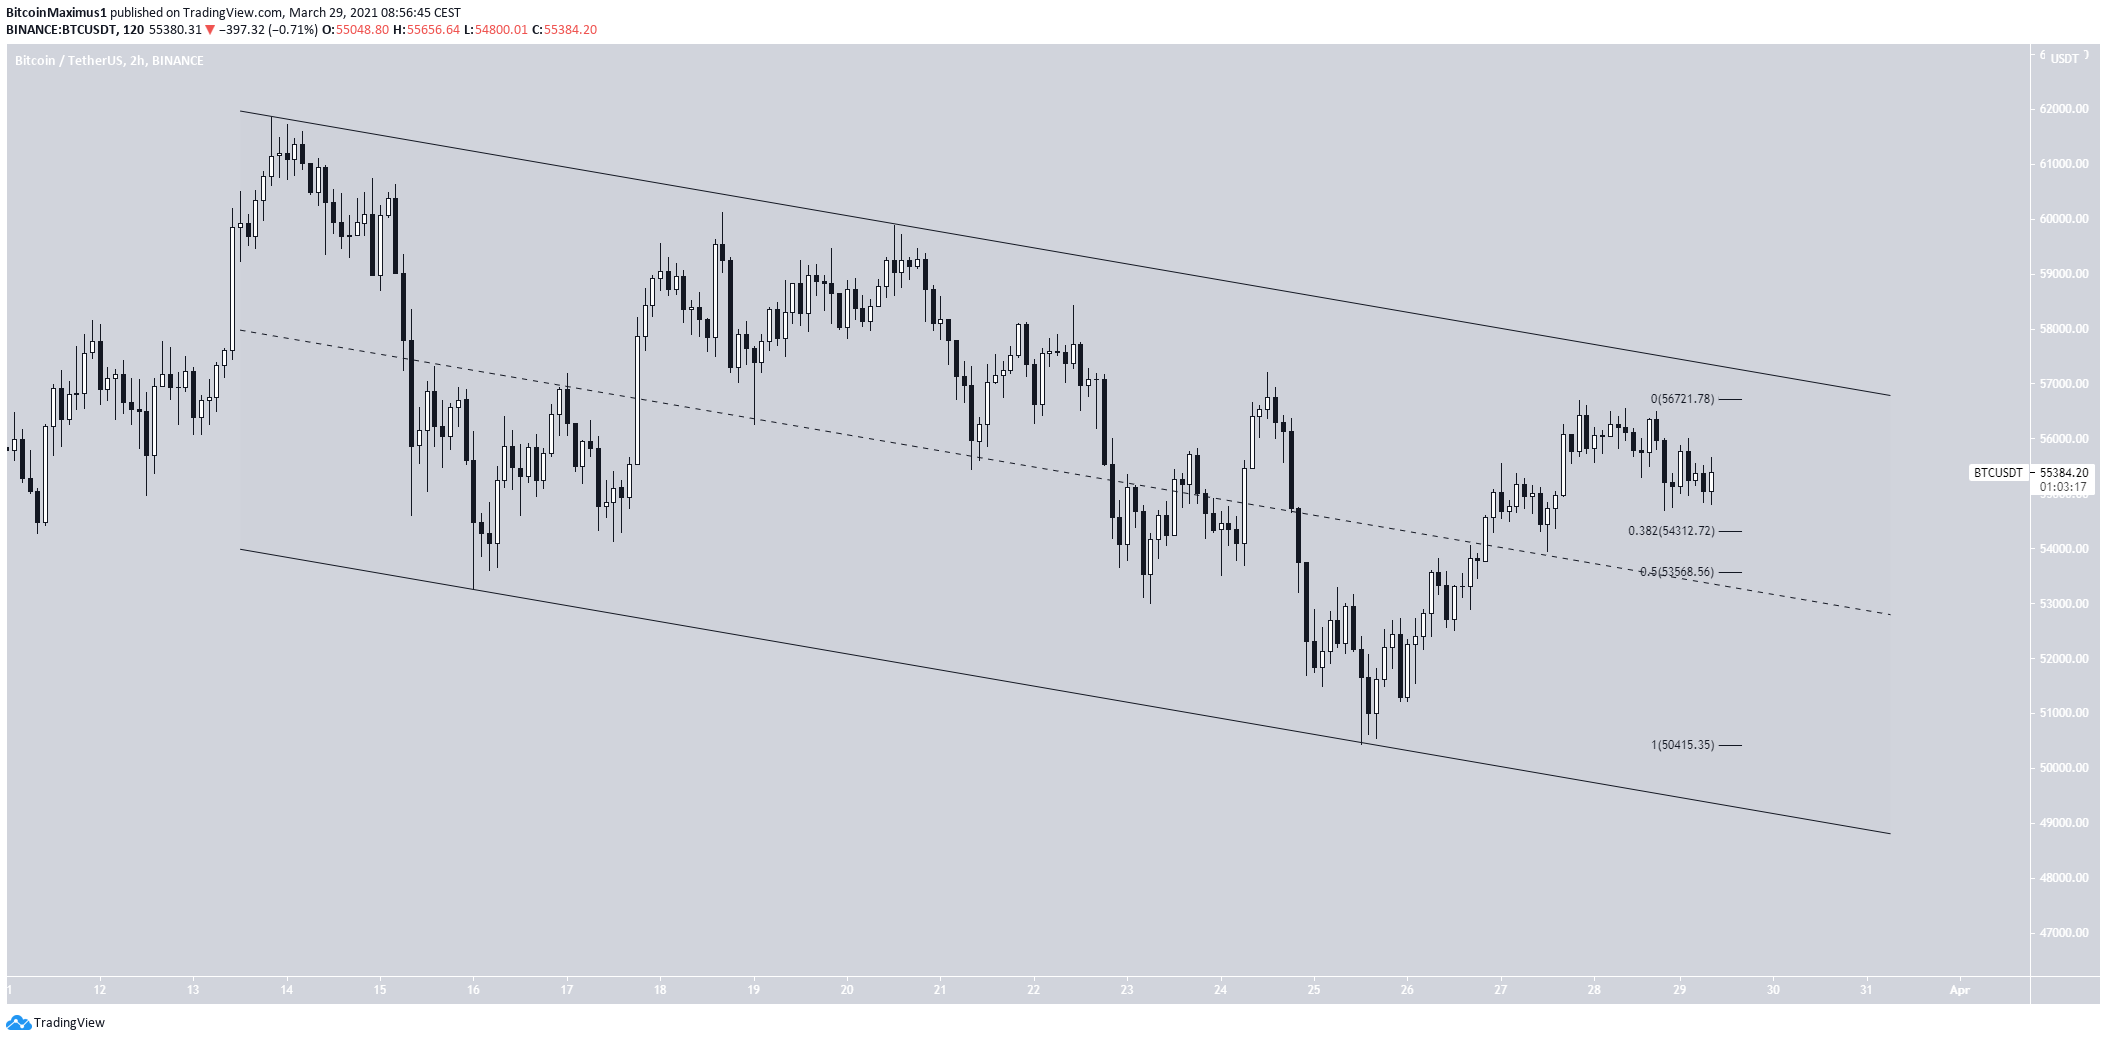
Short-Term Channel
The two-hour chart shows that BTC has been trading inside a descending parallel channel since reaching the aforementioned all-time high price.
This is often a corrective movement. Therefore, a breakout from this pattern would be expected.
BTC still has yet to drop to the 0.382 Fib retracement level. This would be a normal occurrence after a short-term upward movement.
Therefore, it’s possible that BTC drops to $54,300, or potentially $53,570, before resuming its upward movement. A breakout from the channel is expected.
$53,570 is the 0.5 Fib retracement level and is just above the middle of the channel. A decrease below this level would put the short-term bullish trend in doubt.
Conclusion
It’s likely that BTC continues the bounce that has been ongoing since March 25. This could cause a breakout from the short-term parallel channel.
While the long-term chart has begun to show weakness, a potential top has not yet been confirmed.
For BeInCrypto’s previous bitcoin (BTC) analysis, click here.
Trusted
Disclaimer
In line with the Trust Project guidelines, this price analysis article is for informational purposes only and should not be considered financial or investment advice. BeInCrypto is committed to accurate, unbiased reporting, but market conditions are subject to change without notice. Always conduct your own research and consult with a professional before making any financial decisions. Please note that our Terms and Conditions, Privacy Policy, and Disclaimers have been updated.
