

Bitcoin (BTC) seems to be in a short-term correction, after which a significant upward movement is expected to transpire.
BTC increased on Oct 25, creating a small bullish candlestick and moving to a high of $63,710 in the process. However, the increase was not enough to cause technical indicators to turn bullish.
The MACD, which is created by short and long-term moving averages is still falling, even though its positive. This means that while the short-term trend is still moving faster than the long-term trend, momentum is gradually deaccelerating.
The RSI, which is a momentum indicator, is decreasing. The indicator value above 50 means that momentum is still bullish, but it’s gradually slowing down, similar to the MACD.
The first support level is found at $56,600. This is only a minor support level since it’s created by the 0.382 short-term Fib retracement level (white) and is not a horizontal support area.
The main support is located between $52,400 and $53,350. This range is a confluence of support levels that contains:
- The 0.5 short-term Fib retracement support (white)
- The 0.382 long-term Fib retracement support (black)
- A horizontal support area.
Therefore, if the BTC price were to get fall back to these levels, the area would be expected to push the price back up.

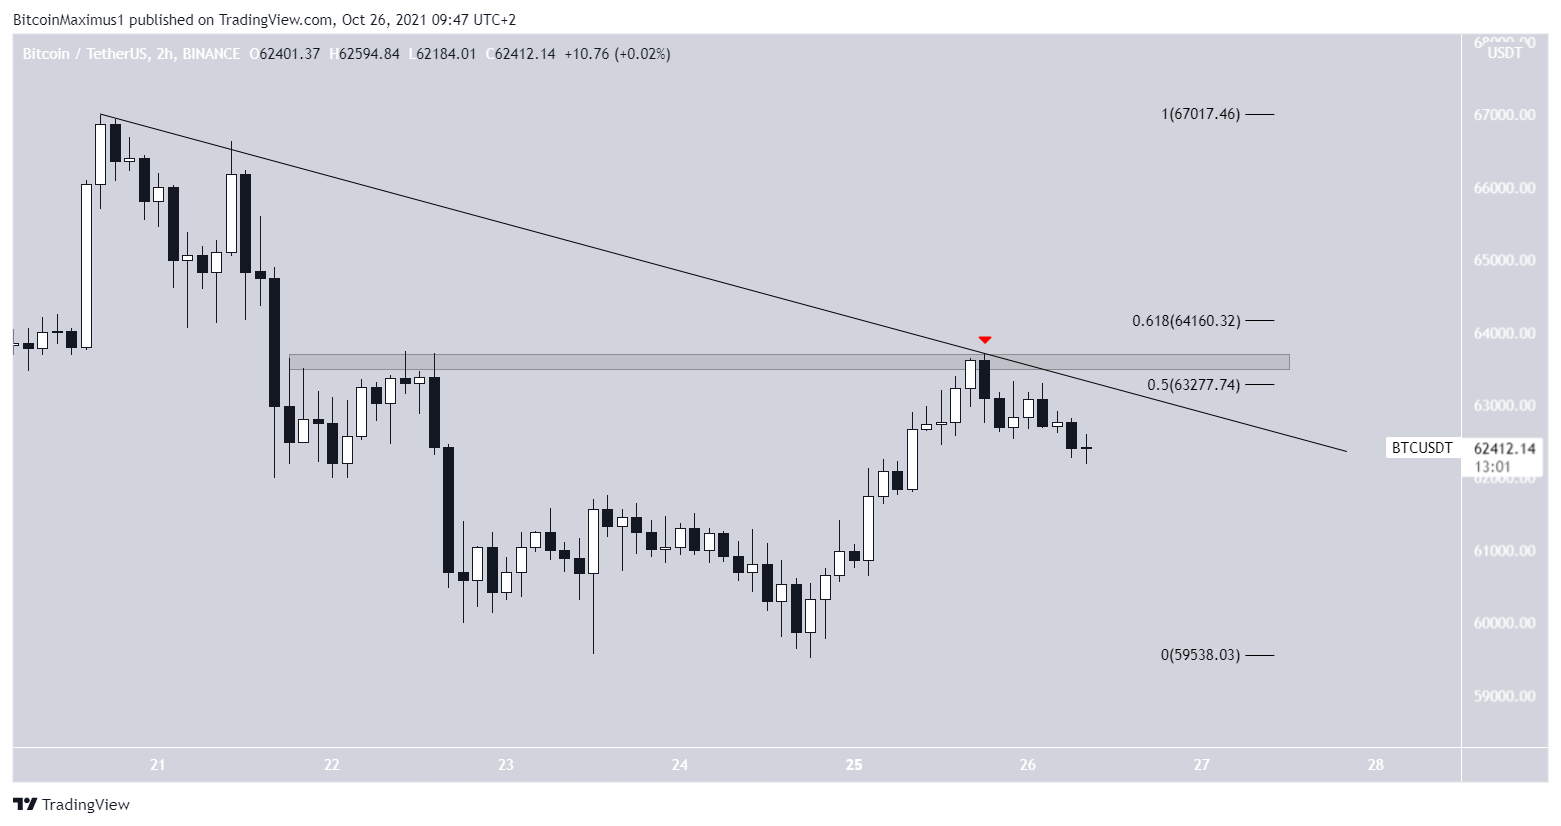
Short-term movement
The two-hour chart shows that BTC is moving underneath a descending resistance line. As long as it’s doing so, the short-term trend remains bearish. The line rejected BTC on Oct 25 (red icon), causing a brief dip. This also fits with the weaknesses outlined in the daily chart.
There are also resistance levels found between $63,300 and $64,150, created by the 0.5-0.618 Fib retracement resistance levels and a horizontal resistance area.
Bitcoin wave count
The short-term wave count shows that BTC is likely in an A-B-C corrective formation. This means that after the correction is finished, another rally would be expected to follow.
If waves A:C have a 1:1 ratio, BTC could move back to the minor support area outlined in the first section at $56,600.
For a long-term wave count analysis, click here.

For BeInCrypto’s previous Bitcoin (BTC) analysis, click here.
Trusted
Disclaimer
In line with the Trust Project guidelines, this price analysis article is for informational purposes only and should not be considered financial or investment advice. BeInCrypto is committed to accurate, unbiased reporting, but market conditions are subject to change without notice. Always conduct your own research and consult with a professional before making any financial decisions. Please note that our Terms and Conditions, Privacy Policy, and Disclaimers have been updated.
