Bitcoin is facing resistance at $58,000 and $64,900.
Weekly indicators are undecided but daily signals are bullish.
BTC has support at $53,300 and $51,800.
promo
The bitcoin (BTC) price has been moving upwards since it completed a correction on April 25.
Bitcoin is expected to find support at one of the short-term Fib retracement support levels and resume its upward movement.
Weekly outlook for BTC
BTC has been moving upwards since April 25 after it reached a local low of $46,930.
Last week, it increased slightly but failed to reach a new all-time high.
Technical indicators for BTC provide a mixed outlook. There is a significant weakness in the form of a decreasing MACD and potential bearish cross in the Stochastic oscillator. However, the former is still positive and the latter has yet to confirm a bearish cross.
On the other hand, the RSI has generated a hidden bullish divergence. This is normally a strong sign of trend continuation.
Therefore, the readings from the weekly time frame are not sufficient to determine the direction of the trend.
BTC Chart By TradingView
Current movement
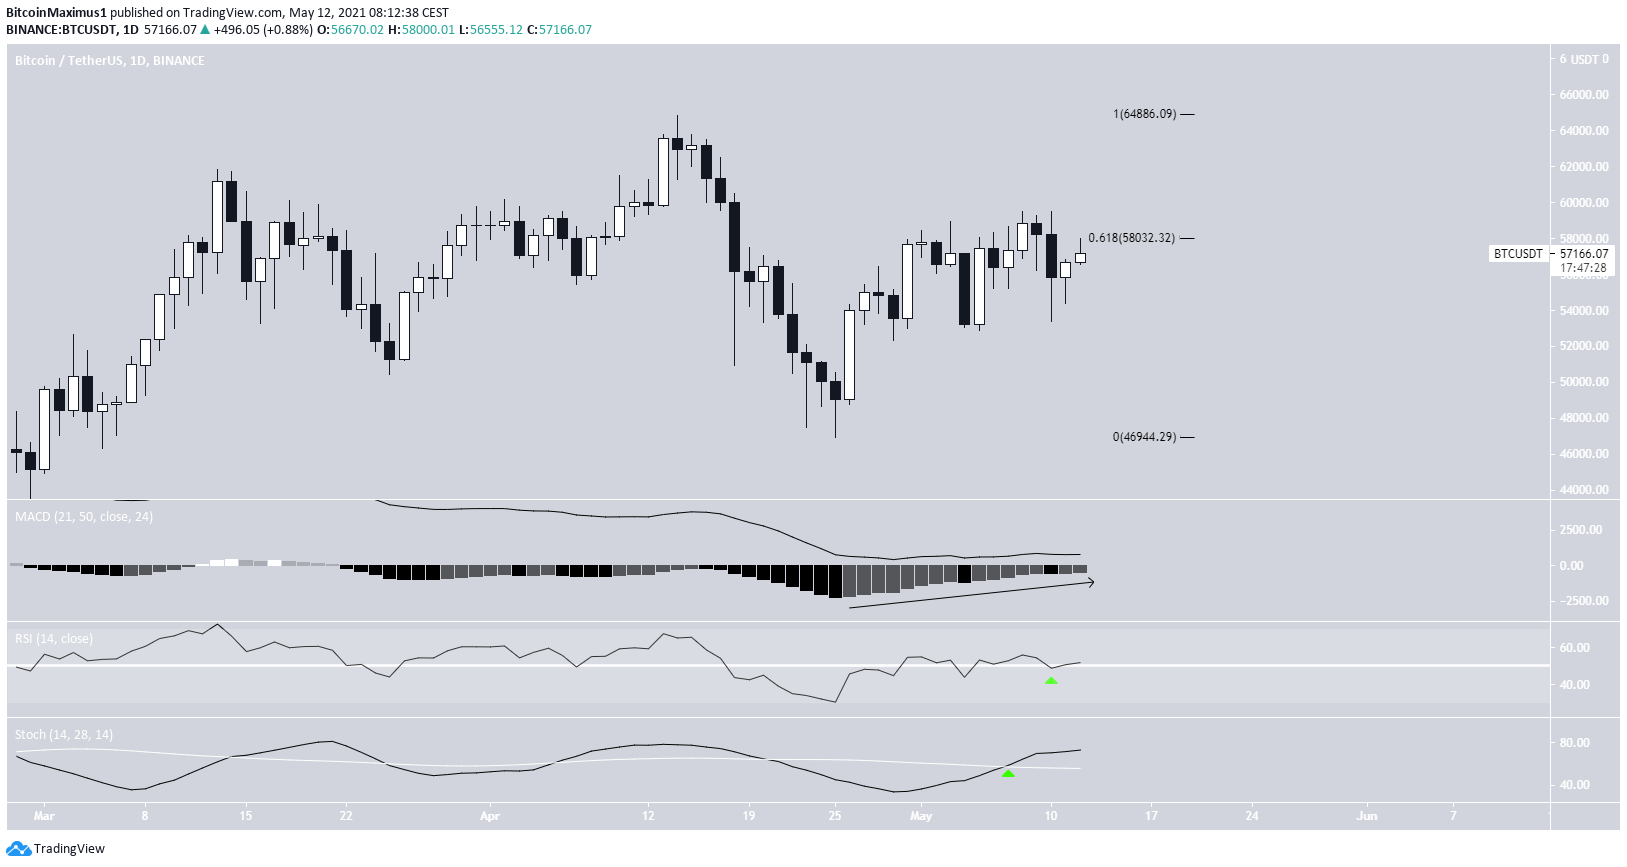
The daily chart provides a more bullish outlook. While the price is currently facing resistance at the 0.618 Fib retracement level at $58,000, technical indicators remain bullish.
The MACD is increasing and has nearly crossed into positive territory, the RSI has moved above the 50-line, and the Stochastic oscillator has made a bullish cross.
These signs indicate that the trend is likely still bullish and BTC should continue to head upwards. If it breaks out, the next resistance area would likely be found at $64,900.
BTC Chart By TradingView
BTC wave count
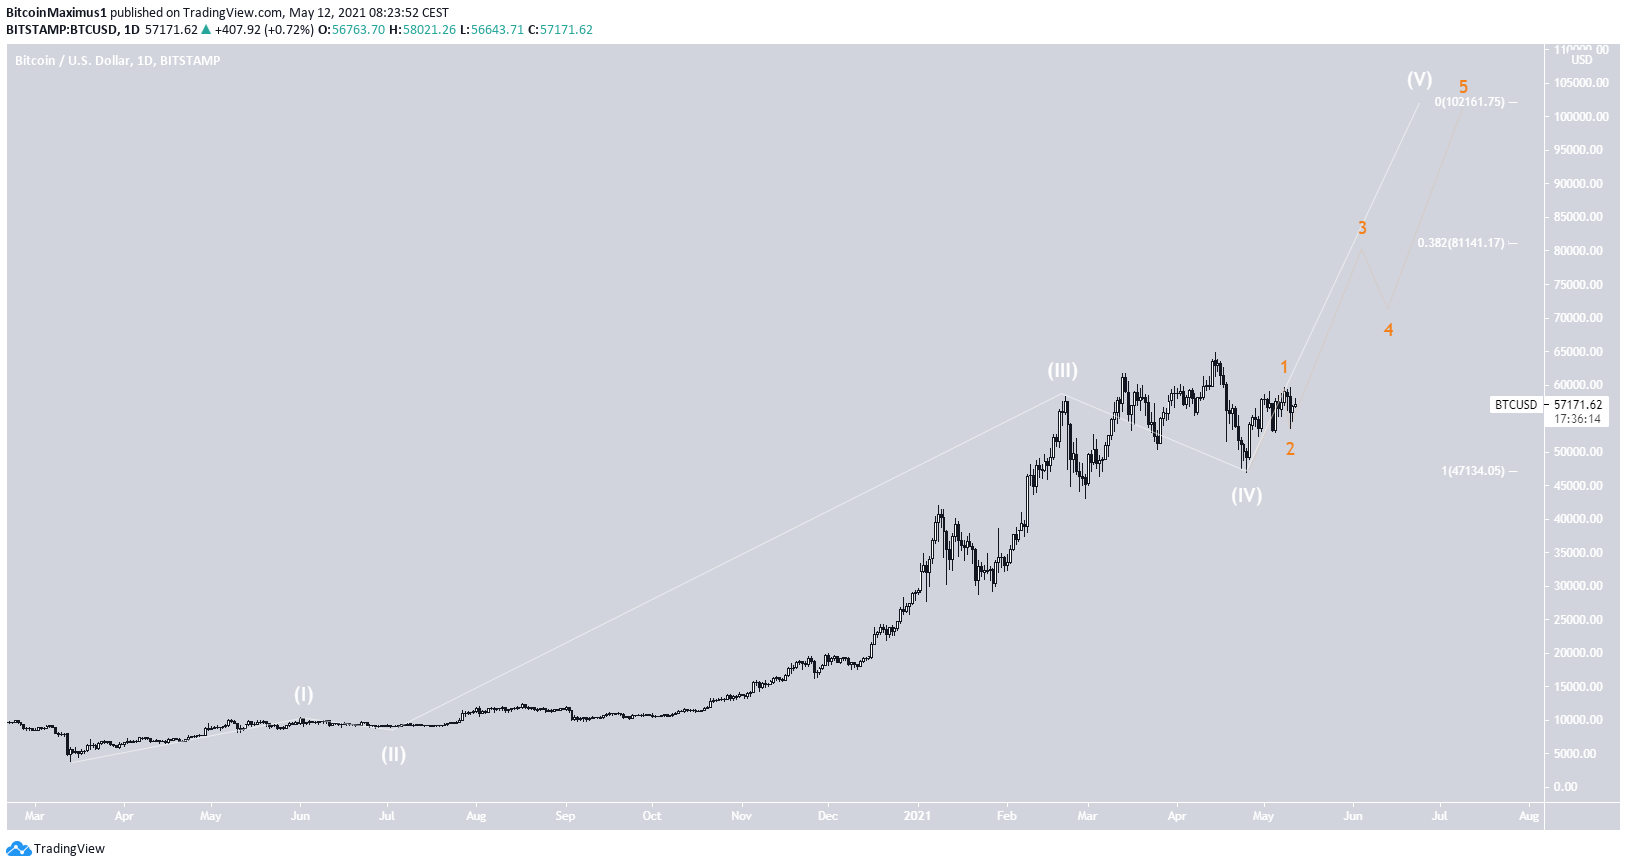
The wave count suggests that BTC is in wave five (white) of a long-term bullish impulse that began in March 2020. Within this pattern, wave four was a running flat correction, which is often followed by a sharp movement in the other direction.
The wave count is shown in orange.
The two most likely targets for the top of this movement are found at $81,150 and $102,150.
BTC Chart By TradingView
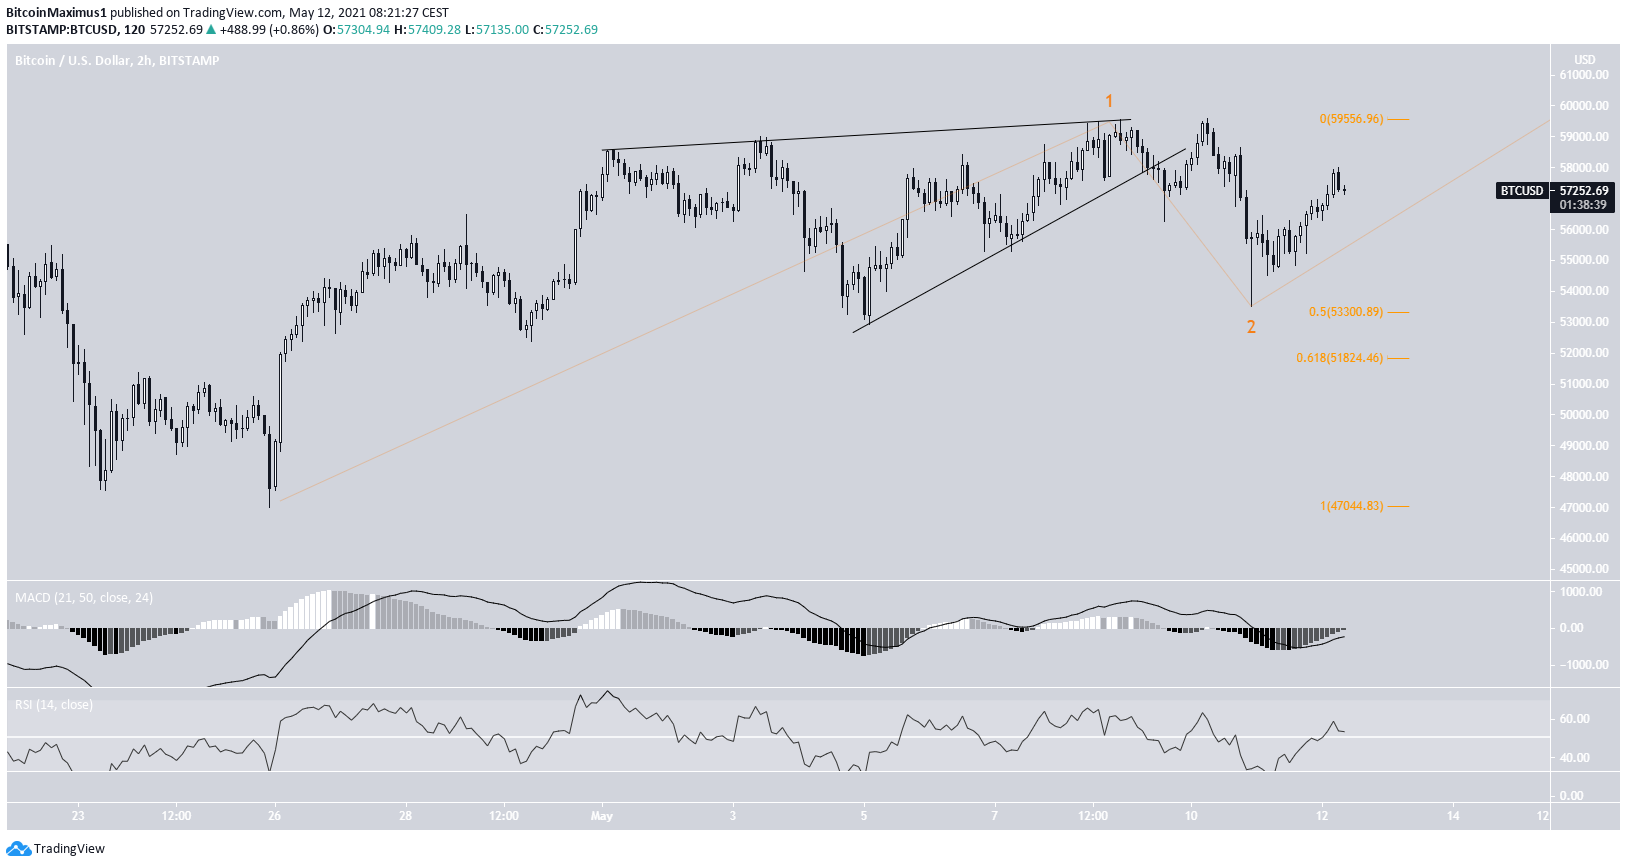
The short-term wave count suggests that BTC was following a leading diagonal that ended with an ascending wedge.
BTC has already bounced at the 0.5 Fib retracement support level at $53,300.
While it’s possible that BTC continues to drop towards the 0.618 Fib retracement level, technical indicators in the two-hour time frame are bullish. Therefore, it’s more likely that it continues moving upwards from the current level.
BTC Chart By TradingView
Conclusion
Bitcoin is expected to find support at one of the short-term Fib retracement levels located at $53,300 and $51,800. Afterward, it’s expected to gradually move upwards towards a new all-time high price.
In line with the Trust Project guidelines, this price analysis article is for informational purposes only and should not be considered financial or investment advice. BeInCrypto is committed to accurate, unbiased reporting, but market conditions are subject to change without notice. Always conduct your own research and consult with a professional before making any financial decisions. Please note that our Terms and Conditions, Privacy Policy, and Disclaimers have been updated.
Valdrin discovered cryptocurrencies while he was getting his MSc in Financial Markets from the Barcelona School of Economics. Shortly after graduating, he began writing for several different cryptocurrency related websites as a freelancer before eventually taking on the role of BeInCrypto's Senior Analyst.
(I do not have a discord and will not contact you first there. Beware of scammers)